News

2 Nov 2021 - Building a world with a little more Yum!
|
Building a world with a little more Yum! Magellan Asset Management 28 September 2021 In early 2020, David Gibbs took the helm of Yum! Brands, the American fast-food giant that operates well-known brands including KFC, Pizza Hut and Taco Bell, to name a few. After rising through Yum!'s ranks over the decades, becoming President and COO before being promoted to CEO in 2020, he was soon face to face with a worldwide pandemic. In this episode, we hear how Yum! and its 51,000 restaurants in 150 countries successfully navigated the global shutdown. David also unpacks Yum!'s rise , the enduring focus on people, culture and growth, and how it continues to identify opportunities and build a world with a 'little more Yum!' |
|
Funds operated by this manager: Magellan Global Fund (Hedged), Magellan Global Fund (Open Class Units) ASX:MGOC, Magellan High Conviction Fund, Magellan Infrastructure Fund, Magellan Infrastructure Fund (Unhedged), MFG Core Infrastructure Fund |

1 Nov 2021 - Market volatility does not change key drivers of the share market
|
Market volatility does not change key drivers of the share market ST Wong, Prime Value Asset Management October 2021 Recent market volatility will likely impact the Australian share market in the short-term, driven largely by volatility in the commodities market. The concerns over commodities can be traced back to problems with Chinese property company Evergrande, which is currently experiencing a debt crisis. This has understandably fed anxiety over China's near term demand for commodities such as iron ore. Evergrande's story is an interesting one, and reminds me a little of some companies I analysed when I was based in Malaysia during the Asian Financial Crisis in the 1990s. Similar to a number of Asian companies, particularly property companies in the 1990s, Evergrande over-extended its balance sheet and engaged in number of non-core businesses. During the Asian Financial Crisis, I recall biscuit manufacturing companies over-geared to enter property development on a big scale, only to see demand shrivel. Evergrande fits that bucket of over-geared companies venturing across non-core businesses then finding themselves in a tangle--in Evergrande's case, a US$300bn tangle. However, while the Asian Financial Crisis reflected widespread systemic problems, Evergrande does not look like a systemic issue. It is more an economic problem. The financial institutions in Asia are not overly exposed by Evergrande's debt challenges, and the Chinese financial services industry can absorb this issue. Chinese policy makers have been on the Evergrande case for over a year, working to ring fence the issue to stave off systemic risks. Similar to developed economies, the Chinese authorities value consumer confidence, and we expect them to bolster the diminishing confidence in the Chinese property market. Evergrande is likely to remain in the news headlines over the next few months. This is because information surrounding the short-term specifics of Evergrande's problems are not known. Further, we are uncertain of China's policy approach to reduce excessive investment and speculation in properties--Chinese authorities may look to reduce the leverage of financial institutions and property companies. The consequence is for lower, but more stable, Chinese economic growth. While we expect commodities to be volatile short-term, when we look through the current noise to consider the next 18-24 months, commodities look sound. However, markets react to short-term concerns which is why stocks such as BHP look like they have been recently oversold. At Prime Value, we believe the key drivers to economic and market performance have not changed. The key factors are:
We can expect many bumps along the way, but the opportunities to pick good companies through this next economic cycle looks promising. Funds operated by this manager: Prime Value Growth Fund - Class A, Prime Value Equity Income (Imputation) Fund - Class A, Prime Value Opportunities Fund, Prime Value Emerging Opportunities Fund |

1 Nov 2021 - New Funds on Fundmonitors.com
|
New Funds on Fundmonitors.com |
|
Below are some of the funds we've recently added to our database. Follow the links to view each fund's profile, where you'll have access to their offer documents, monthly reports, historical returns, performance analytics, rankings, research, platform availability, and news & insights. |
|
|
||||||||||||||||||||||||||||
| T. Rowe Price Global Growth Equity Fund | ||||||||||||||||||||||||||||
|
||||||||||||||||||||||||||||
|
||||||||||||||||||||||||||||
|
||||||||||||||||||||||||||||
| View Profile | ||||||||||||||||||||||||||||
|
Want to see more funds? |
||||||||||||||||||||||||||||
|
Subscribe for full access to these funds and over 600 others |
||||||||||||||||||||||||||||

29 Oct 2021 - Inching Towards Normal But Not Without Risks
|
Inching Towards Normal But Not Without Risks Delft Partners October 2021 |
Global equities had a better time recently, and we believe they should marginally outperform bonds in the coming weeks. There are signs of a broader reopening underway that we expect should boost consumer confidence and spending. Consequently, we should see downgrades to global growth forecast abate. However, there are two risks to a pro-equity call. First, the spike in inflation will lead to a quicker tightening by central banks, and second, there is a marked deterioration in the Chinese economy on the back of the problems in the property sector there. We believe central banks will be worried that the pick-up in energy prices will undermine consumer spending resurgence and remain slow to tighten monetary policy. But China continues to concern us. Global equities have recovered their poise but have failed to make much progress over the past five months. The surge in inflation has undoubtedly provided a drag. However, the challenges posed by the delta variant of COVID have proved to be as much a dampener. Economic activity has lost momentum; the re-openings in many economies have gone into the reverse, leading to a slowing of consumer spending and employment growth.
Nevertheless, the drop in COVID cases of late has been encouraging. Several governments have quickly moved towards reopening their economies, taking down a considerable number of the barriers to movement. The newfound freedom is most apparent in the considerably reduced number of countries on travel 'red lists', enabling people to travel more freely. Greater freedom to travel alone has the power to increase consumer confidence and lead to increased consumer spending and GDP growth. While the diminished impact of COVID is a positive for consumer spending, we have to concede that the rise in inflation, particularly the recent rise in energy prices, is harmful. The increase in gas prices in the past quarter has been quite extraordinary. Gas prices are up a whopping 150% in Europe; the US has seen a 50% surge. As Chart 2 shows, the recent spate of economic data has often been below expectations. That could be about to change as the current round of downgrades to GDP forecasts washes through the system. Daily US COVID cases peaked in the latest wave on the 3rd of September and fell steadily since. However, it's not just about the daily cases. It is about the reaction of governments to the COVID situation. In the UK, the daily COVID count has been around 30,000 for the past three months; however, the government has just substantially reduced barriers to overseas travel. Indeed, people from the UK can now travel to Singapore and vice versa. At the weekend, the Singapore government pleasantly surprised the country by relaxing the restrictions on overseas travel with travel lanes opened with eight countries. Singapore now has travel lanes for fully vaccinated passengers from the US, the UK, Denmark, France, the Netherlands, Spain, Italy and Germany.
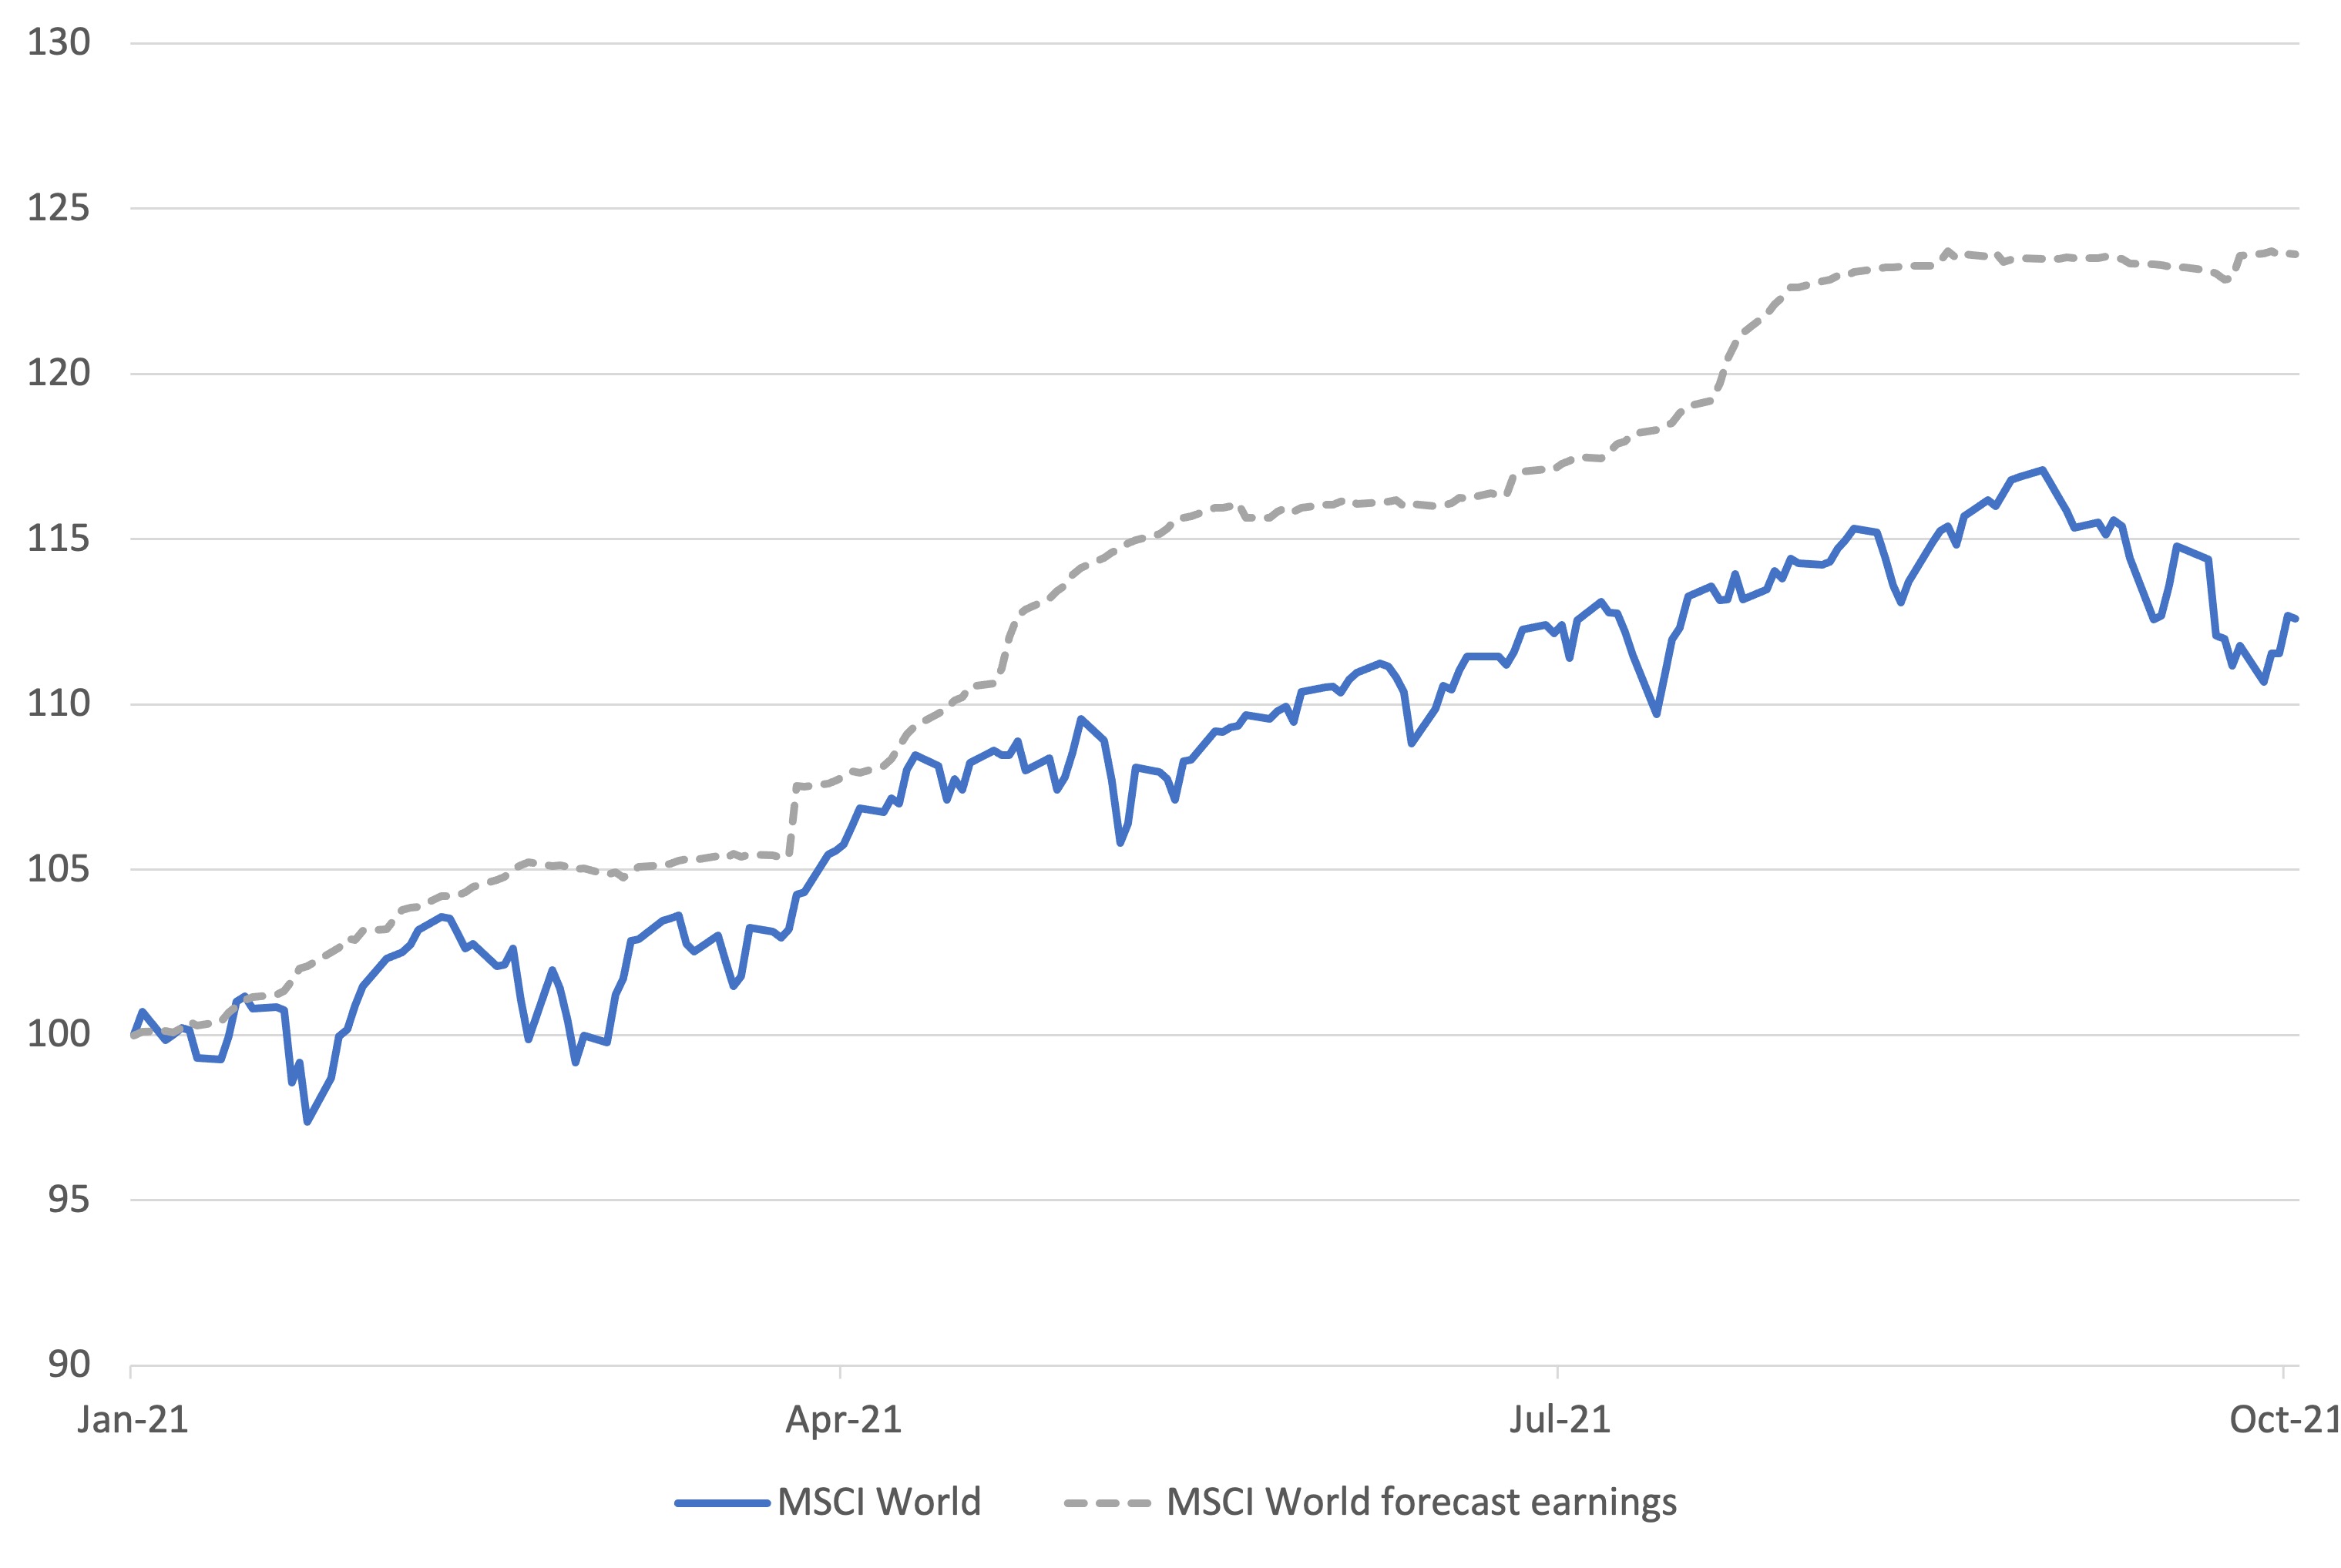
The pause in the equity markets' advance has led to a more substantial gap between the rise in the level of consensus corporate profit expectations for 2021 and the level of the global equity index (Chart 3). The expected level of corporate profits has risen nearly 24% year-to-date, yet the global equity index is up just 12%.
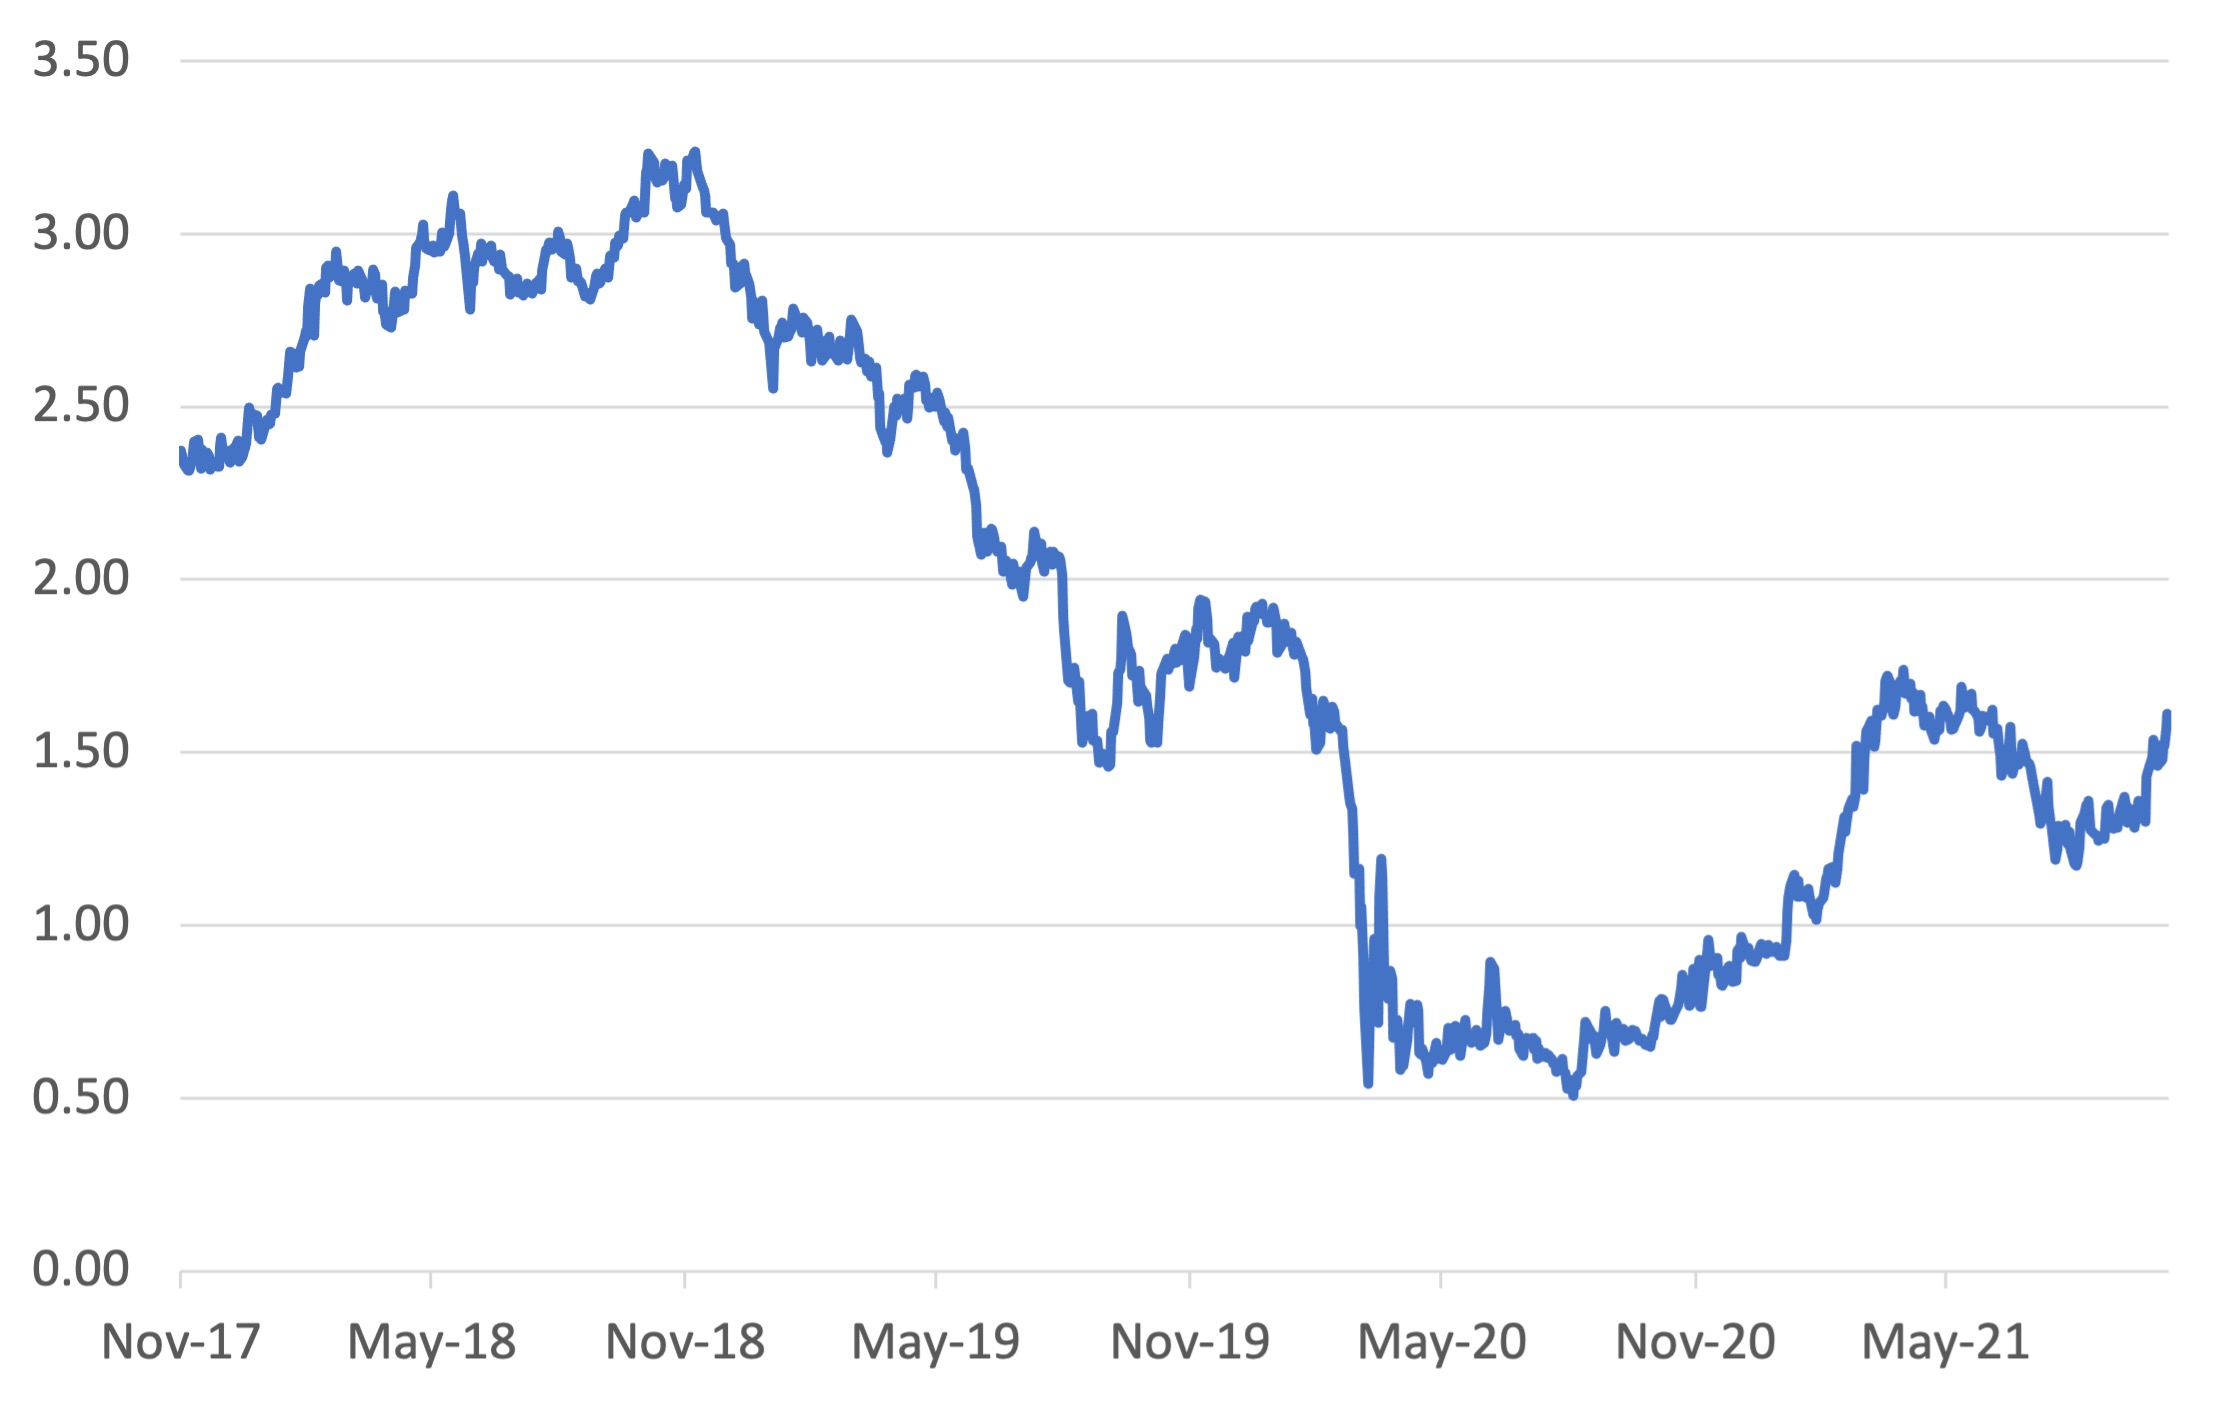
We expect investors to take a more positive view of the upside for equities. With bond markets under pressure from higher yields, equities remain the asset class of investor choice. The market sees the spike in global inflation as much less transitory than before. The quick pace of the US 10-year bond yield rise suggests it may have further to go, potentially through the 1.70% level in the coming days. It is noteworthy that the spike has occurred at a time of weakening global growth. Given that backdrop, consider where the yield might be if we have a recovery in consumer spending, ongoing higher-than-expected energy prices and a global re-stocking cycle, all meeting still dysfunctional supply lines. Even though last week's headline US employment growth disappointed the market, the stronger-than-expected working hours and wage growth figures kept the bond market from rallying.
The most significant global risk to a more positive tone to the global asset markets is the Chinese property market angst. It has almost become a game of chicken between investors and the government to see who blinks first. Evergrande equity is suspended, and its debt is trading in the low 20 cents in the dollar. Across the Chinese property debt market, prices have fallen on the news that Evergrande's problems have led to a buyers' strike at property development sites. Property development unit sales are down on average by 35% year on year. Property developer liquidity is being squeezed by a lack of pre-sales, an offshore bond market that has largely dried up and an onshore banking market that is at its limit. The great hope among investors is that the Chinese government will step in and relax onshore banking limits. However, that may require them to compromise on the three red lines that they set as the de minimis requirement for companies to be on the right side of regulations to receive funding. At this point, it is reported that 50% of the top 30 developers are in breach of at least one of the red lines. |
|
Funds operated by this manager: Delft Partners Global High Conviction Strategy, Delft Partners Asia Small Companies Strategy, Delft Partners Global Infrastructure Strategy |

28 Oct 2021 - 10k Words - October Edition
|
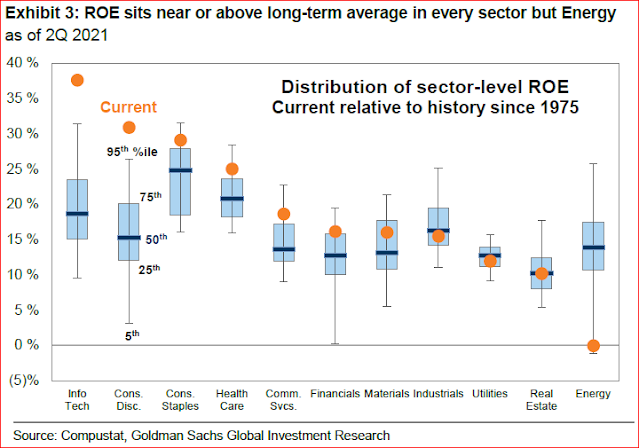
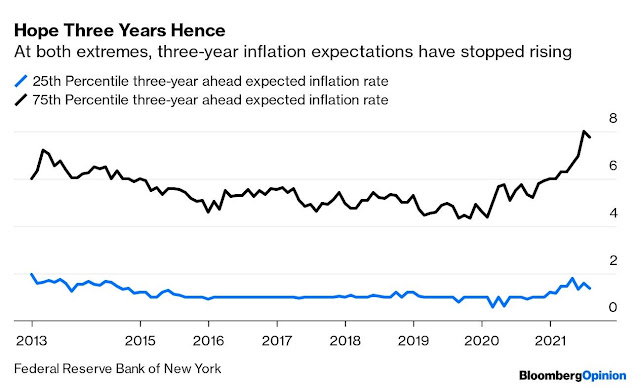
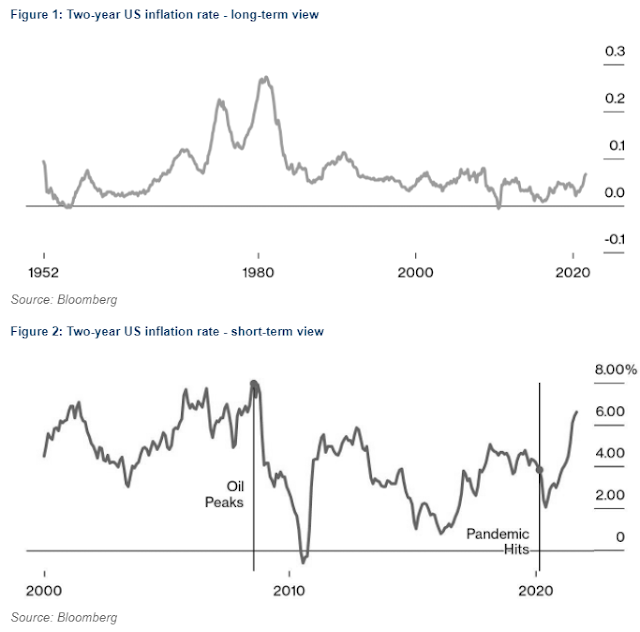
10k Words - October Edition Equitable Investors October 2021 This month we start off with a picture that really does tell a story - Goldman Sachs looking at Return on Equity at an industry level and where it sits currently relative to the past. Bloomberg has the inflation story covered off, showing expectations at both extremes had levelled off after recent rises and providing greater perspective by using a two-year inflation figure. Then we leverage off charts we have highlighted in recent weekly Small Talk updates to Equitable Investors' clients: The FT showed us how equity portfolio weightings to China and Hong Kong have been in decline. Kailash Capital charts the huge run in US price/sales multiples back to "dot.com" levels (albeit in a different interest rate and cost of capital regime) and we look at how Australian small business is searching for finance. Return on Equity by Industry (US)
Source: Goldman Sachs
Inflation expectations in the US have increased but at the extremes the rise has come to a stop
Source: Bloomberg Two-year inflation rate over long-term and short-term views
Price/Sales in the US market now v. "Dot.com" era
Global equity funds reducing exposure to China and Hong Kong
The search for "business loans" in Australia
Source: Google, Equitable Investors
Disclaimer Nothing in this blog constitutes investment advice - or advice in any other field. Neither the information, commentary or any opinion contained in this blog constitutes a solicitation or offer by Equitable Investors Pty Ltd (Equitable Investors) or its affiliates to buy or sell any securities or other financial instruments. Nor shall any such security be offered or sold to any person in any jurisdiction in which such offer, solicitation, purchase, or sale would be unlawful under the securities laws of such jurisdiction. The content of this blog should not be relied upon in making investment decisions.Any decisions based on information contained on this blog are the sole responsibility of the visitor. In exchange for using this blog, the visitor agree to indemnify Equitable Investors and hold Equitable Investors, its officers, directors, employees, affiliates, agents, licensors and suppliers harmless against any and all claims, losses, liability, costs and expenses (including but not limited to legal fees) arising from your use of this blog, from your violation of these Terms or from any decisions that the visitor makes based on such information. This blog is for information purposes only and is not intended to be relied upon as a forecast, research or investment advice. The information on this blog does not constitute a recommendation, offer or solicitation to buy or sell any securities or to adopt any investment strategy. Although this material is based upon information that Equitable Investors considers reliable and endeavours to keep current, Equitable Investors does not assure that this material is accurate, current or complete, and it should not be relied upon as such. Any opinions expressed on this blog may change as subsequent conditions vary. Equitable Investors does not warrant, either expressly or implied, the accuracy or completeness of the information, text, graphics, links or other items contained on this blog and does not warrant that the functions contained in this blog will be uninterrupted or error-free, that defects will be corrected, or that the blog will be free of viruses or other harmful components.Equitable Investors expressly disclaims all liability for errors and omissions in the materials on this blog and for the use or interpretation by others of information contained on the blog Funds operated by this manager: |

28 Oct 2021 - Global Matters: Infrastructure, interest rates & inflation

27 Oct 2021 - Stock Story: Seven Group
|
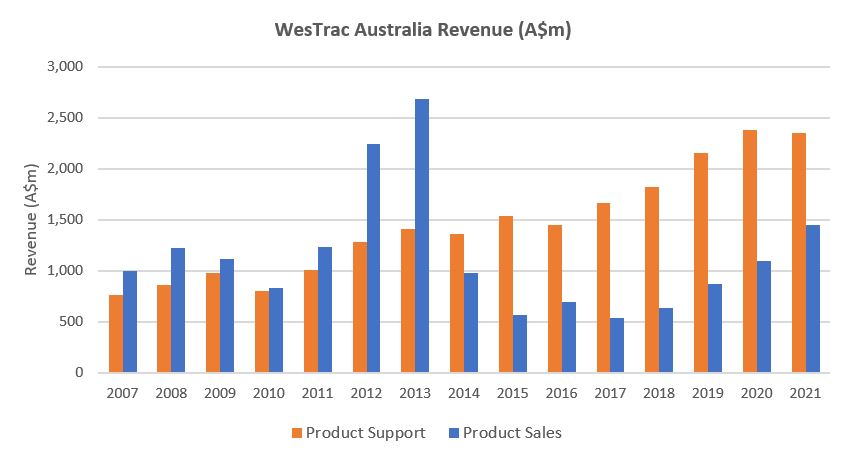
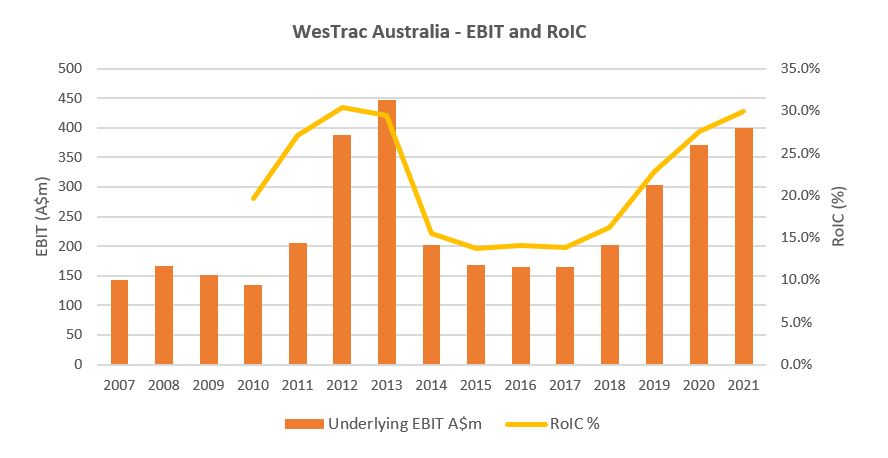
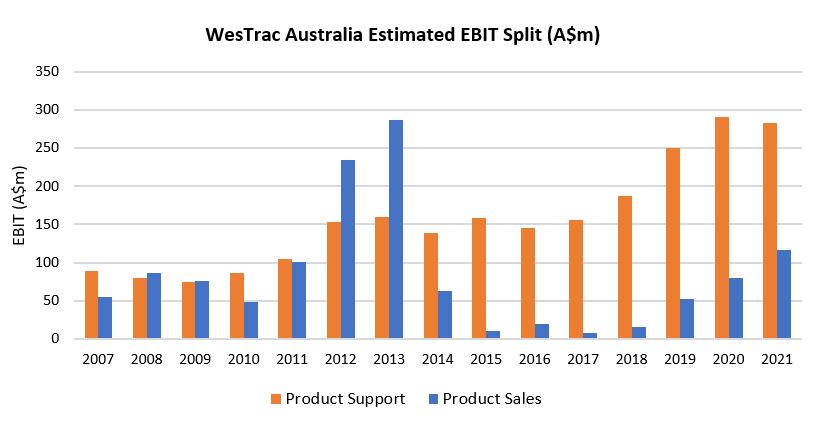
Stock Story: Seven Group Joe Wright, Airlie Funds Management 18 October 2021 Hiding in plain sight? At Airlie, we look to invest in quality companies that we believe are undervalued by the market. Often these opportunities emerge when a great business sits within an otherwise mediocre sector, or when the market assigns an arbitrary discount to a type of business. For us, Seven Group Holdings (SVW) falls into both categories. Seven is a conglomerate of industrial businesses. Two of these businesses sit in sectors often unloved by investors for their volatile returns and capital intensity - mining services (WesTrac) and equipment rental (Coates). Furthermore, in listed equities 'conglomerate' is a dirty word. It can imply complexity, opacity and bloat, where the corporate structure of the company sits at odds with interest of the shareholders, and many investors choose to avoid conglomerates for these reasons. In our mind, WesTrac and Coates are quality businesses sitting within mediocre industries, pushed further out of sight by the conglomerate structure of Seven. While investors digest the highly publicised on-market takeover of Boral or lament the decline of the namesake Free To Air TV business (Seven West Media), WesTrac and Coates quietly demonstrate their quality and form the majority of our valuation of Seven. WesTrac - Less cyclical than it appears?WesTrac is the authorised Caterpillar dealer in Western Australia, New South Wales and the Australian Capital Territory, providing heavy equipment sales and support to customers. Caterpillar employs an independent dealership sales model for its heavy machine sales and support services. Caterpillar thinks this model fosters a stronger relationship between dealers and local customers (acknowledging the importance of high-quality after-sales service and support) and allows Caterpillar to focus its capital allocation on product development and innovation. WesTrac sales are given in two segments - product sales (i.e. machine sales) and product support. Product sales have been reasonably cyclical, tied to future production volumes and the fleet replacement cycle of the tier-1 and tier-2 miners (and at a second derivative, commodity prices and miner profitability). Product support sales have been far more steady, growing at a 10-year rate of 7.0%, as new sales enter the maintenance program and old equipment sees parts intensity increase and its life extended.
Finally, Caterpillar has an internal target of doubling its revenue from product services (via the dealership network) by 2026, as it looks to take advantage of fleet-replacement cycle extensions and expanded product lifecycle offering.
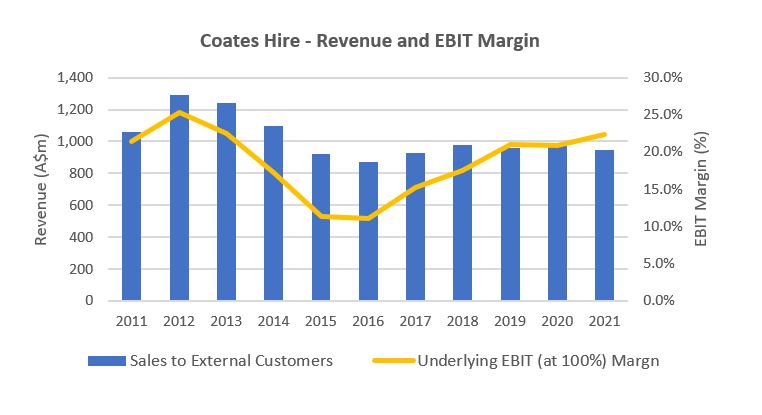
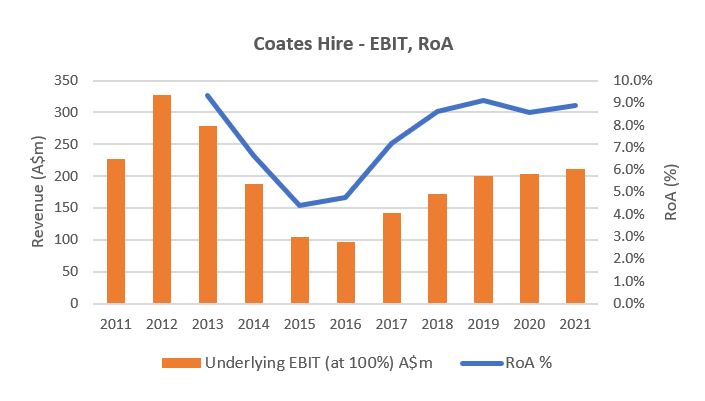
The net of this is that we believe WesTrac is far less cyclical than typical mining-services businesses, and earns stronger returns through the cycle, and should be valued as such. Coates - Impressive transformation ahead of a revenue inflection?Coates Hire is Australia's largest general equipment hire company and provides a range of general and specialist equipment to a variety of markets including engineering, building construction and maintenance, mining and resources, manufacturing, government and events. The business is primarily exposed to east coast infrastructure, industrial and residential projects, as well as resources activity. The Coates business is thriving. Following the resources boom earlier in the decade, Coates' margins slumped from about 25% to about 11% as revenue fell from about A$1.3 billion to A$870 million (-32%) from FY12 to FY16. Management has since undertaken a material cost-out, transformation program that has been delivered incredibly successfully:
For FY22, management has guided to high single-digit EBIT growth. Looking further out, management is driving the business towards the internal 'Team25' project goals. Team25 is a continuation of the existing transformation strategy within Coates with the business targeting A$1.25 billion of revenue and a 25% EBIT margin. Part of the success of the Team25 targets will rely on revenue growth driven from increased market share and east coast infrastructure spend, however cost-out initiatives still form part of the strategy. Were management to successfully execute on the Team25 targets, Coates would deliver about $313 million of EBIT, versus A$212 million in FY21 (+48% overall, or a 10% CAGR to FY25). The takeaways for us are two-fold:
Coates' margins and returns sit in the top-quartile of the global equipment rental sector, and there remains the potential for considerable earnings growth over the next two to three years (on top of that delivered steadily since 2016). Both of these factors suggest to us that the business is of higher quality than most would expect of typical rental equipment companies. ValuationOf course, Seven does not just consist of WesTrac and Coates. Within the conglomerate also sit stakes in listed companies Boral (70%), Beach Energy (30%) and Seven West Media (40%), as well as unlisted energy, media and property holdings. Of these investments, the recently acquired 70% stake in Boral is the most material (and where valuation is arguably most up for debate). Including the Boral investment, we estimate Seven is trading on a P/E multiple of sub 14x FY22 earnings, which is a about a 25% discount to the S&P/ASX 200, and in our mind an undemanding valuation. In our 'sum of the parts' analysis of the business, we see upside to the current share price when taking a more mid-cycle view of the earnings of WesTrac and Coates, and before including any material valuation upside to the Boral business, should management successfully execute the transformation program and unlock additional value in the non-core property portfolio. Finally, our confidence in the conglomerate structure comes back to ownership. Seven remains 60% owned by the Stokes family, with Kerry Stokes in the chairman role and his son Ryan as CEO. In our view this gives shareholders significant alignment with the board and management, and we have found that through time founder-led businesses tend to consistently outperform the broader index. Sources: Company filings and website |
|
Funds operated by this manager: Airlie Australian Share Fund |

27 Oct 2021 - Why consistency wins the race
|
Why consistency wins the race Magellan Asset Management October 2021
|
|
Timestamps: 01:10 - Fund objective 09:10 - Investment outlook 16:30 - Microsoft 21:58 - Netflix 28:11 - Why invest in China? Consumption / GDP Australia vs China Funds operated by this manager: Magellan Global Fund (Hedged), Magellan Global Fund (Open Class Units) ASX:MGOC, Magellan High Conviction Fund, Magellan Infrastructure Fund, Magellan Infrastructure Fund (Unhedged), MFG Core Infrastructure Fund |

26 Oct 2021 - Investment Perspectives: Don't fear the taper
|
Investment Perspectives: Don't fear the taper Quay Global Investors October 2021 |
|
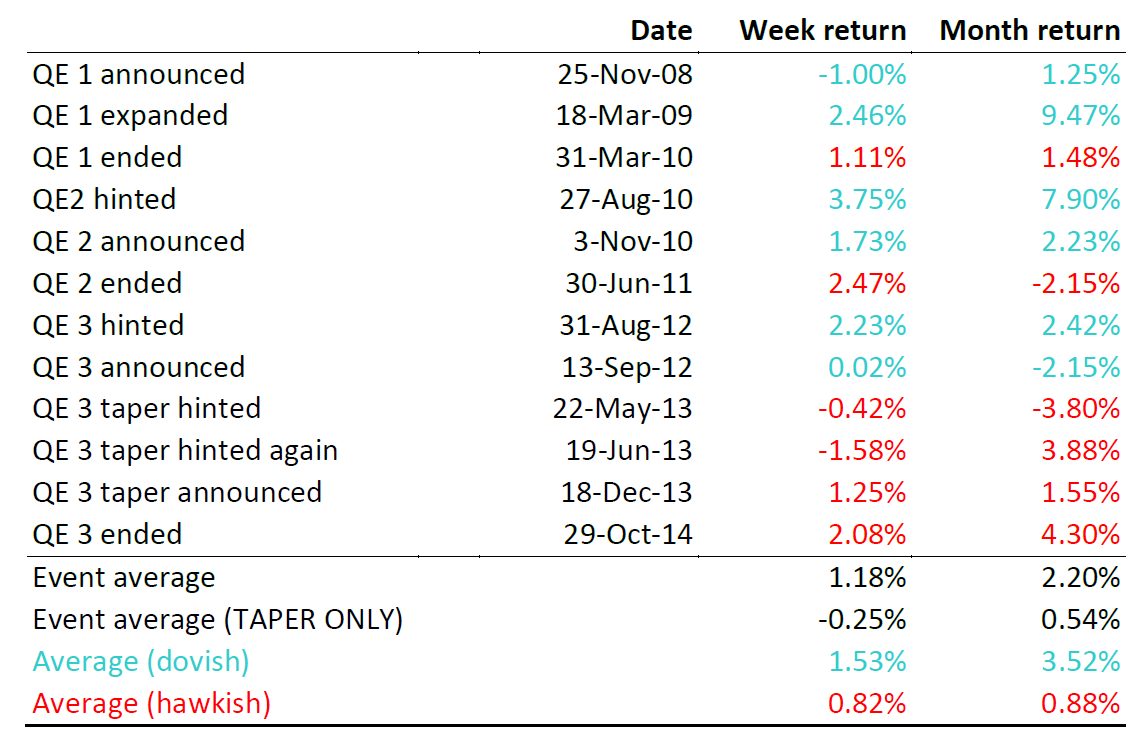
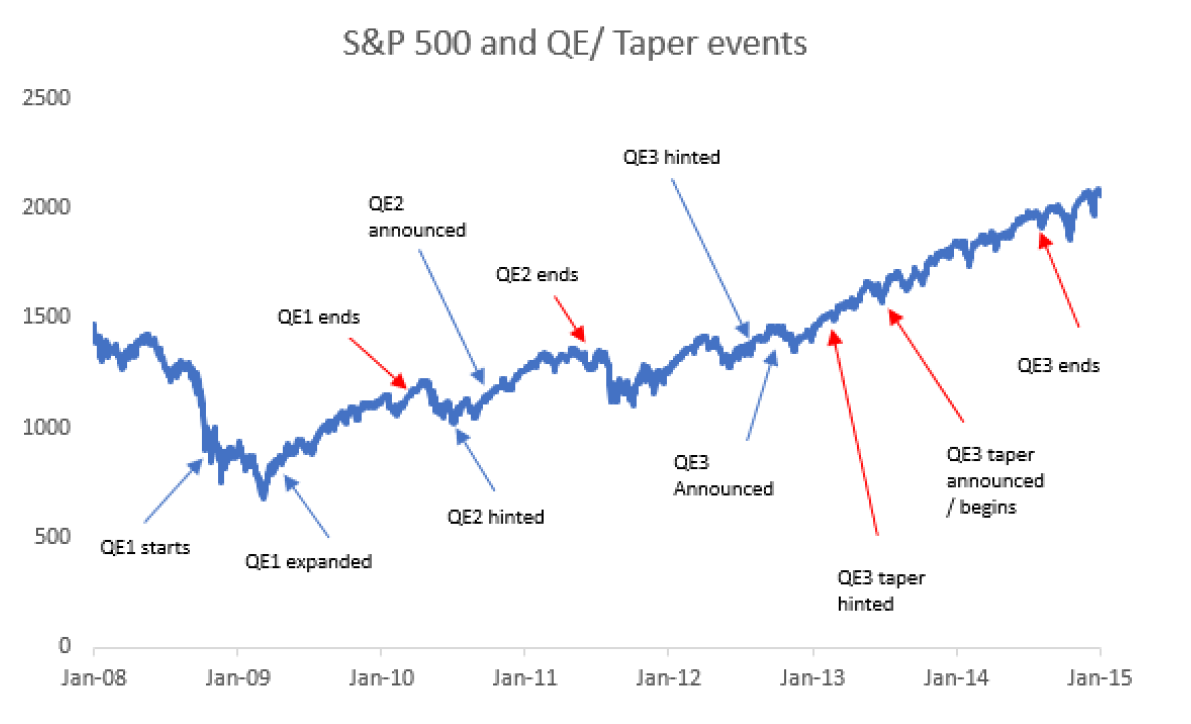
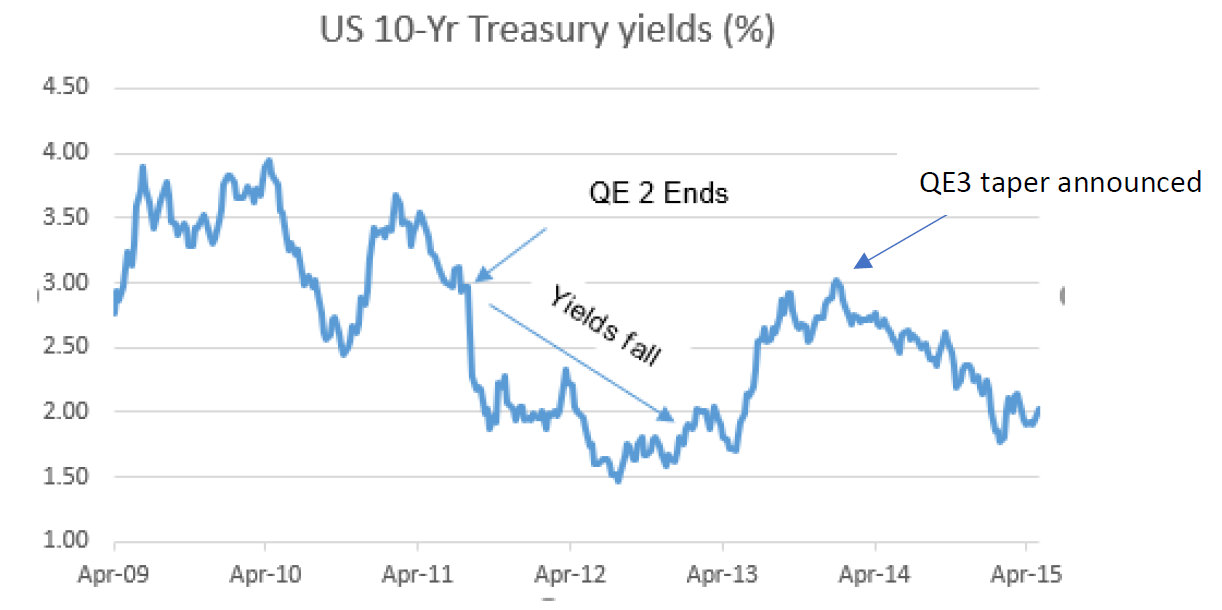
As vaccination rates increase around the world and we (hopefully) return to some normality in our daily lives, world economies appear to be stabilising. Economic output is near or above pre-pandemic levels, and signs of inflation and wage pressure have become a theme of 2021. As a result, many investors and commentators are now keeping a close watch on the US Federal Reserve and any change in current monetary policy: specifically, the quantitative easing program (QE) and the potential that the monthly asset purchases (US$120bn per month) will begin to slow, or 'taper'. Some investors have bad memories from the last time the US Fed tapered, and as such there appears to be some anxiety over the next central bank move. Indeed, in the minutes from last month's meeting, the committee stated, "Most participants noted that, provided the economy were to evolve broadly as they anticipated, they judged that it would be appropriate to start reducing the pace of (asset) purchases this year".[1] Should investors fear the taper? Some historic perspectiveSince the great financial crisis of 2008/2009, there have been three QE programs in the United States: two of which ended abruptly, and the third via taper (a gradual reduction in monthly asset purchases). The following table highlights the dates of each announcement (or signalling) of these policies, and measures the performance of the S&P500 Index in the week and month following these announcements.[2]
Source: Calculated Risk, Bloomberg, Quay Global Investors To assist our analysis, we have colour-coded each 'QE event' depending whether the policy announcement was dovish (supportive of the economy and more QE) in blue, or hawkish (restrictive and less QE) in red. The taper - which was first hinted at in a speech by Ben Bernanke on 22 May 2013 - set a clear path to the end of QE and led to the first post-GFC rate increase in December 2015. The data clearly shows a 'dovish' Federal Reserve tended to be good for stocks over the following week and month (on average up +1.53% and +3.52% respectively). However, it is also clear the end of QE (on average) is not necessarily bad for equities (on average up +0.82% and +0.88%). Most of the taper angst appears to be derived from the May 2013 statement to US congress by then-Chairman Ben Bernanke, when the concept of gradually reducing asset purchases was first suggested.[3] Unlike the end of the first two QE programs, this signalled a change in policy, and introduced 'the taper' for the first time. Yet in the current environment, this moment has already passed as per the September minutes. And based on historic performance, the idea that we should worry about any taper carries very little historic weight. Moreover, for investors not concerned with short-term performance, the best strategy post-GFC was to ignore the taper/QE noise entirely and simply stay invested.
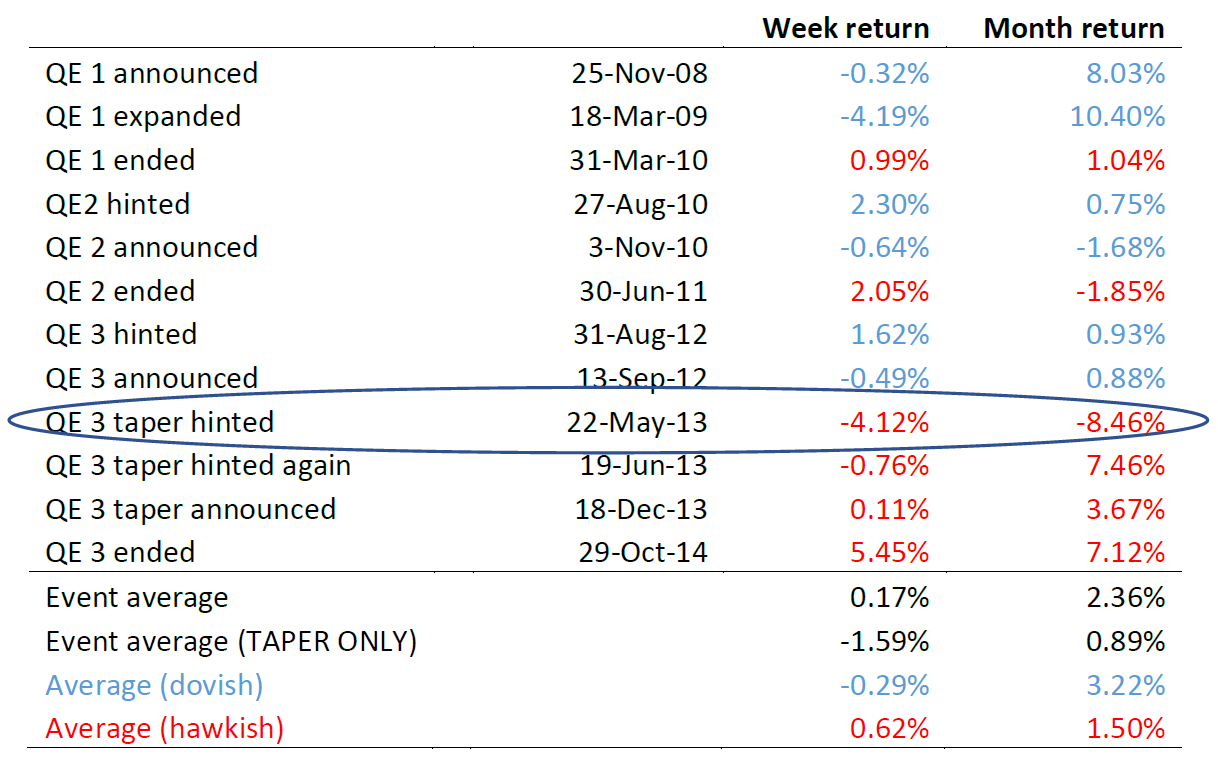
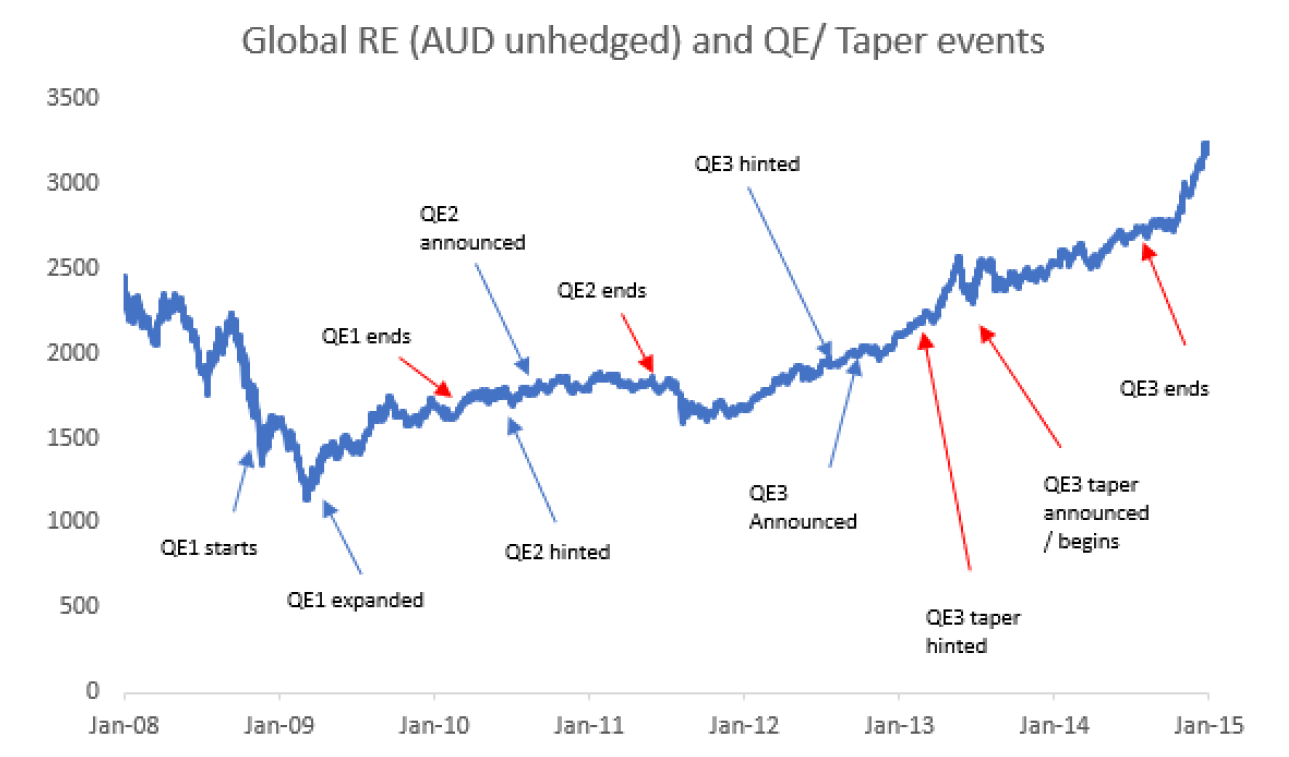
What about real estate?Listed real estate was not immune to the volatility caused by various quantitative easing announcements. However, the data again suggests there is little to fear with respect to any end to the QE program - although admittedly, there was more volatility. It would probably surprise some investors that global real estate did worse over the week after the Fed was dovish (-0.29%), compared with when it was hawkish (+0.62%). And like the S&P500, on average global real estate actually performed well in the month following the various taper announcements (+0.89%), and following hawkish statements (+1.50%) .
Again, as the following chart shows, long-term investors in global real estate that ignored the noise were rewarded over time. We also make the observation that global listed real estate performed best during and after the Fed became consistently hawkish following the initial taper hint in May 2013. This again should remind investors that real estate does best when the economy is good, not when interest rates are low (or central banks are dovish). For more on this, refer to our 2019 article 30 years of investment lessons from Japan.
Source: Bloomberg, Calculated Risk, Quay Global Investors Why QE has less impact on equity markets than most thinkA common narrative post financial crisis was that various central banks (across the world) influenced equity markets directly or indirectly with their various monetary programs - especially quantitative easing. Throwaway lines such as "flooding the market with liquidity" or "artificially reducing interest rates" or "forcing investors into risky asset" played well with the CNBC/Zero hedge crowd, but rarely are these comments scrutinised for the detail. The reality is that central bank influence on equity markets valuations is minimal at best, for the following reasons.
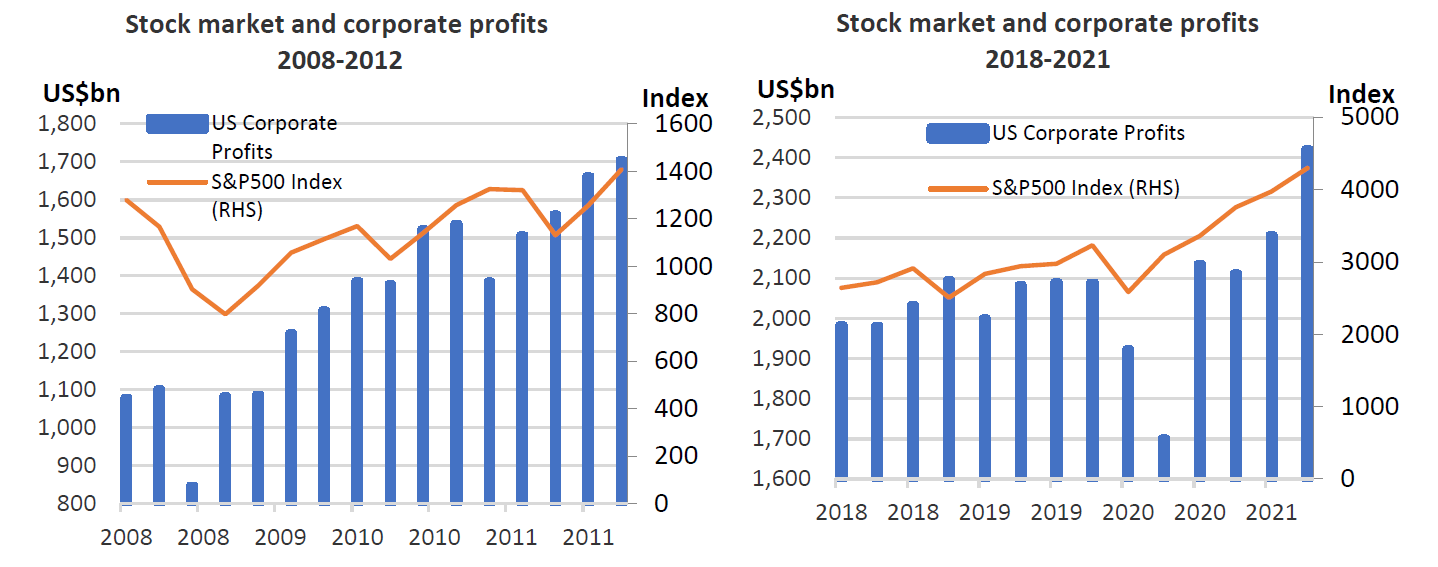
It's all about profitsAs we have stated in previous articles, what drives long-term equity returns are profits. And while some investors blame (or credit) central banks for share market performances, on most occasions equity performance is supported by rising earnings. As we highlighted in our June 2021 article checking in on Kalecki, the macroeconomic source of company profits is more closely aligned to fiscal policy (spending and taxing), not monetary policy.
Concluding thoughtsAt Quay, we are unapologetic in our bottom-up approach. This does not mean we ignore macroeconomic data or various government policy. The key is understanding which macroeconomic issues matter. The US has now enacted various forms of QE over the past 12 years - and not unlike the Japanese experience (now 20 years of QE), the data suggests worrying about central bank policy and actions is not productive for long-term investors. That's not to say equity markets are not overvalued; but if they are, it has more to do with animal spirits than the Fed. Our observation is investors should spend less time worrying about central bank actions that have very little impact on equity markets beyond a placebo effect - and more time remaining invested in high quality companies that grow cashflows sustainably over time. |
|
Funds operated by this manager: Quay Global Real Estate Fund |

26 Oct 2021 - The Winter of Discontent
|
The Winter of Discontent Arminius Capital 12 October 2021 The winter of 1978-1979 was disastrous for the UK economy. A combination of freezing weather, rising inflation, union wage demands, and public and private sector strikes caused fuel shortages, food shortages, and essential services failures. The press christened the period "the winter of discontent", borrowed from the first line of Shakespeare's Richard III. Not surprisingly, Margaret Thatcher won the May 1979 election. The coming winter of discontent will affect much of the northern hemisphere, but particularly the UK and China. The US is all but self-sufficient in energy, although it will continue to suffer supply chain disruptions. The EU has sufficient spare generating capacity and cross-border electricity transmission to mitigate the power problems, and Russia has promised to step up gas supply. India has managed to create its own coal shortage without having a Communist Party or a Conservative Party to make mistakes, but very few global investors have any exposure to the Indian share market. Boris Johnson doesn't have to face a general election until May 2024, but the winter of 2021-2022 is shaping up as a major public relations disaster for his government. Rising oil, gas, and commodity prices are exacerbated by higher transport costs, not to mention labour shortages in essential functions such as truck drivers, butchers, and process workers. Lack of truck drivers has forced the government to use the army to deliver petrol to service stations, and supermarkets are already suffering stock-outs of basic items such as eggs, milk, pasta, and canned fruit. The shortages have been blamed on COVID-19, Brexit, EU bloody-mindedness, UK government incompetence, private sector inadequacies, and global supply disruptions. What is clear is that there are no quick solutions. Xi Jinping is facing the same types of problems in China: power cuts and supply disruptions. The nationalistic (State-owned) media has blamed these on the usual suspects - corrupt officials, foreign saboteurs, counter-revolutionaries, and "bad elements" generally - but in China's case the true causes are well-documented. Demand for Chinese goods surged in 2021 as the global economy recovered. This meant that demand for electricity surged. But more than half of China's electricity comes from coal-fired plants, and since 2016 the central government had been forcing the closure of small coal mines, not in a quest for net zero emissions, but because of the very high levels of local pollution and industrial accidents in these small mines. Alex Turnbull makes a persuasive argument that part of the shortage was caused by the disruptive effects of anti-corruption campaigns in Inner Mongolia - see https://syncretica.substack.com/p/rectification-campaign-to-energy. So China needed more electricity than it had the coal to produce. The obvious next step was to import more coal. Unfortunately, the rest of the world wanted more coal too, so prices had already risen sharply. To complicate matters, in 2019 the central government had unofficially halted thermal coal imports from Australia, and the spare Australian coal had been sold to other countries. By mid-2021 it was clear that many Chinese provinces did not have enough electricity to power their economies. Yunnan, for example, has built an aluminium industry on cheap and abundant power from its hydro stations. But in 2021 low rainfall reduced hydro power supply, so Yunnan was forced not only to shut down alumina smelters, but also to reduce electricity exports to the neighbouring province of Guangdong. What made matters worse is that, because two-thirds of China's provinces had missed their targets for reducing energy consumption and energy intensity, the central government told cities which were home to major polluters to shut down the worst offenders for several hours a day or a few days each week. This means heavy industries such as steel, cement, glass, and paper manufacturers. Another complication: local power prices are set by the government, usually for the benefit of industrial and residential users. When higher coal prices pushed coal-fired power stations into losses, most governments would not agree to any power price rises. In response, generating companies stopped buying expensive coal and temporarily shut down their unprofitable power stations. Xi Jinping and his Politburo are several management levels above the grassroots, and bureaucrats are never keen to bring bad news to their bosses, so the extent of the problems did not become obvious until September. The eventual response shows that - unlike Boris Johnson - Xi Jinping took matters very seriously indeed.
INVESTMENT IMPLICATIONS Whatever happens in the UK will have very little impact on Australian investors. As a trading partner, the UK is slightly more important to us than Thailand. Ever since the Brexit vote in June 2016, the UK share market has traded at a 20% discount to other developed markets, so a lot of bad news is already priced in. By contrast, the power cuts in China are globally important, reinforced with the property market turmoil caused by the Evergrande default. The net effect will be to reduce China's GDP growth rate below 4% annualized over the next six months. Chinese imports of Australian iron ore will fall by 10% over this period, but Chinese imports of Australian thermal coal will rise unobtrusively. The Chinese factory shutdowns will add to the world's supply shortages and keep commodity prices weak until the Chinese economy is visibly back to normal - probably by March 2022. China's power outages will worsen global supply chain disruption, but the key factor which will end the US import shortages is consumers reducing their spending on goods and switching to spending on services. For China's share markets, the impact of the power cuts is negative, but it is far smaller than the damage done to China's tech giants already by the central government's regulatory crackdowns. Because Australia is already on the receiving end of China's unofficial trade war, the downside for us is minimal. Lost iron ore exports are offset by record coal exports. But Australian investors need to watch the Chinese economy, just in case it doesn't recover within six months. If so, there will be more negative consequences for the global economy. Funds operated by this manager: |


