NEWS

14 Jul 2026 - Performance Report: Insync Global Capital Aware Fund
[Current Manager Report if available]

14 Jul 2026 - New Funds on Fundmonitors.com
|
New Funds on FundMonitors.com |
|
Below are some of the funds we've recently added to our database. Follow the links to view each fund's profile, where you'll have access to their offer documents, monthly reports, historical returns, performance analytics, rankings, research, platform availability, and news & insights. |
 |
||||||||||||||||||||||
| VanEck Australian Subordinated Debt ETF (ASX:SUBD) | ||||||||||||||||||||||
|
||||||||||||||||||||||
| View Profile | ||||||||||||||||||||||
|
|
||||||||||||||||||||||
| Value Earth Fund | ||||||||||||||||||||||
|
||||||||||||||||||||||
 |
||||||||||||||||||||||
| Adaptive Alpha Research Starling Fund | ||||||||||||||||||||||
|
||||||||||||||||||||||
| View Profile | ||||||||||||||||||||||
|
Want to see more funds? |
||||||||||||||||||||||
|
Subscribe for full access to these funds and over 1000 others |


13 Jul 2026 - Infrastructure in focus: A hard-wearing HALO in infrastructure

10 Jul 2026 - Hedge Clippings |10 July 2026
|
|
|
|
Hedge Clippings | 10 July 2026 Summary: Housing takes centre stage this week, with fresh ABS approvals data and a rapidly falling price picture landing days apart. Indian Prime Minister Narendra Modi's Melbourne visit delivered a uranium deal which has been stalled for a decade, while offshore the quick military fixes promised in both Iran and Ukraine keep dragging on. National values post their steepest monthly fall since 2022, and HSBC says an 8% correction is just the beginning Source: Cotality Home Value Index, via Mortgage Professional Australia, 7 July 2026 Cotality's Home Value Index fell 0.4% nationally in June, the steepest monthly decline since December 2022, with capital city values down 1.3% over the quarter. Sydney (-1.2% for the month, -3.2% for the quarter) and Melbourne (-1.0%, -2.6%) are leading the fall. Sydney's top quartile ($1.8M plus) has shed roughly $90,000 or 5% in three months, and auction clearance rates have sat below 50% for five consecutive weeks. Domain separately forecasts Sydney down 7% and Melbourne down 8% to June 2027, while Perth, Adelaide and Brisbane keep growing. No doubt there will be further differences on a more granular geographic and suburb basis. Hedge Clippings' own anecdotal evidence from a real estate agent contact operating in Sydney's Elizabeth Bay suggesting achieved prices are already running about 15% below three months ago, with properties taking noticeably longer to sell. HSBC's Paul Bloxham called the tax reform and the RBA's three 2026 hikes a combination that has "rapidly sapped investor demand," pointing to a peak to trough correction of up to 8%. The issue is that property, as most Australian's largest asset impact consumer confidence and the rest of the economy. CBA now expects GDP growth to slow to 1.5% by year end. Economist Belinda Allen notes the oil shock hit was milder than feared, but a deterioration in the housing market is offsetting that relief. Source: ABS Building Approvals, released 3 July 2026. Total approvals: 17,019 (+5.5% YoY) Total dwellings approved fell 1.1% in May to 17,019, per ABS data released 3 July, but the composition tells the real story. ABS head of construction statistics Daniel Rossi attributed the fall entirely to a 10.4% drop in private dwellings excluding houses, which had jumped 4.0% in April. May's Budget's tax changes will not have not fed through to this data yet, since the CGT and negative gearing reforms only bite from mid-2027 and the SMSF LRBA ban from August. This is still largely a rate and confidence story, not a tax reform one. The stakes are asymmetric across tenure types. Nationally 66% of households own their home (35% with a mortgage, 31% outright) and 31% rent, per ABS and AIHW data. In Greater Sydney ownership drops to 59% (32% mortgaged, 27% outright) and renting rises to 35%. For the roughly one third of households still paying off a loan, this cycle delivers a rare double hit: elevated repayments and declining home equity at the same time, a combination that weighs directly on consumer confidence since housing remains most Australians' largest asset. Falling prices help Albo's aspirational first home buyers get a foot on the ladder, but they do not help the roughly 4 million households already on it who are watching equity erode while repayments stay elevated. That asymmetry is the real political and economic tension of this cycle, and no single data release resolves it. A decade long stalemate ends: Australia will sell uranium to India Indian Prime Minister Narendra Modi's third visit to Australia, his first stop after Indonesia on a three-nation tour, produced a nuclear cooperation agreement allowing Australian uranium exports to India for "exclusively peaceful purposes," ending a stalemate that persisted despite a 2014 cooperation pact. Albanese framed it as diversifying Australian trade beyond China, still the nation's top partner. Modi linked it to India's target of 100 gigawatts of nuclear capacity by 2047. The two leaders also agreed to deepen defence, critical minerals and space cooperation, including a tracking terminal on the Cocos Keeling Islands, and Modi pushed for an early conclusion to the proposed Comprehensive Economic Cooperation Agreement. This is a genuine long term positive for the Australian uranium and critical minerals sector, even though the commercial ramp up will take years, not months. However, let's not go into the logic of Australia, with 28% of the world's known uranium resources being happy to export it, but not prepared to use it domestically as a reliable long term power source, unless of course it is on a submarine. Two quick fixes that still are not fixed Trump's promised swift resolution in Iran, lunched on 28th of February, has stretched to four and a half months with no final treaty signed despite June's interim memorandum - but in fact with an renewed increase in hostilities. The parallel in Putin's Ukraine short term military exercise launched in 2022 with expectations of a rapid outcome, has instead run more than four years, with Russian forces now facing genuine attrition pressure. For markets, both situations underscore the same lesson: geopolitical resolutions tend to be announced faster than they are actually delivered, and oil and risk asset pricing should build in that lag rather than front run the headline. Next week: Australia's economic calendar delivers the data that will shape the August RBA call The RBA's next meeting is not until August 10-11 and is shaping as being critical for Australia's mortgage holders, as well as the RBA's own reputation. Prior to that the board will have the benefit of June's CPI number (due 29th July). With household equity under pressure from falling prices and mortgage holders squeezed on both sides, the case for diversified exposure beyond direct residential property remains strong. FundMonitors.com tracks 1,075 managed in Australia, helping advisers and HNW investors identify genuine alternatives as capital looks beyond the family home. News | Insights 4 ASX stocks we like despite the macro uncertainty | Glenmore Asset Management Netflix: Navigating deals, AI and growth | Magellan Investment Partners June 2026 Performance News Bennelong Australian Equities Fund |
|
|
If you'd like to receive Hedge Clippings direct to your inbox each Friday |

10 Jul 2026 - Performance Report: 4D Global Infrastructure Fund (Unhedged)
[Current Manager Report if available]

10 Jul 2026 - Performance Report: ECCM Systematic Trend Fund
[Current Manager Report if available]

10 Jul 2026 - 2026 Midyear Investment Outlook

9 Jul 2026 - Performance Report: Seed Funds Management Financial Income Fund - Incl Franking
[Current Manager Report if available]

9 Jul 2026 - Performance Report: Bennelong Australian Equities Fund
[Current Manager Report if available]

9 Jul 2026 - Equities outlook: Balancing AI's promise and near-term macro risk
|
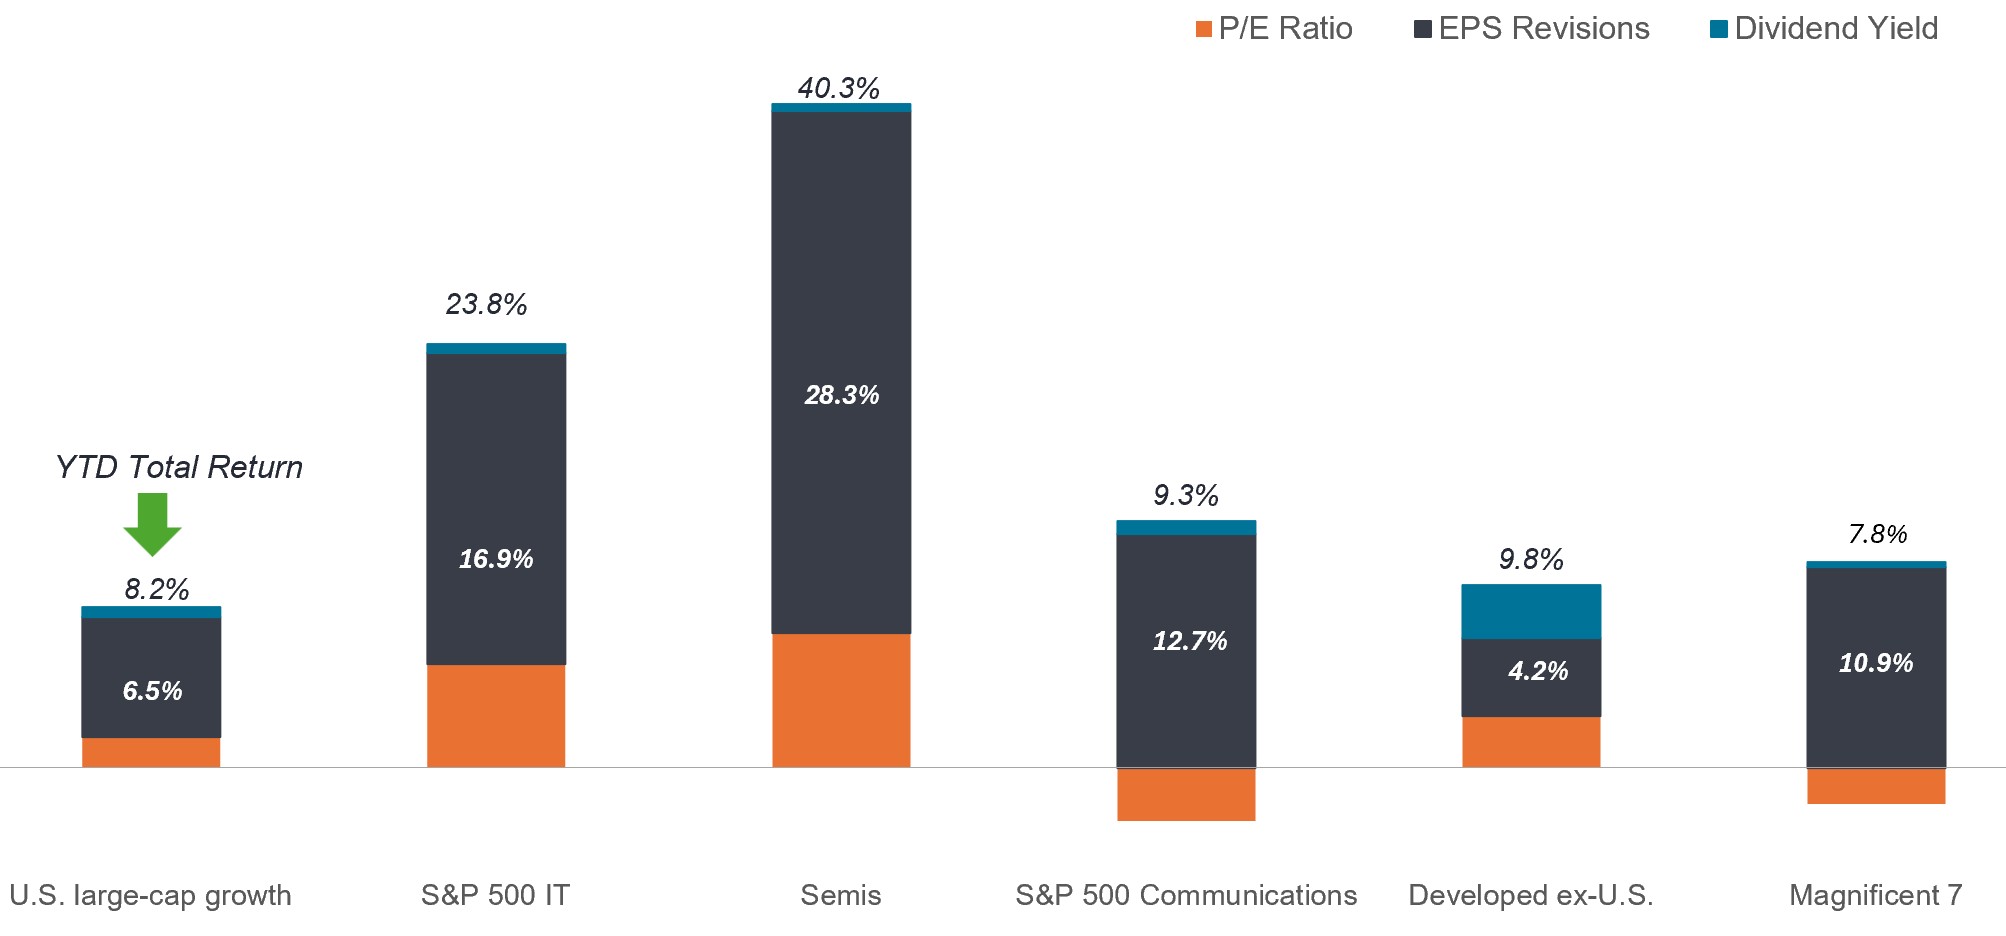
Equities outlook: Balancing AI's promise and near-term macro risk Janus Henderson Investors June 2026 (8-minute read) Head of EMEA and Asia Pacific Equities Lucas Klein and Head of Americas Equities Marc Pinto discuss how uncertainty around the artificial intelligence (AI) buildout and geopolitical conflict may allow investors to capitalize on price dislocations within these and other, underappreciated, themes, creating opportunities for excess return. Two developments have framed global equity markets in 2026: The continuation - and perhaps surprising strengthening - of the AI infrastructure buildout and the outbreak of hostilities in the Middle East. As evidenced by numerous stock indices having reached record highs in the second quarter, the market is largely embracing the former while shrugging at the latter in the hopes that the associated energy price shock will be short lived. Given the degree to which equities are reacting to these unfolding events, one could be forgiven for thinking that there is little point in fighting consensus by seeking differentiated, company-specific views that go against the prevailing narrative. We, however, believe current market and corporate dynamics are more complex than what's reflected in the headlines. It is, after all, in periods of persistent macro risk and seemingly one-way trades that investors can capitalize on price dislocations within underappreciated themes and individual securities, which can often lead to excess return opportunities over the long term. To be sure, market concentration and persistent inflation are factors investors cannot ignore. And our sentiment is more cautious than it was six months ago. But financial markets are the aggregation of thousands of companies and millions of transactions, and they are constantly absorbing new information about the corporate, economic, and geopolitical environment. While uncertainty has risen, in our view, a complicated and rapidly evolving environment creates opportunities for investors to be proactive by positioning portfolios for the future. The AI buildout: From strength to strength In late 2025, two questions hung over the AI theme: Was the scale of the infrastructure buildout too much too soon, and when could hyperscalers expect monetization from their massive investment? Fast forward six months and those many of those concerns have been assuaged. Demand at every stage of the AI value chain exceeds supply. This includes backlogs for the most advanced graphics processing units (GPU) and end users lining up to access hyperscalers' newest models. This latter development is resulting in revenue growth that exceeds most analysts' expectations. The upshot is one of the strongest earnings revisions cycles in decades. Exhibit 1: Equity earnings upgrades In contrast to the last three years, when earnings were revised downward even in the categories below - with the Magnificent 7 being the exception - 2026 earnings estimates have been materially upgraded over the past five months.
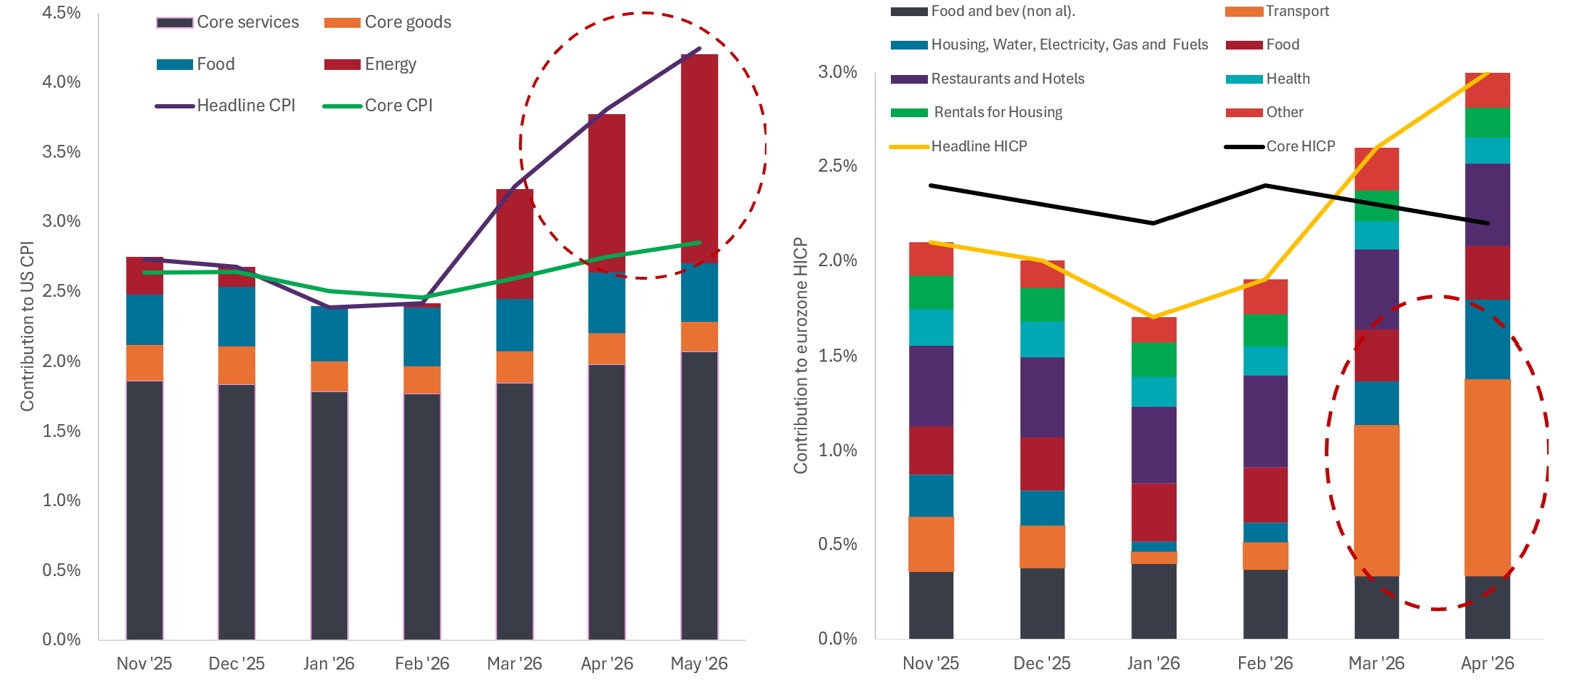
Source: Bloomberg, Janus Henderson Investors, as of 29 May 2026. U.S. large-cap growth represented by the Russell 1000 Growth Index; Semis represented by the S&P 500 Semiconductors Sub-Industry Index; Developed ex-U.S. represented by the MSCI EAFE Index. The expanding capabilities behind the voracious demand for these models is underpinned by a wider-than-expected set of technical inputs. In this year's most telling example, AI inference has been shown to require an underappreciated number of central processing units (CPUs) and memory chips, resulting in significant bottlenecks for these components. This revelation comes on the heels of hyperscalers' race to procure sufficient energy to power their data centers. As AI models become even more sophisticated and further permeate the global economy, we expect additional bottlenecks to emerge. This presents an opportunity for investors to apply deep industry knowledge to identify constraints early and position portfolios accordingly. Another potential AI-related development investors should be mindful of is a repeat of the type of disruption that recently roiled the software industry. As use cases are applied to other industries, we expect additional events like this to occur, as disruption is the tradeoff for reaping the productivity gains promised by AI. But as with the software episode, once the possibility of disruption is recognized, the market often reacts quickly, selling first and asking questions later. This elevator down, stairs up mentality can create opportunities in oversold stocks whose underlying businesses could prove resilient to, if not fortified by, AI. The global economy has been through periods of profound technological change before, although perhaps not at the scale or velocity exhibited by AI. These early days are being led by AI enablers - infrastructure companies and models architects. Investors are anxious to see evidence of productivity gains leading to earnings growth across sectors - via AI enhancers and especially end users - but, at present, any margin expansion would be dwarfed by the AI hyperscalers' historic revenue generation. The long shadow of higher energy prices A tenuous ceasefire and front-month Brent crude futures roughly 20% off their crisis highs have caused many market participants to hope that the economic impact of the Middle East conflict will be short lived in most regions. We believe this will prove too sanguine of an outlook. Even if a lasting cessation of hostilities can be achieved - and that is far from certain - we expect energy prices, and thus global inflation, to remain elevated for much of the rest of the year. The knock-on effects of such an outcome would be far ranging. Foremost, consumption and corporate margins in regions highly dependent on energy imports would suffer. Europe and much of Asia are at the top of that list. And while U.S. consumption remains steady, we are already seeing signs of stress in the value segment. With gasoline prices above $4 per gallon, every dollar going into a tank is one less available for other categories. Even without oil surging past $100 per barrel, the steady headwind of elevated gas prices could weigh on consumers during the important holiday travel and back-to-school seasons. Exhibit 2: Inflation biting in the eurozone and U.S. The duration of energy-driven inflation in the eurozone and U.S. will largely determine how consumers adjust their buying patterns and when - and to what degree - these regions' respective central banks will have to react with policy adjustments.
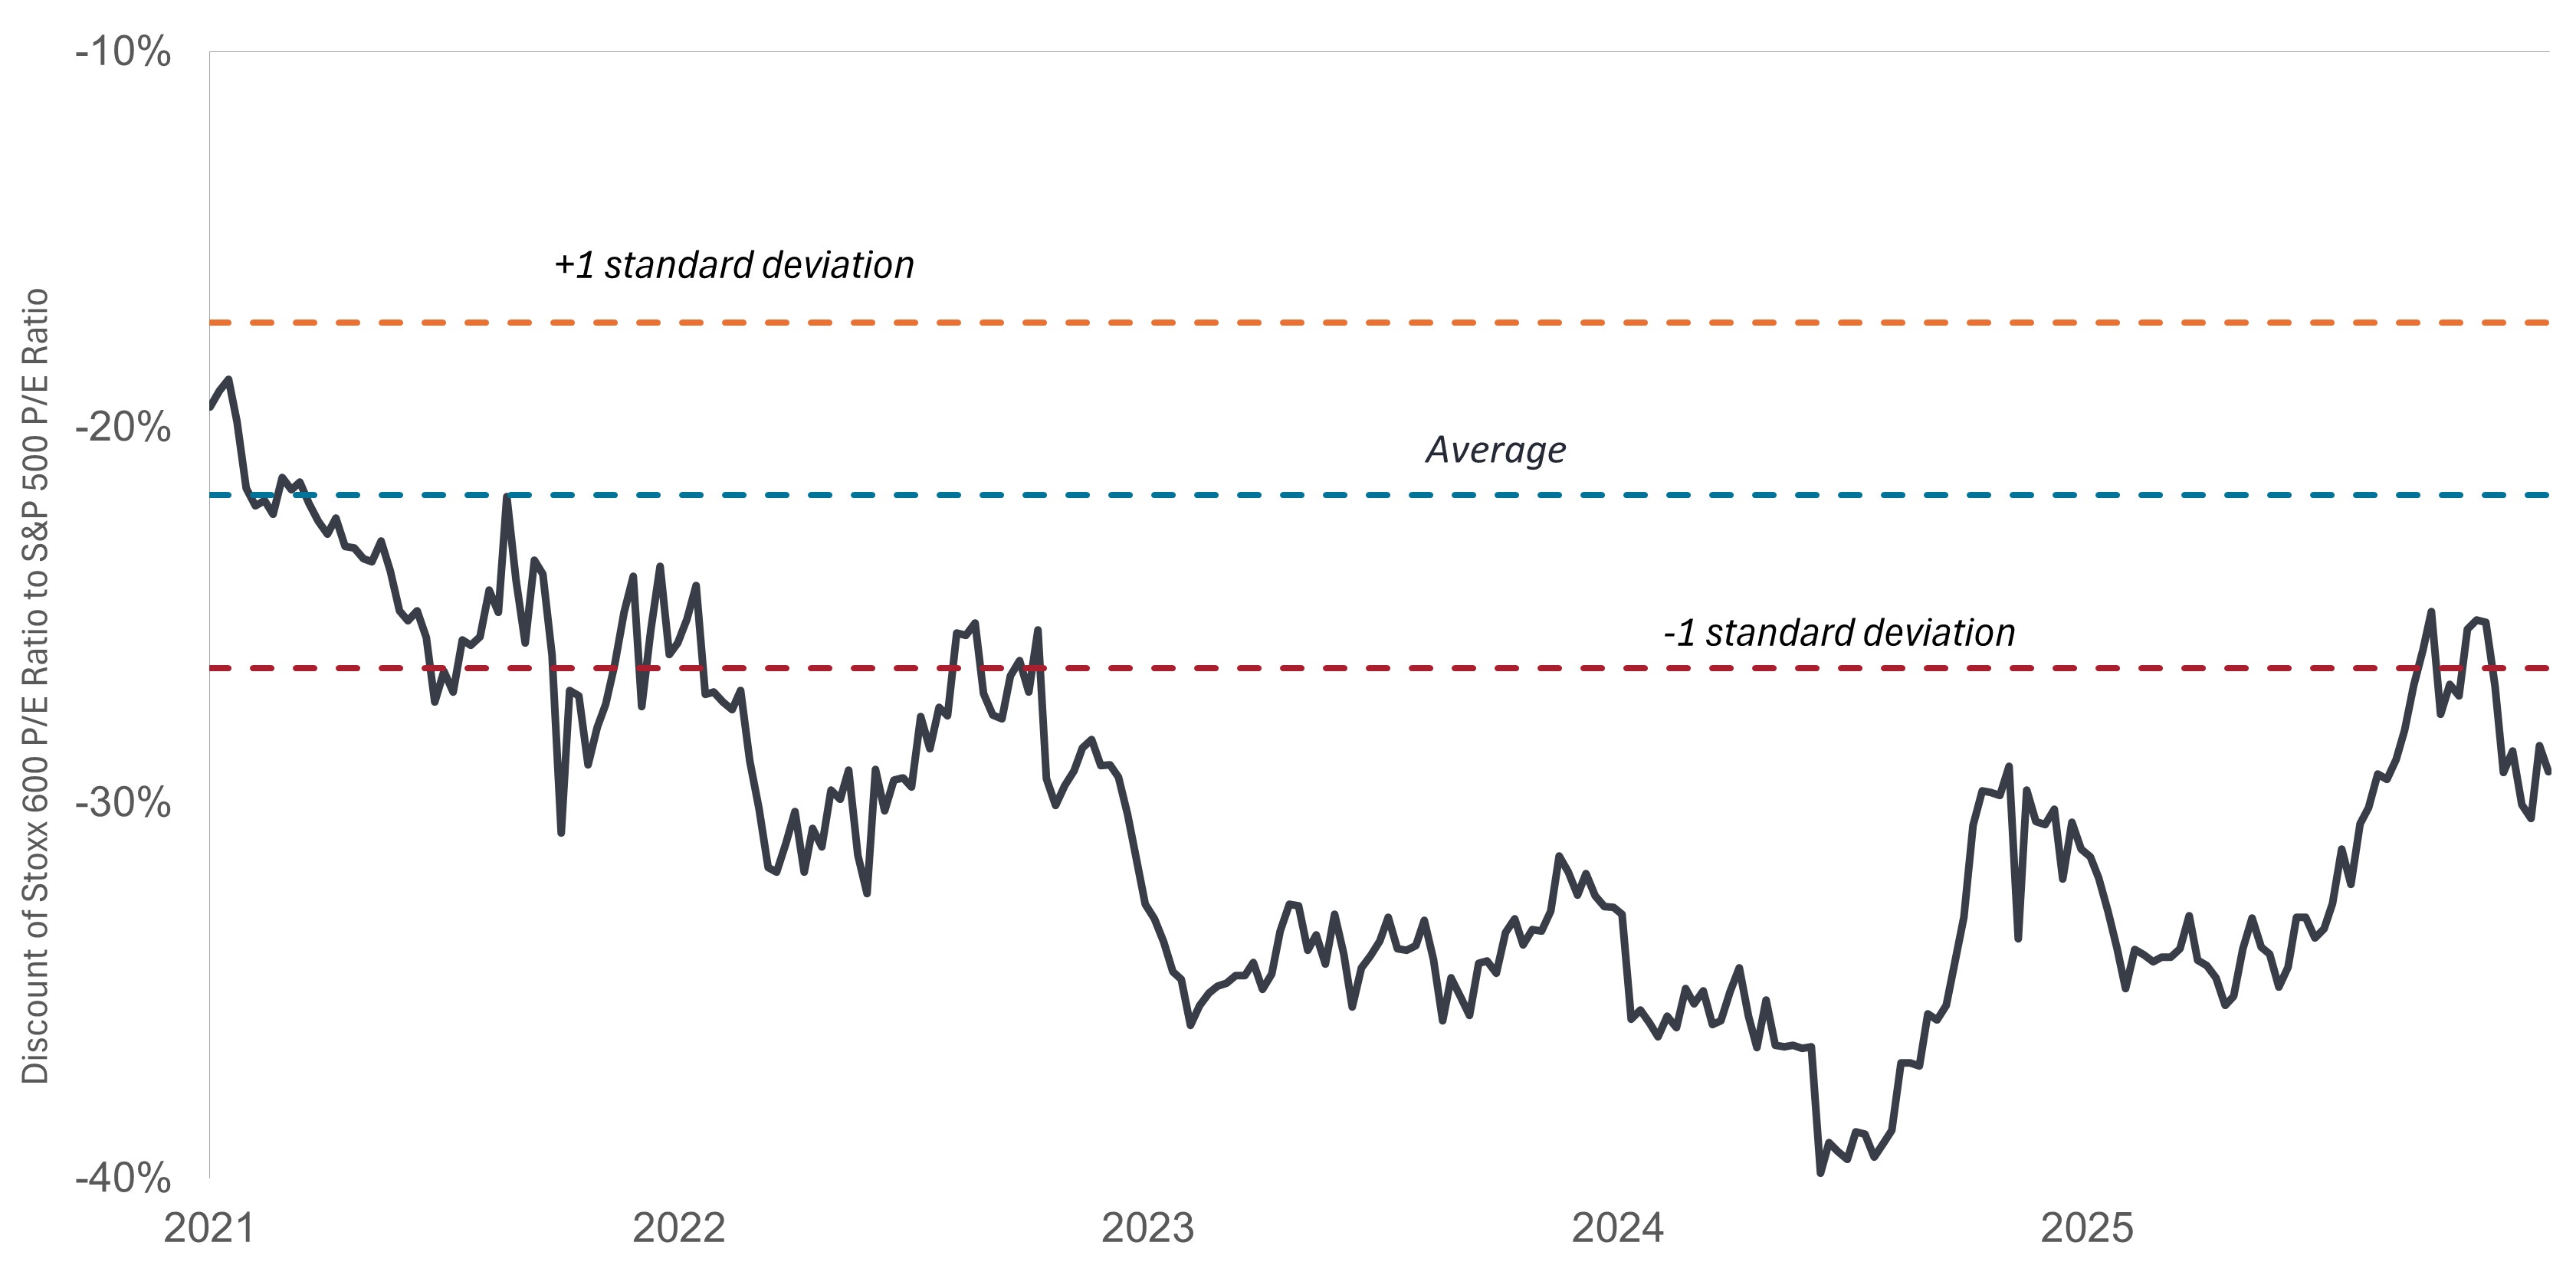
Source: Bloomberg, Janus Henderson Investors, as of 8 June 2026. The duration of high energy prices is likely to be the swing factor in the future trajectory of monetary policy. Entering the year, most major central banks were on track to cut rates to support a late-cycle economy. Now, market-implied estimates indicate the Bank of England and European Central Bank could raise rates up to two and three times, respectively, by the end of the year. And given their inflation mandate, they would have to do this despite already flagging economic prospects. While the U.S. may not be compelled to raise rates as quickly (if at all), its economy is unlikely to receive the hoped-for tailwind of lower interest rates. Not only would this diminish households' ability to benefit from lower borrowing costs, but it also undermines our earlier expectation for an equity market broadening, partly premised on typically leveraged small caps enjoying more favorable financing terms. Europe: One step forward, two steps... Higher interest rates will continue to be a headwind for the eurozone. Another comes in the form of economic reforms progressing more slowly than anticipated. The holdup is found in the banking and regulatory reforms aimed at making the European marketplace more competitive. In contrast, by necessity, the defense component of the banks and tanks initiative continues to move forward. Major European countries, chiefly Germany, recognize the need to fortify their defense capabilities, including domestic arms production, and are willing to run deficits to fund them. The Trump administration's continued ambiguity toward the North Atlantic Treaty Organization likely makes European defense an enduring theme, regardless of how the Ukraine conflict turns out. Much of our earlier favorable view on European markets was based on the potential for pro-business reforms. But another factor was the considerable discount at which European stocks have traded to their American counterparts for the past several years. That discount has narrowed considerably over the past 18 months, diminishing the argument that value alone was a reason to consider European exposure. Exhibit 3: European equities discount to U.S. stocks With Europe's valuation discount to the U.S. narrowing, the next boost for the continent's stocks will have to come from substantive pro-business reforms rather than arguing that equities are cheap.
Source: Bloomberg, Janus Henderson Investors, as of 29 May 2026. When looking at European economic conditions in isolation - including lower exposure to the AI theme - one can conclude that the region's stocks trade at a discount to the U.S. for a reason. That, however, ignores the fact that a large portion of European earnings are derived from either exports or European multinationals' global operations. In this respect, European exposure continues to represent a viable method to access attractive investment themes and global earnings streams. China finding its footing? After an extended period of tepid stock performance and worrisome economic developments, China has shown signs of progress. Part of the reason is the central government inching away from its emphasis on national service at the expense of a company's economic priorities. Beijing is again recognizing that a less encumbered private sector acting in its own commercial interest can improve a nation's economic position and social outcomes. This is most evident in innovation-centric fields like AI, biotechnology, and electric vehicles (EV). The country still must work though the vestiges of its housing overhang, and the government's typical reflex in these instances is to lean into exports. This is, in fact, part of China's current strategy in the wake of U.S. tariffs. To compensate for duties, exports have increased to other emerging markets, where some components invariably find their way to the U.S., but under more favorable terms. A star of corporate China continues to be its commanding position in EVs and batteries, both of which have gained footholds in markets across the world. Balancing the secular and the cyclical A market repeatedly eclipsing record highs on the back of a handful of AI-related companies is no reason in itself to be circumspect about stocks' prospects. This year's gains are, after all, rooted in solid fundamentals, namely materially higher earnings revisions. Still, equities' swagger belies some uncertainty. What sector will AI disrupt next, and how will corporate managers - and investors - react? Although there have been larger episodes in the past, how will the market absorb the initial public offering pipeline, including those of major AI platforms? Lingering inflation and potentially more restrictive monetary policy are legitimate headwinds. Granted, the U.S. stock market does not look entirely like the U.S. economy - with consumption being a much larger share of the latter - but stress from higher energy prices could eventually impact the purchasing decisions of higher-income households. High-end consumption remains strong, but in perhaps a nod to any workplace dislocations AI may cause, will that be enough to carry the broader U.S. economy? These are issues policymakers and investors must monitor as AI becomes more prevalent. There are invariably winners and losers in periods of rapid technological transition. Even within tech, there will be both. The analytical potential of AI could create even more winners in biotech innovation as models tackle the complexities of medical sciences. Over the remainder of 2026, the market will have to balance two opposing forces. On one side, the possible cyclical headwinds of a prolonged military conflict, inflation, and higher interest rates may very well weigh on near-term economic growth. On the other, the secular theme of AI could live up to its promise of being a force multiplier for global productivity. Neither of these trends is on a set path, and each will likely deliver unexpected developments, and thus bouts of volatility, along the way. IMPORTANT INFORMATION Aerospace and defense industries can be significantly affected by changes in the economy, fuel prices, labor relations, and government regulation and spending. Artificial intelligence ("AI") focused companies, including those that develop or utilize AI technologies, may face rapid product obsolescence, intense competition, and increased regulatory scrutiny. These companies often rely heavily on intellectual property, invest significantly in research and development, and depend on maintaining and growing consumer demand. Their securities may be more volatile than those of companies offering more established technologies and may be affected by risks tied to the use of AI in business operations, including legal liability or reputational harm. Equity securities are subject to risks including market risk. Returns will fluctuate in response to issuer, political and economic developments. Foreign securities are subject to additional risks including currency fluctuations, political and economic uncertainty, increased volatility, lower liquidity and differing financial and information reporting standards, all of which are magnified in emerging markets. Technology industries can be significantly affected by obsolescence of existing technology, short product cycles, falling prices and profits, competition from new market entrants, and general economic conditions. A concentrated investment in a single industry could be more volatile than the performance of less concentrated investments and the market as a whole. Consumer Price Index (CPI) is an unmanaged index representing the rate of inflation of the U.S. consumer prices as determined by the U.S. Department of Labor Statistics. Dividend Yield is the weighted average dividend yield of the securities in the portfolio (including cash). The number is not intended to demonstrate income earned or distributions made by the portfolio. Inflation: The rate at which the prices of goods and services are rising in an economy. The Consumer Price Index (CPI) and Retail Price Index (RPI) are two common measures. The Magnificent 7 stocks include Alphabet, Amazon, Apple, Tesla, Meta Platforms, Microsoft, and NVIDIA. Monetary Policy refers to the policies of a central bank, aimed at influencing the level of inflation and growth in an economy. It includes controlling interest rates and the supply of money. MSCI EAFE® (Europe, Australasia, Far East) Index reflects the equity market performance of developed markets, excluding the U.S. and Canada. Price-to-Earnings (P/E) Ratio measures share price compared to earnings per share for a stock or stocks in a portfolio. Russell 1000® Growth Index reflects the performance of U.S. large-cap equities with higher price-to-book ratios and higher forecasted growth values. S&P 500® Index reflects U.S. large-cap equity performance and represents broad U.S. equity market performance. S&P 500 Semiconductors Sub-Industry Index® tracks the performance of the semiconductor and semiconductor equipment manufacturers listed on the S&P 500. STOXX® Europe 600 Index represents large, mid and small capitalization companies across 17 countries in the European region. Volatility is the rate and extent at which the price of a portfolio, security or index, moves up and down. If the price swings up and down with large movements, it has high volatility. If the price moves more slowly and to a lesser extent, it has lower volatility. The higher the volatility the higher the risk of the investment. |
|
Funds operated by this manager: Janus Henderson Australian Fixed Interest Fund , Janus Henderson Conservative Fixed Interest Fund , Janus Henderson Diversified Credit Fund , Janus Henderson Global Natural Resources Fund , Janus Henderson Tactical Income Fund , Janus Henderson Australian Fixed Interest Fund - Institutional , Janus Henderson Conservative Fixed Interest Fund - Institutional , Janus Henderson Cash Fund - Institutional , Janus Henderson Global Multi-Strategy Fund , Janus Henderson Global Sustainable Equity Fund , Janus Henderson Sustainable Credit Fund All opinions and estimates in this information are subject to change without notice and are the views of the author at the time of publication. Janus Henderson is not under any obligation to update this information to the extent that it is or becomes out of date or incorrect. The information herein shall not in any way constitute advice or an invitation to invest. It is solely for information purposes and subject to change without notice. This information does not purport to be a comprehensive statement or description of any markets or securities referred to within. Any references to individual securities do not constitute a securities recommendation. Past performance is not indicative of future performance. The value of an investment and the income from it can fall as well as rise and you may not get back the amount originally invested. Whilst Janus Henderson believe that the information is correct at the date of publication, no warranty or representation is given to this effect and no responsibility can be accepted by Janus Henderson to any end users for any action taken on the basis of this information. |