
News

18 Mar 2022 - Why epoch-defining AI is today's most important investment theme
|
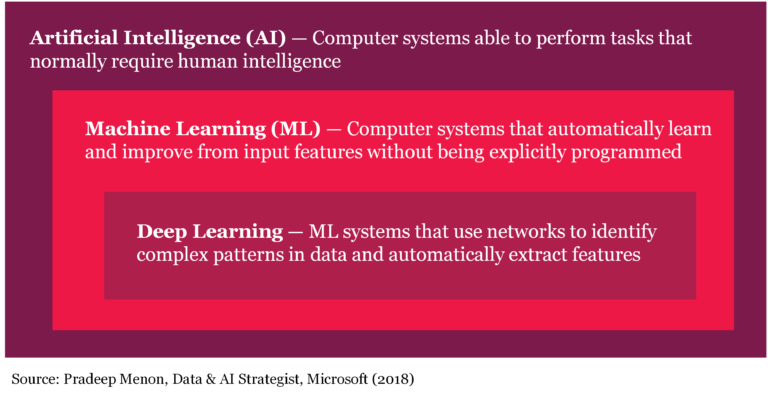
Why epoch-defining AI is today's most important investment theme (and the safest way to profit) Summary of Whitepaper Montaka Global Investments March 2022 Most investors are aware that artificial intelligence, or AI, is an important transformation. But many still underestimate the sheer world and life-changing power of this revolution and its investment potential. AI will recast and refashion every aspect of life: how we consume, how we work, how we monitor industrial machines, how we deliver healthcare, how wars are won, and how we solve climate change. Not only is software eating the world, but it is becoming a lot smarter at an accelerating rate and will continue to do so. Why? Because of AI - and more specifically, machine learning (ML), the most common and practically applicable subset of AI today.
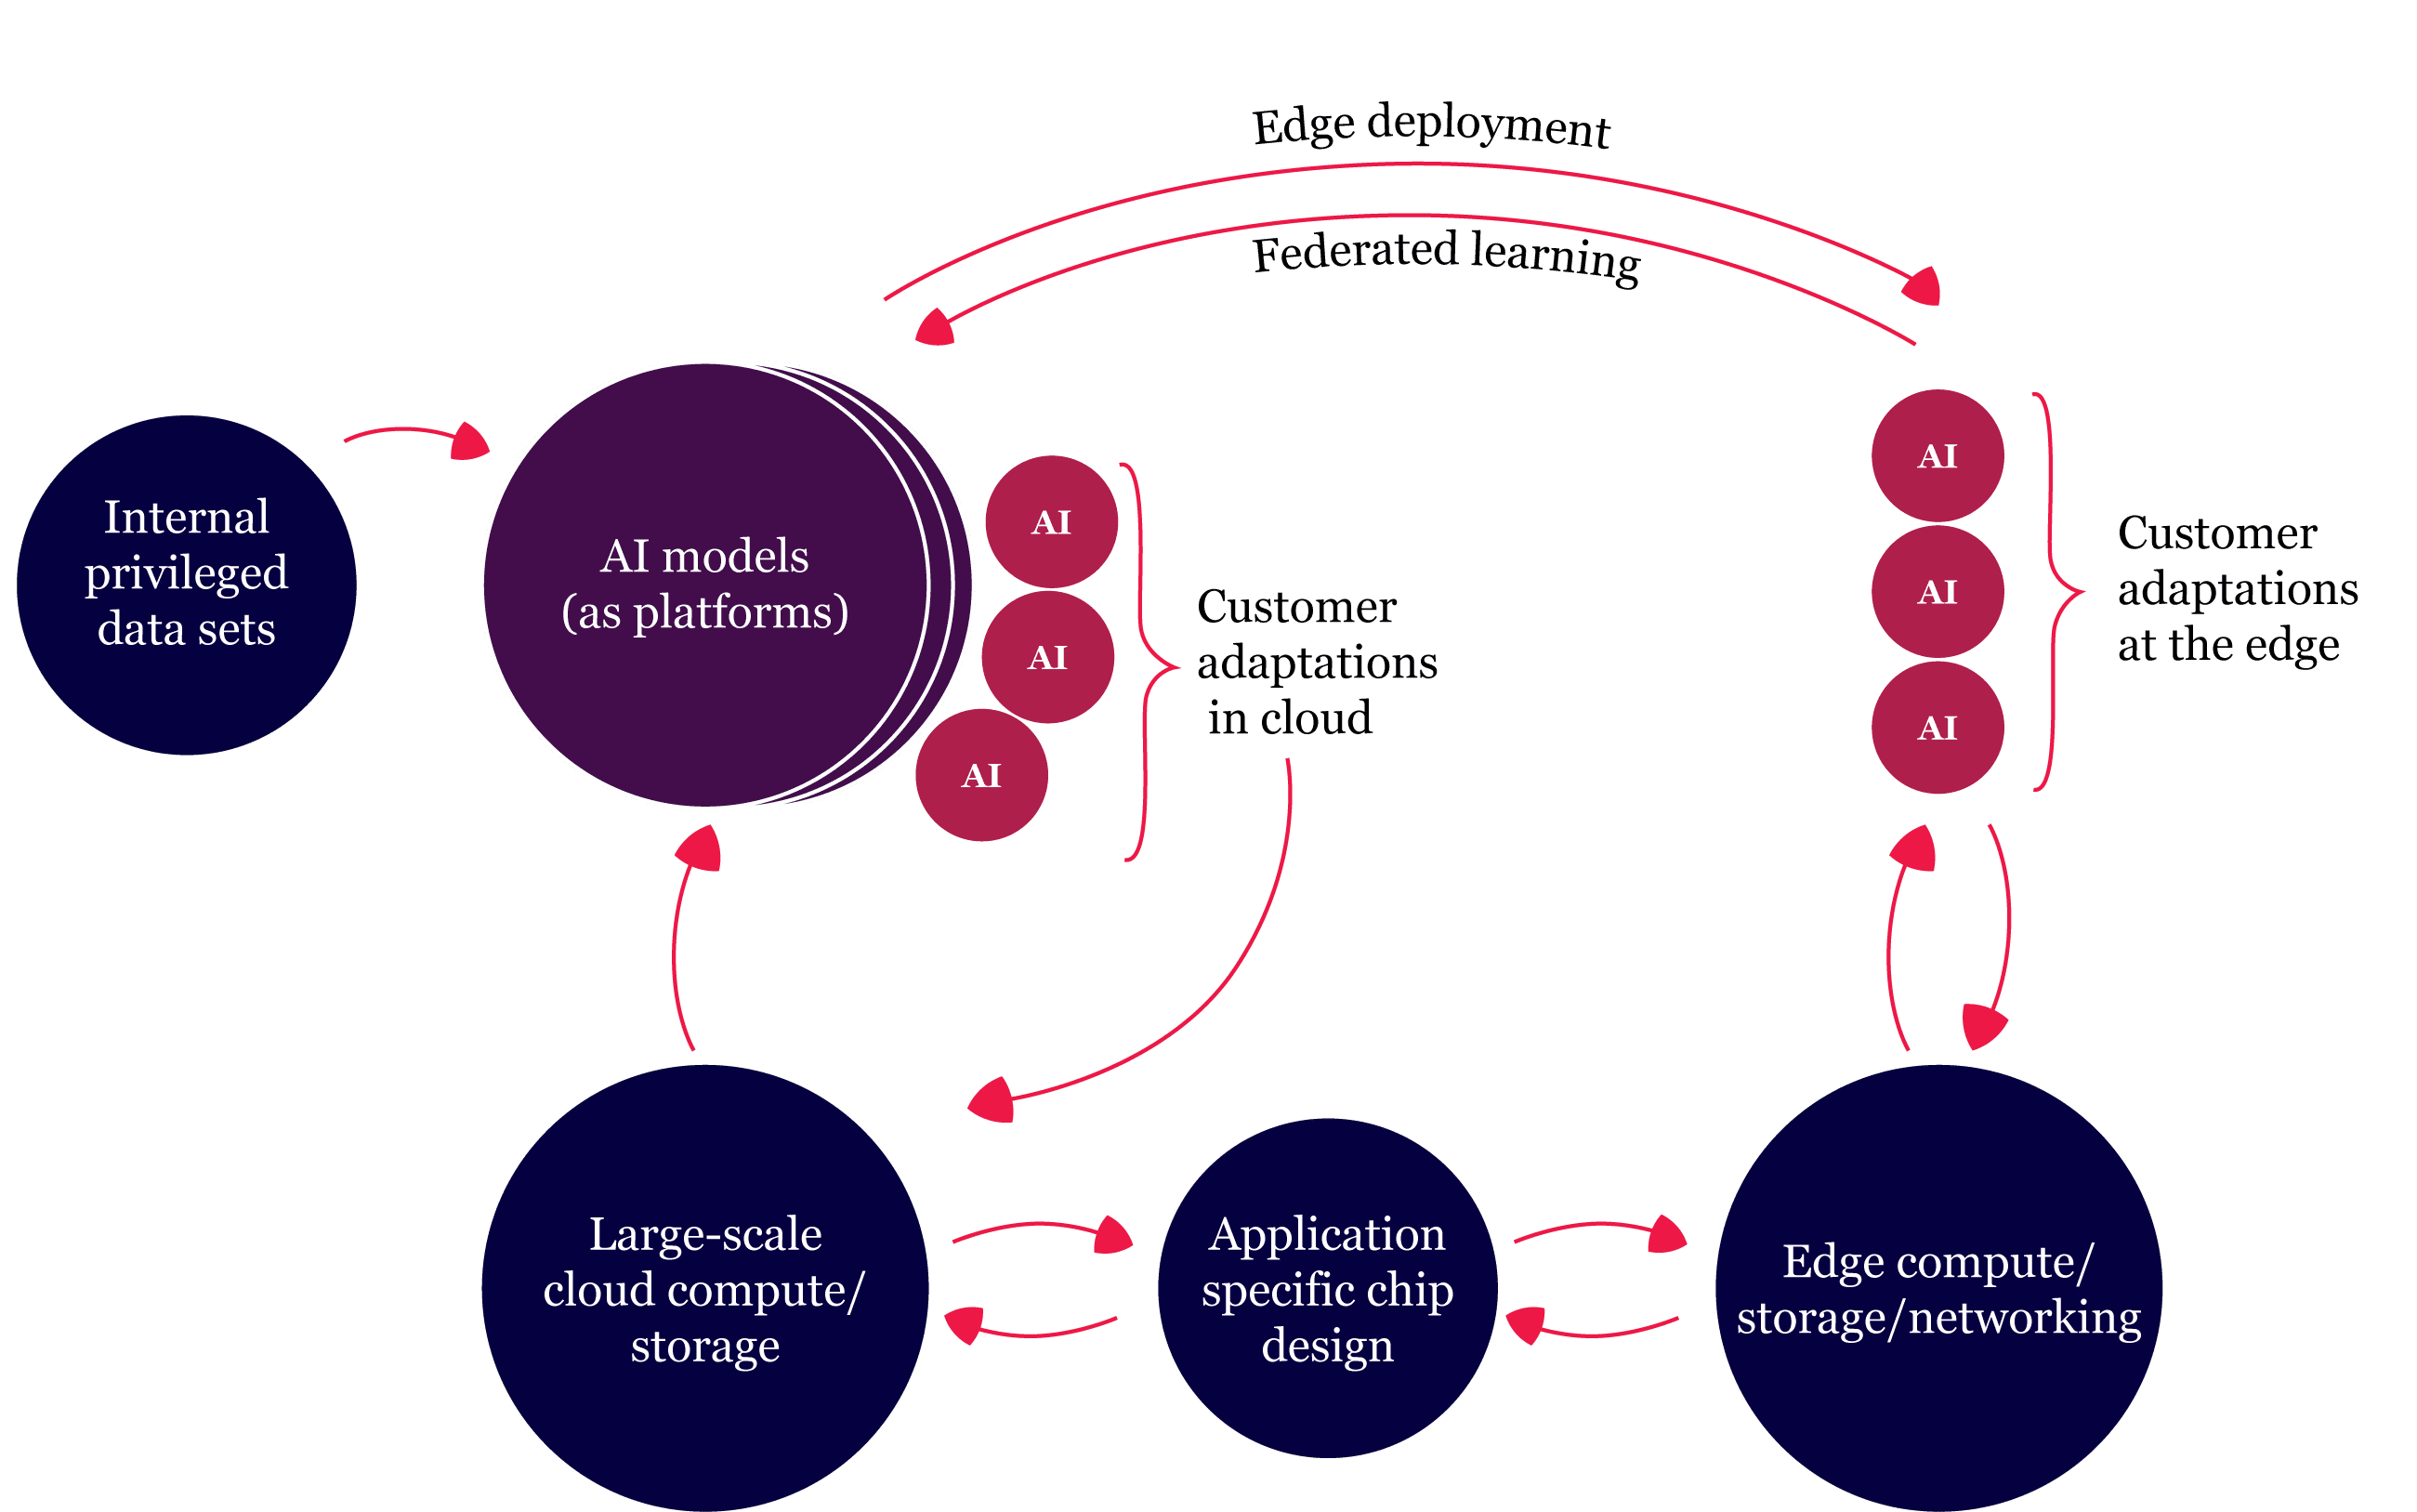
There are myriad ways investors can profit from this AI transformation, but Montaka believes the world's leading cloud computing providers, or 'hyperscalers', particularly Amazon, Microsoft and Alphabet (owner of Google) are one of the safest and surest ways to win. Many investors perceive these mega-tech businesses as 'well-understood', 'mature' and sometimes even 'boring'. We disagree. We believe AI will spark a new phase of hypergrowth for these companies that will take investors by surprise and trigger a big re-rating of their shares. The hyperscalers are uniquely positioned to create an 'AI fly-wheel'
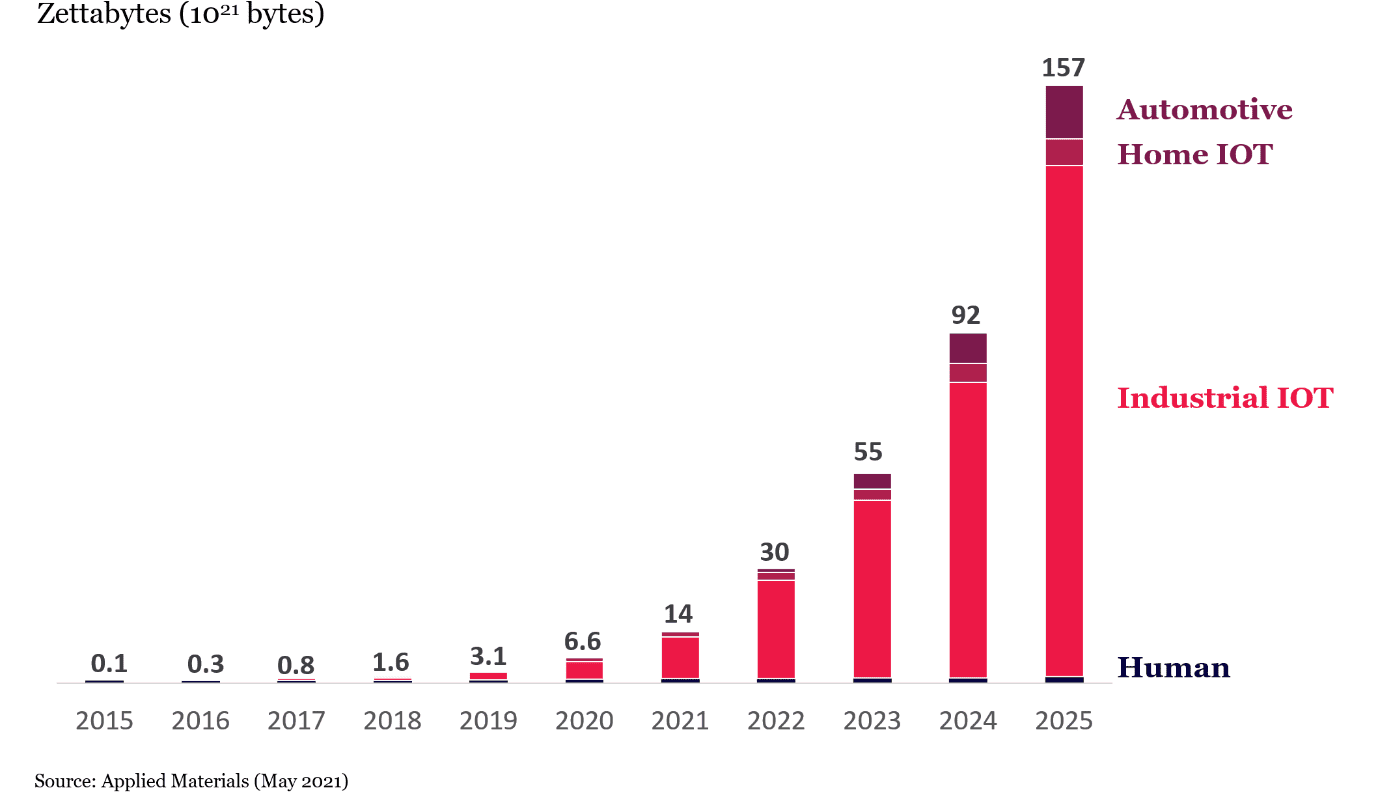
The world's hyperscalers are investing heavily in low code/no code interfaces (including, for example, drag and drop interfaces and natural-language-to-code translators) to democratise the development of AI-based enterprise applications so they are used by more and more employees of the cloud providers' customers. The second driver of massive demand for compute and storage services delivered by hyperscalers is that AI is increasingly being incorporated into every software application in every device. This includes IoT for which we are about to see an explosion in smart devices, deployed at the 'edge', built to be used across all aspects of life. Data Generation - By category
3. ML drives surging demand for compute and storage The effect of incorporating ML into applications is a significant increase in compute and storage intensity, which will benefit hyperscalers. The more successful an AI application is at continually extracting additional relevant data to virtuously improve the accuracy of the embedded ML models, the vastly more compute and storage that is required. 4. Hyperscalers set to dominate 'ASICs' - the new wave of chips powering AI Another reason that hyperscalers are positioned to win from AI is that they are at the cutting edge of developing new chips - Application Specific Integrated Circuits (ASICs) - that will dominate in coming years. Successful innovation on chip energy efficiency is an imperative for the long-term proliferation of AI. Given the enormous economic incentives at play, there is a high probability the hyperscalers will lead this innovation. Not only will this have a positive direct impact on the world's physical environment, but the enabling of increasingly powerful AI will likely, itself, resolve many of the challenges the world needs to overcome to mitigate climate change risks. 6. Hyperscalers will benefit from growing barriers-to-entry that makes them long-term winners from AI Today's hyperscalers have a significant lead over competitors and it is highly likely this lead will only extend over time. The 'barriers to entry' in the space are already very high - and rapidly growing higher, all but eliminating the realistic prospects of a major new competitor materialising.
Montaka believes AI will drive much, much more demand for compute and storage - both in the cloud and at the edge - than many are expecting today. Furthermore, this growth is largely assured, the long-term winners are already known today with a high degree of certainty, and we believe the current stock prices of these businesses are failing to adequately reflect what Montaka's sees on the horizon. It appears highly plausible that hyperscaler revenue expectations are far too low in the context of the scale of the AI-based opportunity that lies ahead. If so, then Amazon, Microsoft and Alphabet - as well as Alibaba and Tencent - will likely surprise investors substantially to the upside over the coming years. Investors should also remember that the enormous R&D being incurred by the hyperscalers, while expensed fully each period to satisfy accounting rules, represents an economic investment in future earnings power. Through this lens, hyperscaler earnings power today is 'artificially' understated - and valuation multiples, therefore, overstated. Funds operated by this manager: Montaka Global Fund, Montaka Global Long Only Fund DISCLAIMER |

17 Mar 2022 - Australian Equities - At The Crossroads?
|
Australian Equities - At The Crossroads? Airlie Funds Management 08 March 2022 |
|
After varying lengths of ever-lower interest rates, RBA asset-buying and benign inflation - all three are reversing course, resulting in increasingly volatile equity markets in 2022. Airlie Portfolio Manager, Matt Williams and Equities Analyst, Will Granger explore what this means for Australian equities. The pair analyse the latest February earnings season and provide insight into the Airlie Australian Share Fund (AASF) portfolio. Timestamps: Funds operated by this manager: Airlie Australian Share Fund |

17 Mar 2022 - Geopolitical volatility and stagflation fears

16 Mar 2022 - 3 stocks to benefit from energy increases
|
3 stocks to benefit from energy increases Datt Capital 03 March 2022 Russia's invasion of Ukraine and the subsequent sanctions against it enforced by the Western world have enormously affected energy and broader commodity markets. The important Asian LNG benchmark, the JKM index, is currently trading ~US$35/MMBtu; significantly higher than in recent months. Whitehaven Coal (ASX:WHC) Written By Emanuel Datt Funds operated by this manager: |
|
Disclaimer: This article does not take into account your investment objectives, particular needs or financial situation; and should not be construed as advice in any way. The author holds no exposure to the stock discussed |

15 Mar 2022 - Investing in infrastructure: what's changed and where are the opportunities?
|
Investing in infrastructure: what's changed and where are the opportunities? Magellan Asset Management February 2022 The last two years has seen international travel upended, domestic transport challenged, 'essential services' redefined and a growing interest in the role infrastructure can play in decarbonisation. With this backdrop, does the case for investing in global listed infrastructure still stack up? |
|
Funds operated by this manager: Magellan Global Fund (Hedged), Magellan Global Fund (Open Class Units) ASX:MGOC, Magellan High Conviction Fund, Magellan Infrastructure Fund, Magellan Infrastructure Fund (Unhedged), MFG Core Infrastructure Fund |

15 Mar 2022 - Inflation is here. Set quality to max.
|
Inflation is here. Set quality to max. Loftus Peak March 2022 It was a bad month for markets all around, as the US Federal Reserve finally leaned into its job - getting inflation out of the system. Its mechanism for doing this is to raise rates to curtail demand. This impacts share markets in two key ways. First, relatively higher interest rates will be less stimulative for economic growth, which feeds its way through to corporate profits and therefore valuations. Second, higher interest rates mean higher costs of capital to business (debt and equity). All else equal, higher costs of capital will reduce the present value of a company's cashflows and therefore its share price. And the further out (in time) those cashflows are, the more they are discounted, meaning that share prices of companies which are not profitable now are very badly hit. The chart below shows -23.8% underperformance of the Russell 2000 against the S&P500 over the past year. Just over half of that underperformance was notched in the past three months. The Russell 2000 is an index of small to mid cap US companies which generally carry less financial strength - and so may be of less quality - than the larger companies that dominate the S&P500.
Source: Bloomberg This is a big divergence in outcomes for higher quality companies compared with lower quality companies, but it's even worse than that for some funds and many companies, some of which are down -50% or more. Economic growth is only part of the storyIt is more than likely that rising interest rates will temper some of the stellar growth we are seeing in companies - this is of course incrementally negative for share markets. However economic growth is not the only ingredient for success in the companies that Loftus Peak holds. We believe a larger part of the success of our holdings is driven by secular trends resulting from changing business and consumer behaviour towards better, more efficient tools and solutions. So higher interest rates might change the pace, but not the destination. It is even conceivable that some of these trends accelerate and become more ingrained during a period of depressed growth as companies look to boost profitability by cutting costs, including by automation, moving to the cloud and cutting ineffective legacy advertising. Quality takes centre stage - profitability, cashflows, balance sheetsWe never shy away from highlighting the quality of the portfolio. Irrespective of macroeconomic conditions, this has always been an integral part of the portfolio construction process, and was a decision informed by the numerous corrections and crashes the investment team has witnessed over their lifetimes. Loftus Peak invests in disruptive companies; businesses driven by secular trends and structural change. The portfolio is therefore heavily tilted towards companies with differentiated, non-commoditised products and services, resulting in business models with relatively higher margins and better profitability. In an inflationary environment, which it appears we are heading into, greater differentiation and higher margins means the ability to pass on or even absorb increased input costs. The same cannot be said for many traditional businesses that are capital intensive and run on razor-thin margins. A key component of a quality company is one that is generating positive cash flows and has additional cash on the books for good measure. Why is this important? As monetary policy tightens and interest rates go up, economic growth will temper at the same time the cost of capital begins to increase. This can be a lethal combination for companies that haven't yet established their business models or a path to profitability, because plugging the hole with debt and equity raisings is going to become much more difficult (and costly). It is for this exact reason that a majority of Loftus Peak's holdings are in quality companies - those with established business models, strong balance sheets and cashflows, with a much lower allocation to 'riskier' companies. This has always been the case, but in more recent months we have increased the tilt to quality even more than usual. The portfolio's quality tilt
We realise that our focus on quality might mean we sacrifice some additional upside when things are going well, but it also ensures our investors are protected on the downside as the dust settles and the market begins seeking out companies that are strategically positioned, with solid fundamentals, positive cashflow generation and strong balance sheets. Despite the short-term volatility and underperformance of a select few names, we believe the Fund is well positioned for a period marked by slowing economic growth and rising costs of capital because of the inherent characteristics of disruptive companies and our portfolio construction process, which leans heavily toward strong balance sheets and business models, so is high on quality. Despite macro headwinds, disruption marches on… For Tesla, competitors are comingTesla is currently valued at more than double that of the entire global car industry (excluding itself, or course). While not wishing to in any way minimise Elon Musk's inestimable impact on these car makers (and the fossil fuels on which they run) it is simply not credible that the existing industry will not fight back. The table below shows the market share of the top ten car makers by production of electric vehicles. Generally, these sales represent only a small fraction of the car companies' overall output across internal combustion engines, but the takeaway is simple - Tesla has just 20% of the total market share in EV's worldwide.
Source: Morgan Stanley Take VW as an example, which since we wrote in our piece title "VW's car accident; don't waste a crisis" in Sept 2015, now has 10% of the battery electric vehicle market share. The company has not one but two battery technology pioneer companies in its orbit - Quantumscape and its US 24M, the latter of which is reportedly capable of energy density (kilowatt hours/kilogram) around 50% higher than Tesla. As we said in our piece . Another data point: The Wall Street Journal in January carried a review of BMW's new electric 4 series. "After a couple hundred kilometers soaring across Bavarian fairyland, here's my capsule review: glorious. Sweet, swift, swank, swell, fast as hell, hushed as a chapel, cool as marble. With its front and rear e-motors providing a digitally mastered 536 hp to the wheels, the i4 M50 accelerates like Derby Lane's electric rabbit-0-60 mph in 3.7 seconds. It's too bad earlier generations of car reviewers have squandered the phrase "corners like it's on rails," because the i4 M50 really does."
The 2022 BMW i4 M50 all-electric luxury sedan capable of 227-270 miles of range between charges and DC fast-charging capacity up to 200 kW. Source: BMW December quarter earnings highlight the resilience of secular trendsLast month we wrote extensively on the importance of semiconductors as the bedrock for much of the disruption and secular trends we are witnessing. Since then, many of our semiconductor companies have reported strong results driven by robust demand in their respective end markets (consumer - phones, cars, other devices - industrials and more). Many of our other core holdings - still beneficiaries of semiconductor advances - such as Apple, Amazon, Google and Microsoft all reported results that beat the market's subdued expectations. It is positive results like these that add to the conviction we have in the long-term secular trends we are exposing our clients to. Although the short term might remain volatile and uncertain, we believe that over the medium and long term the safest place to be is in quality companies riding secular tailwinds. As a reminder, those secular tailwinds include 5G and the Internet of Things, cloud computing, digital advertising, ecommerce, streaming, electrification and importantly the semiconductors underpinning it all. We do not believe the strong results will end here. Funds operated by this manager: |

14 Mar 2022 - Inflation, interest rates and equities: the big question
|
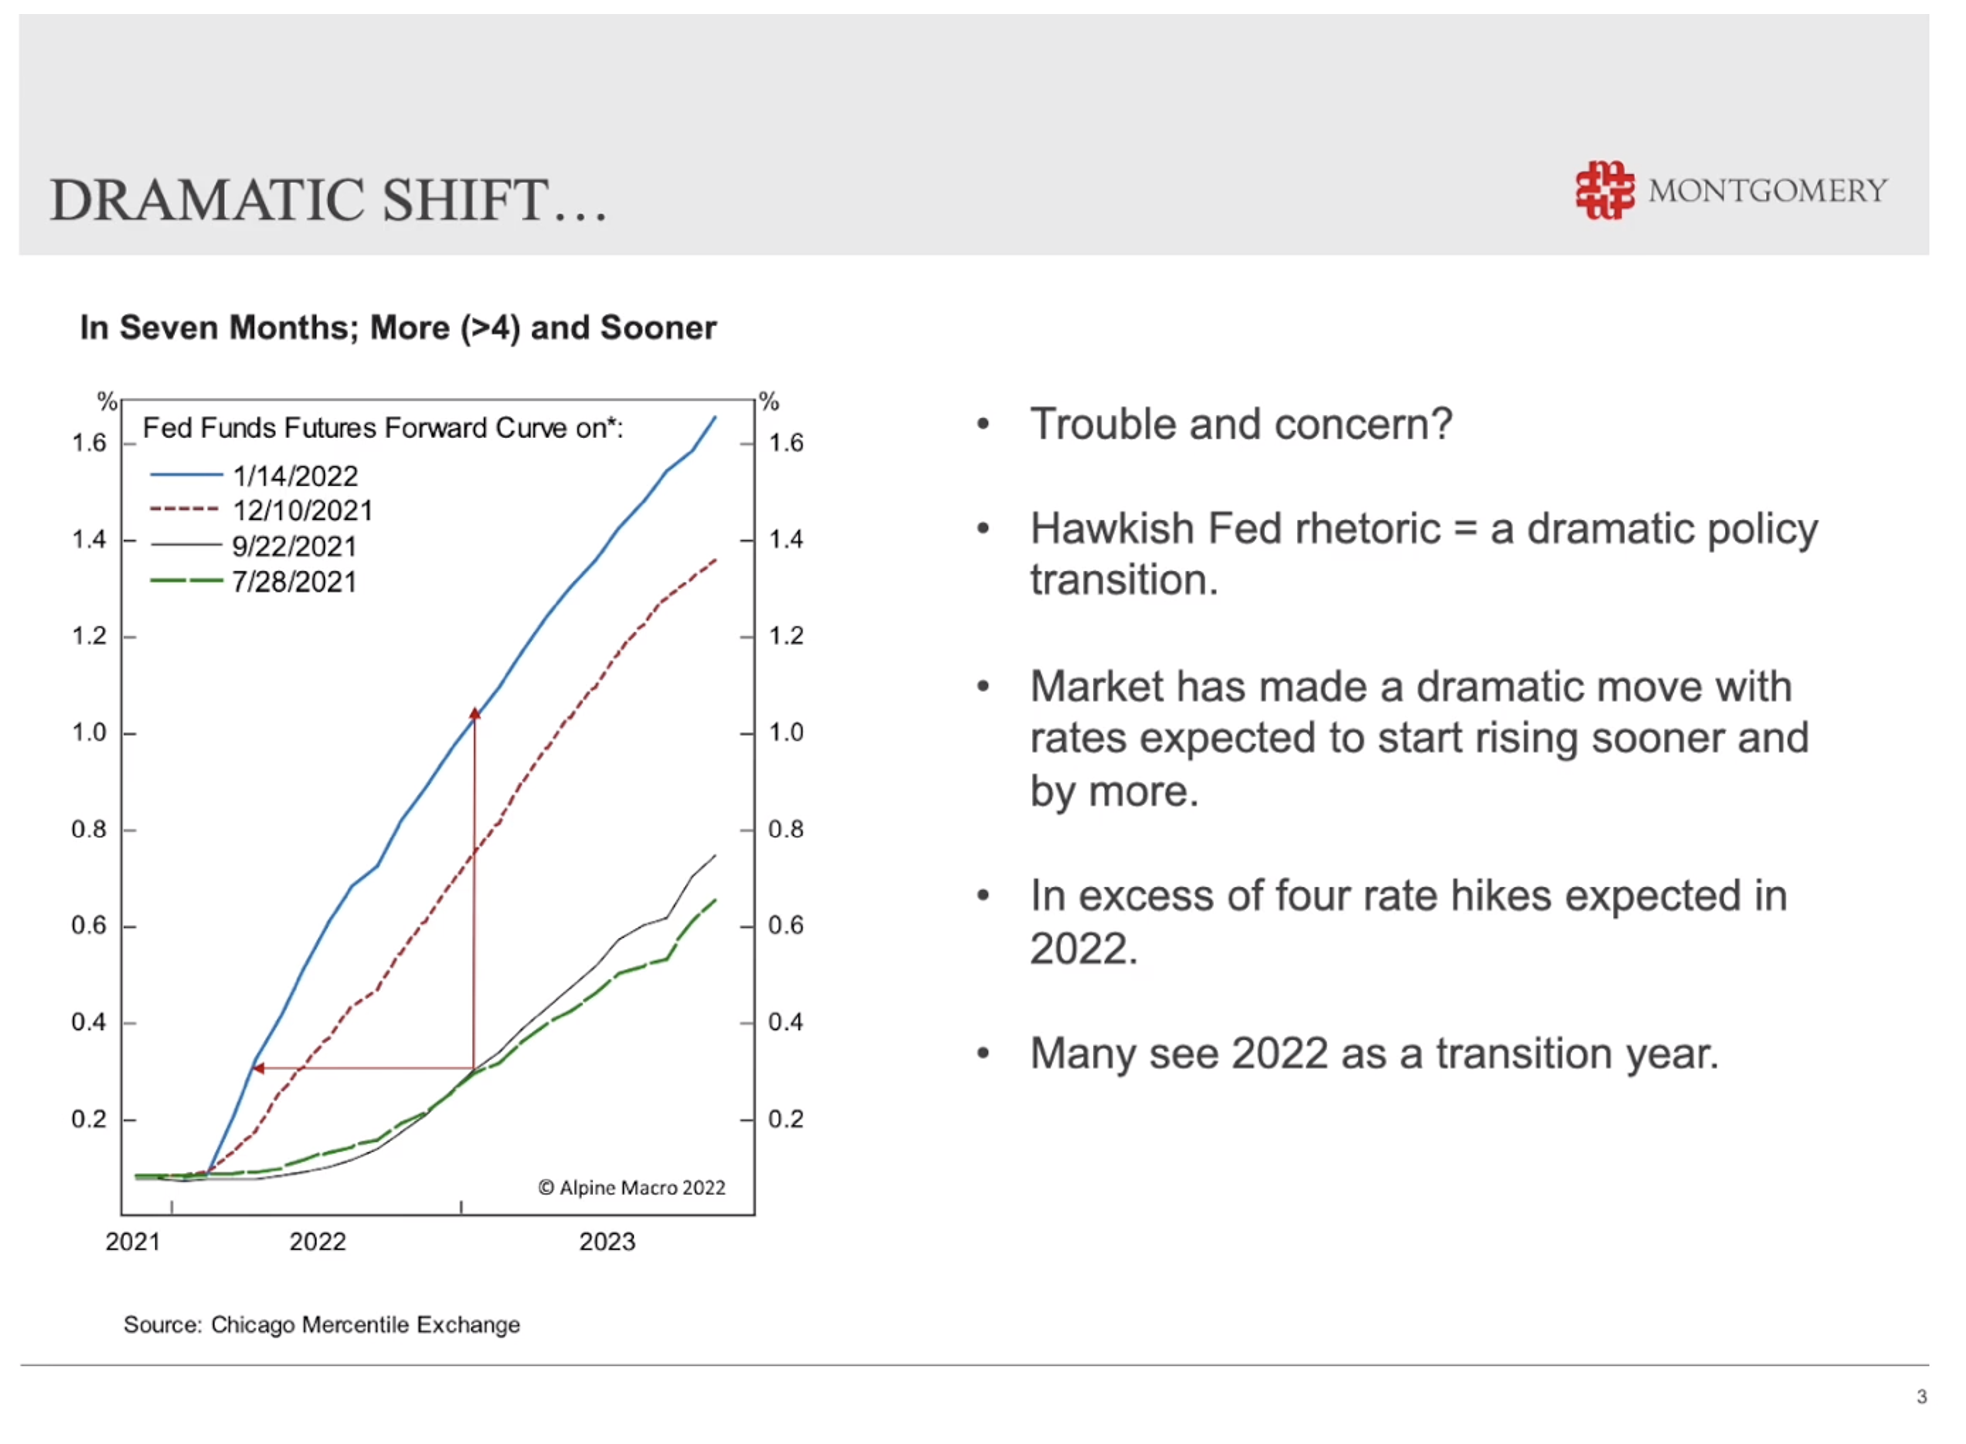
Inflation, interest rates and equities: the big question Montgomery Investment Management February 2022 Roger Montgomery (00:07): It is February 2022. And over the next few minutes, I'm going to address the question that is probably on the minds of most investors at the moment, and that is the interaction between inflation, short term interest rates, and equities. And what we'd like to do is present an argument that suggests that consensus may have their expectations with respect to inflation and interest rates wrong. If that's the case, then there is a very good argument for buying some of the beaten up stocks that have seen their PEs contract substantially over the last month or month and a half. With that in mind, it's very important to appreciate that we are going to be mentioning some individual company names. Roger Montgomery (00:56): This isn't a recommendation to buy those companies. In fact, we recommend only that you take personal professional advice. The last seven months or so has seen a substantial step change in interest rate expectations as a consequence of the appearance of inflation in the United States and around the world. You can see on this particular chart going back all the way to July last year 2021, that green dash line is a representation of where interest rates were expected to be back then. And you can see that since then moving to the blue line, not only have our interest rates expected to be higher, but they're expected to move sooner and more steeply.
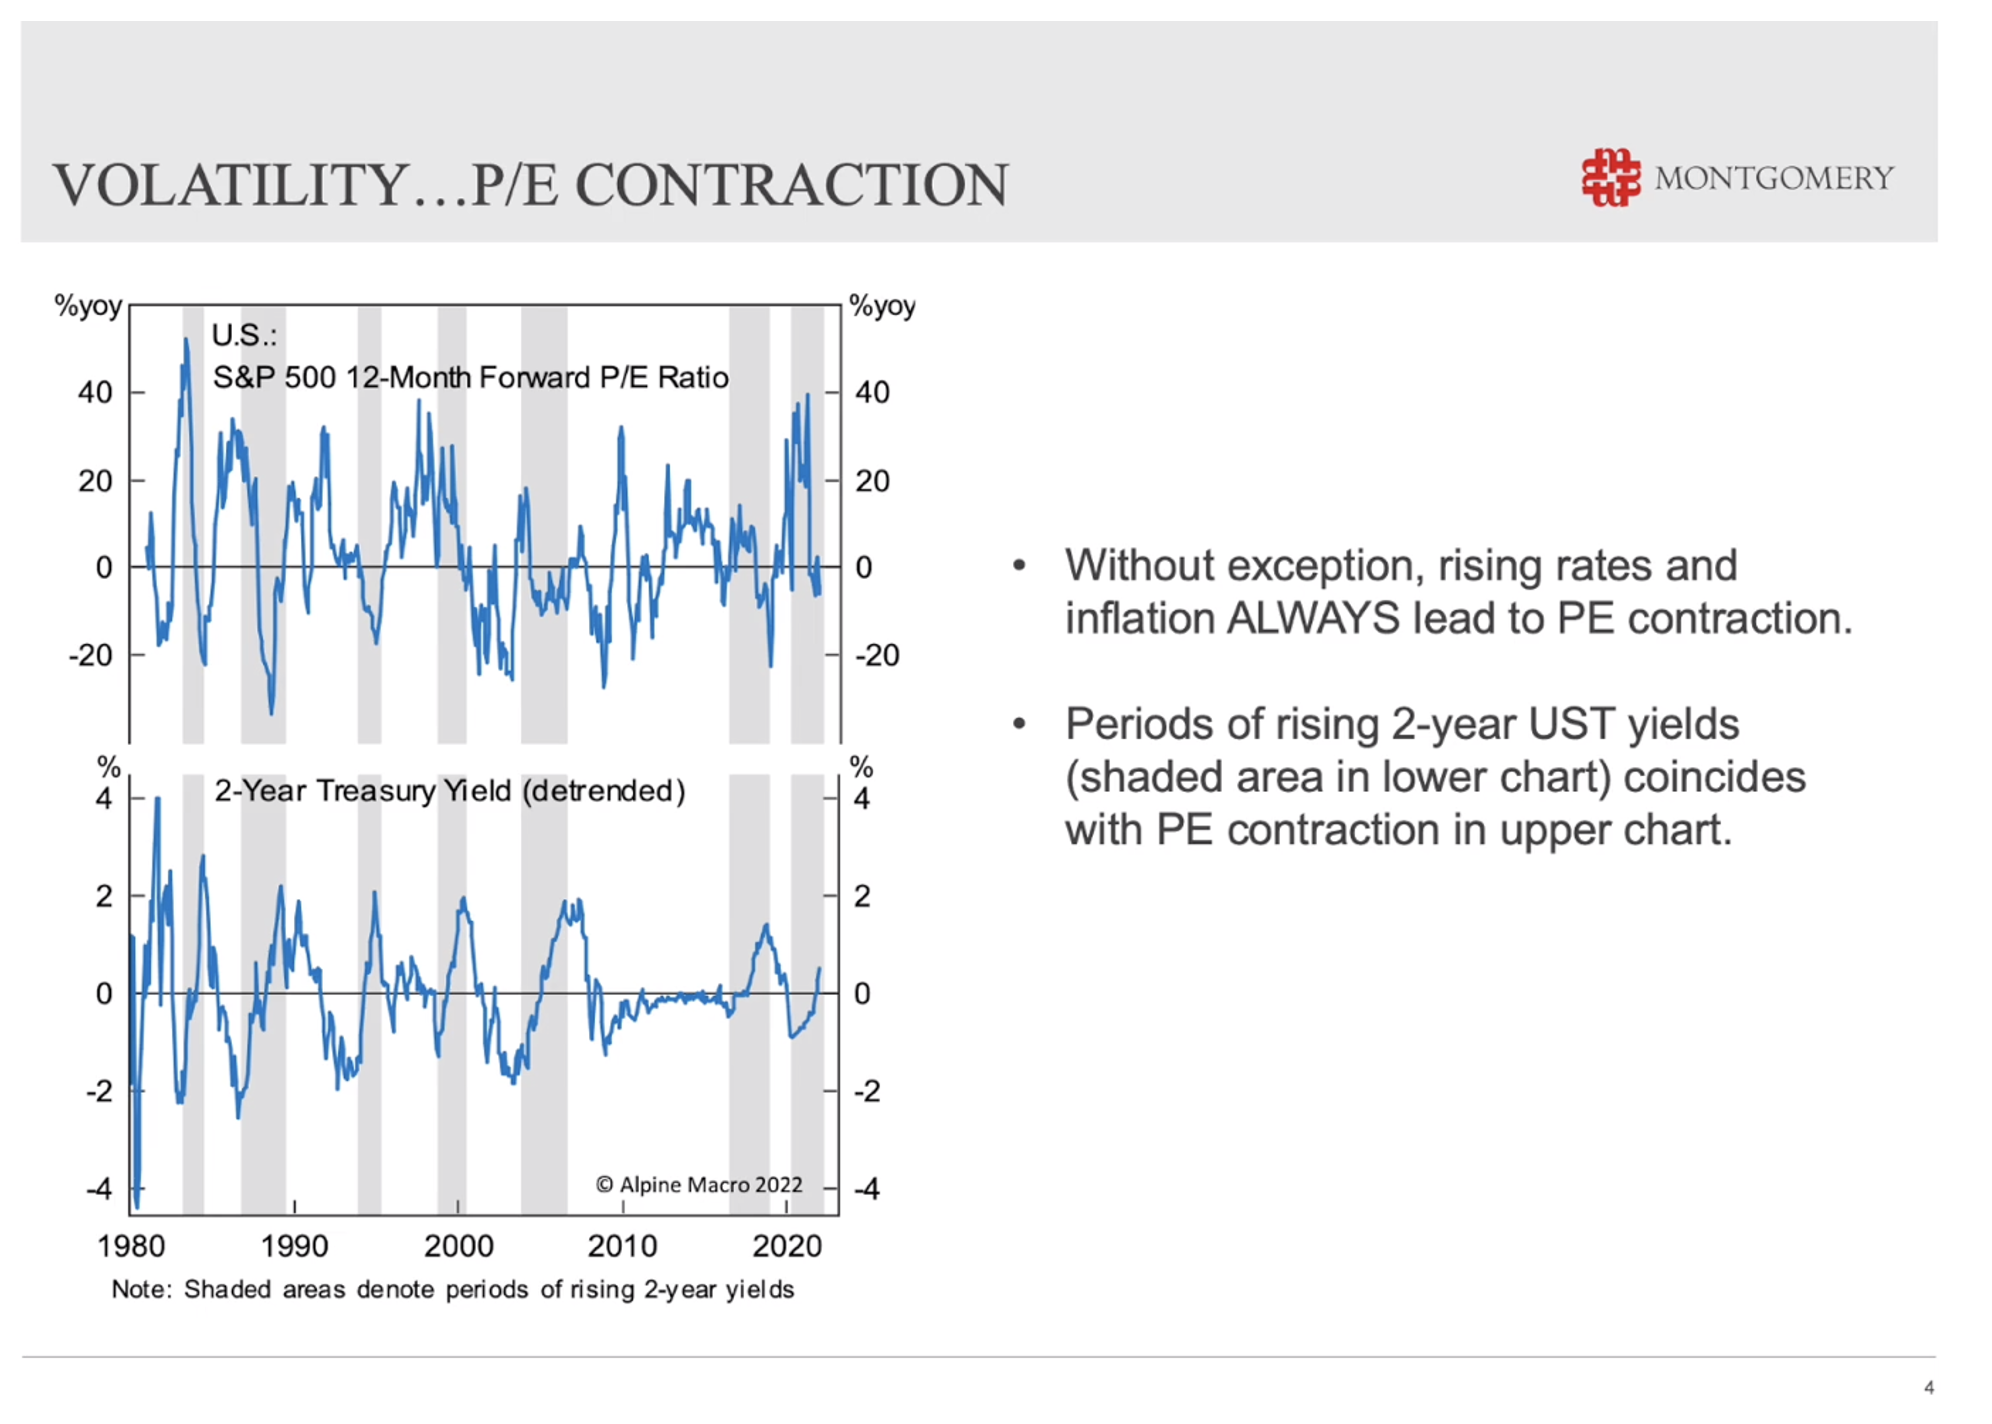
And that really has been a very dramatic change in expectations in the market. It stems from the very hawkish fed rhetoric that's coming out of both the FOMC, the Federal Open Market Committee meeting and Jerome Powell himself. And the question is, is this troubling and should investors be concerned at the moment? The expectation is that there are probably going to be more than four interest rate hikes this year. Many investors see 2022 as a transition year. I want you to remember that expectation of four rate hikes, or even five rate hikes this year, which is currently appears to be priced in to markets, because we're going to assess the legitimacy of that or the opportunity that it presents in just a moment. Roger Montgomery (02:36): Now, it's really important to understand that since the late 1970s, there's been a huge number of studies that have shown that in periods of inflation and also during periods of rising interest rates, PEs contract or the multiple of earnings that investors are willing to pay for a company contracts. And that is the case without exception as you can see in the lower chart here, those gray shaded areas represent periods since 1980, where the 2-year yield in the United States or 2-year US Treasury yields have increased. And that coincides with periods in the top chart where PEs have contracted, and that happens without exception. So, rising interest rates means PEs contract and inflation also results in PEs contracting.
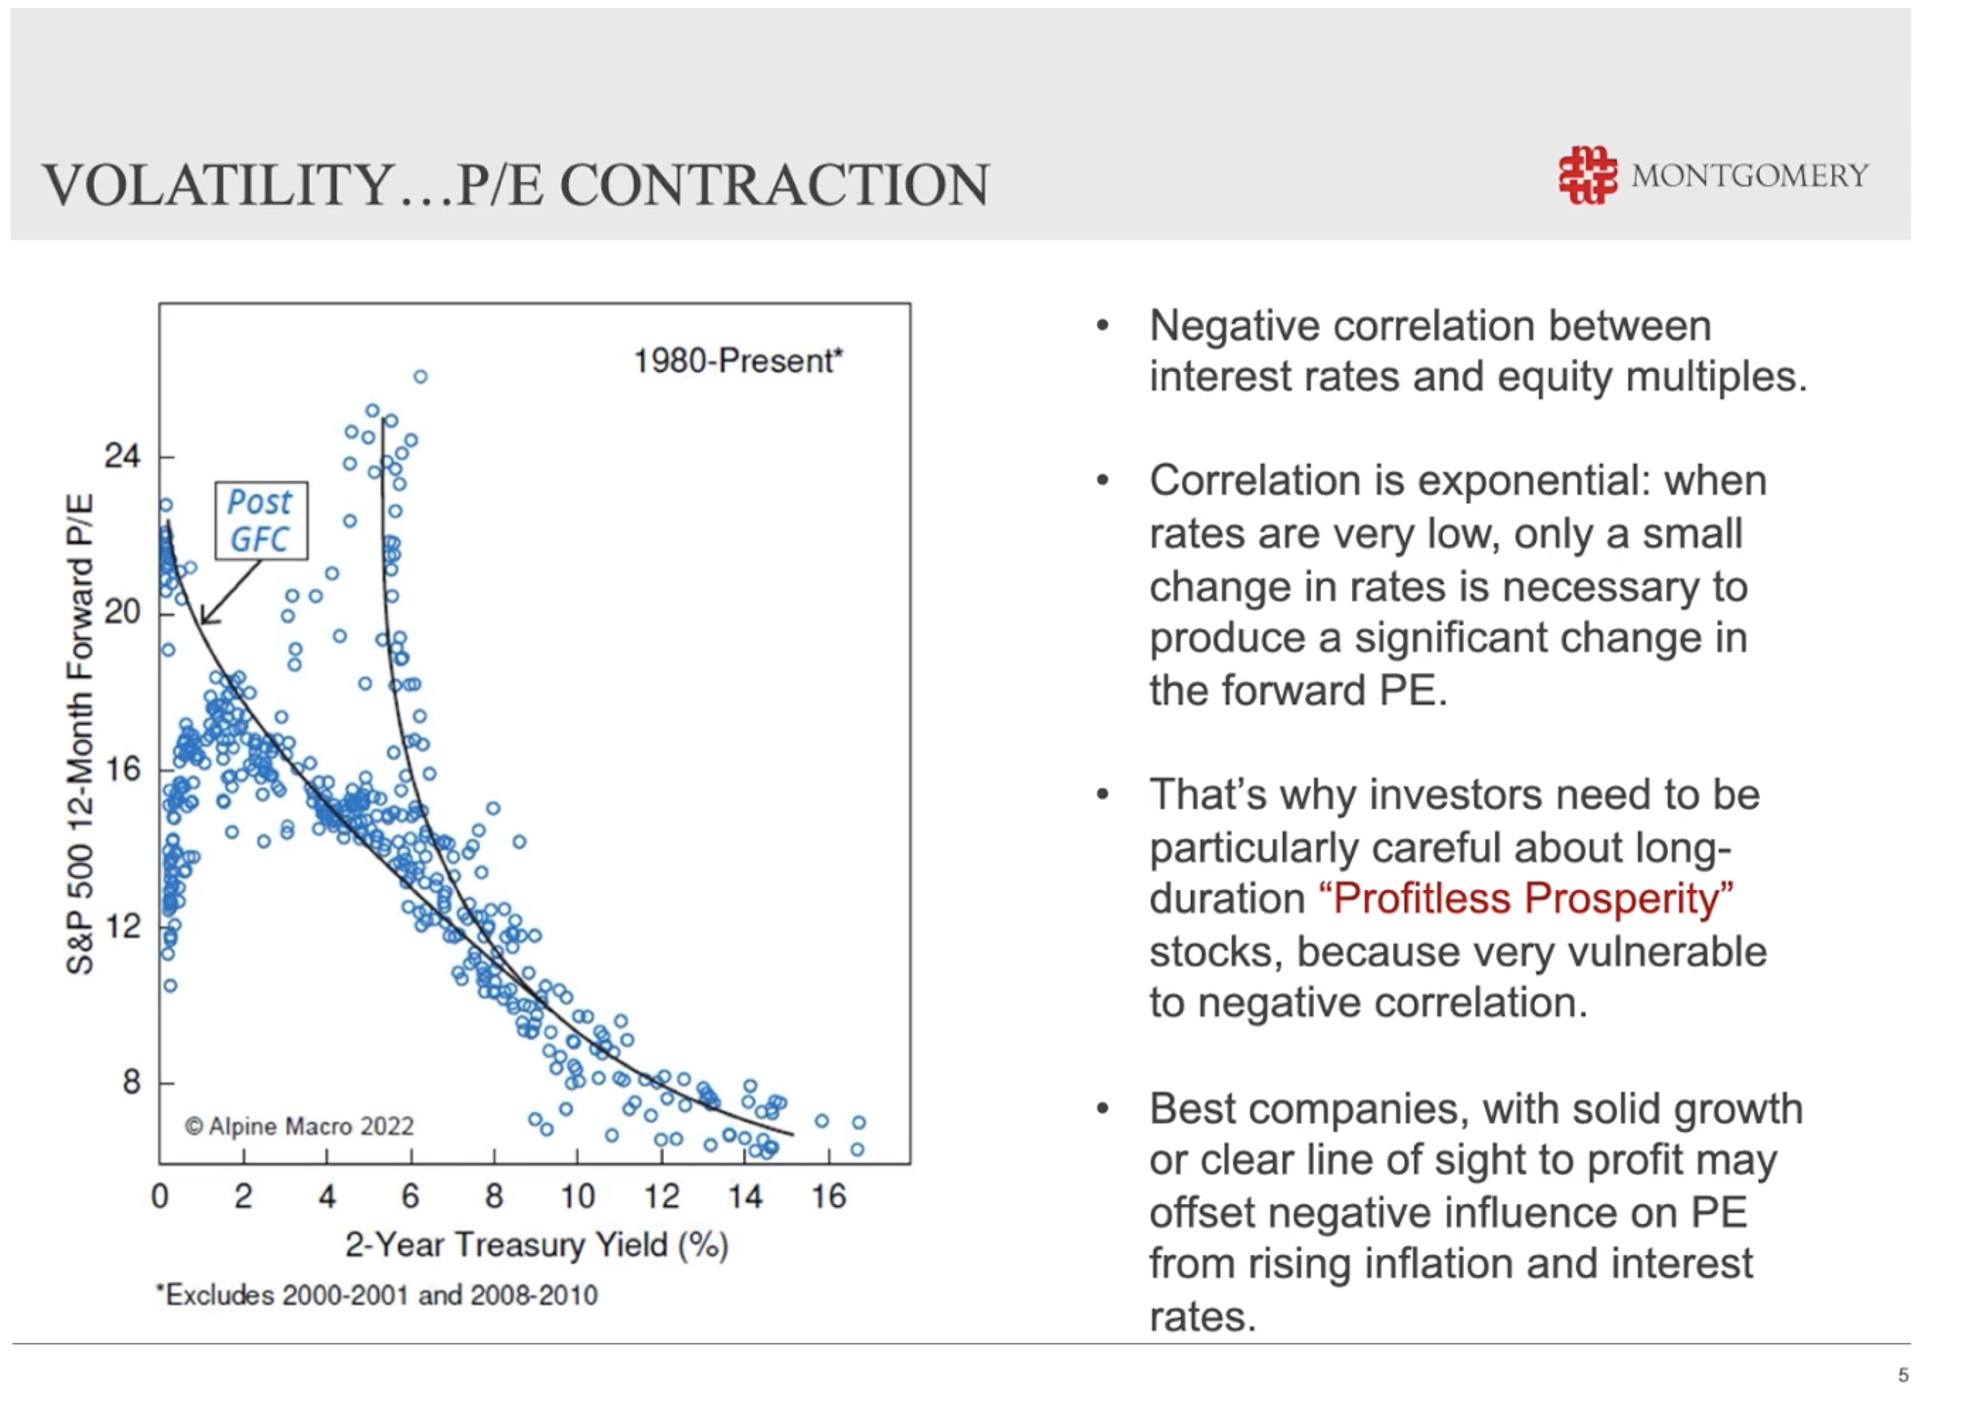
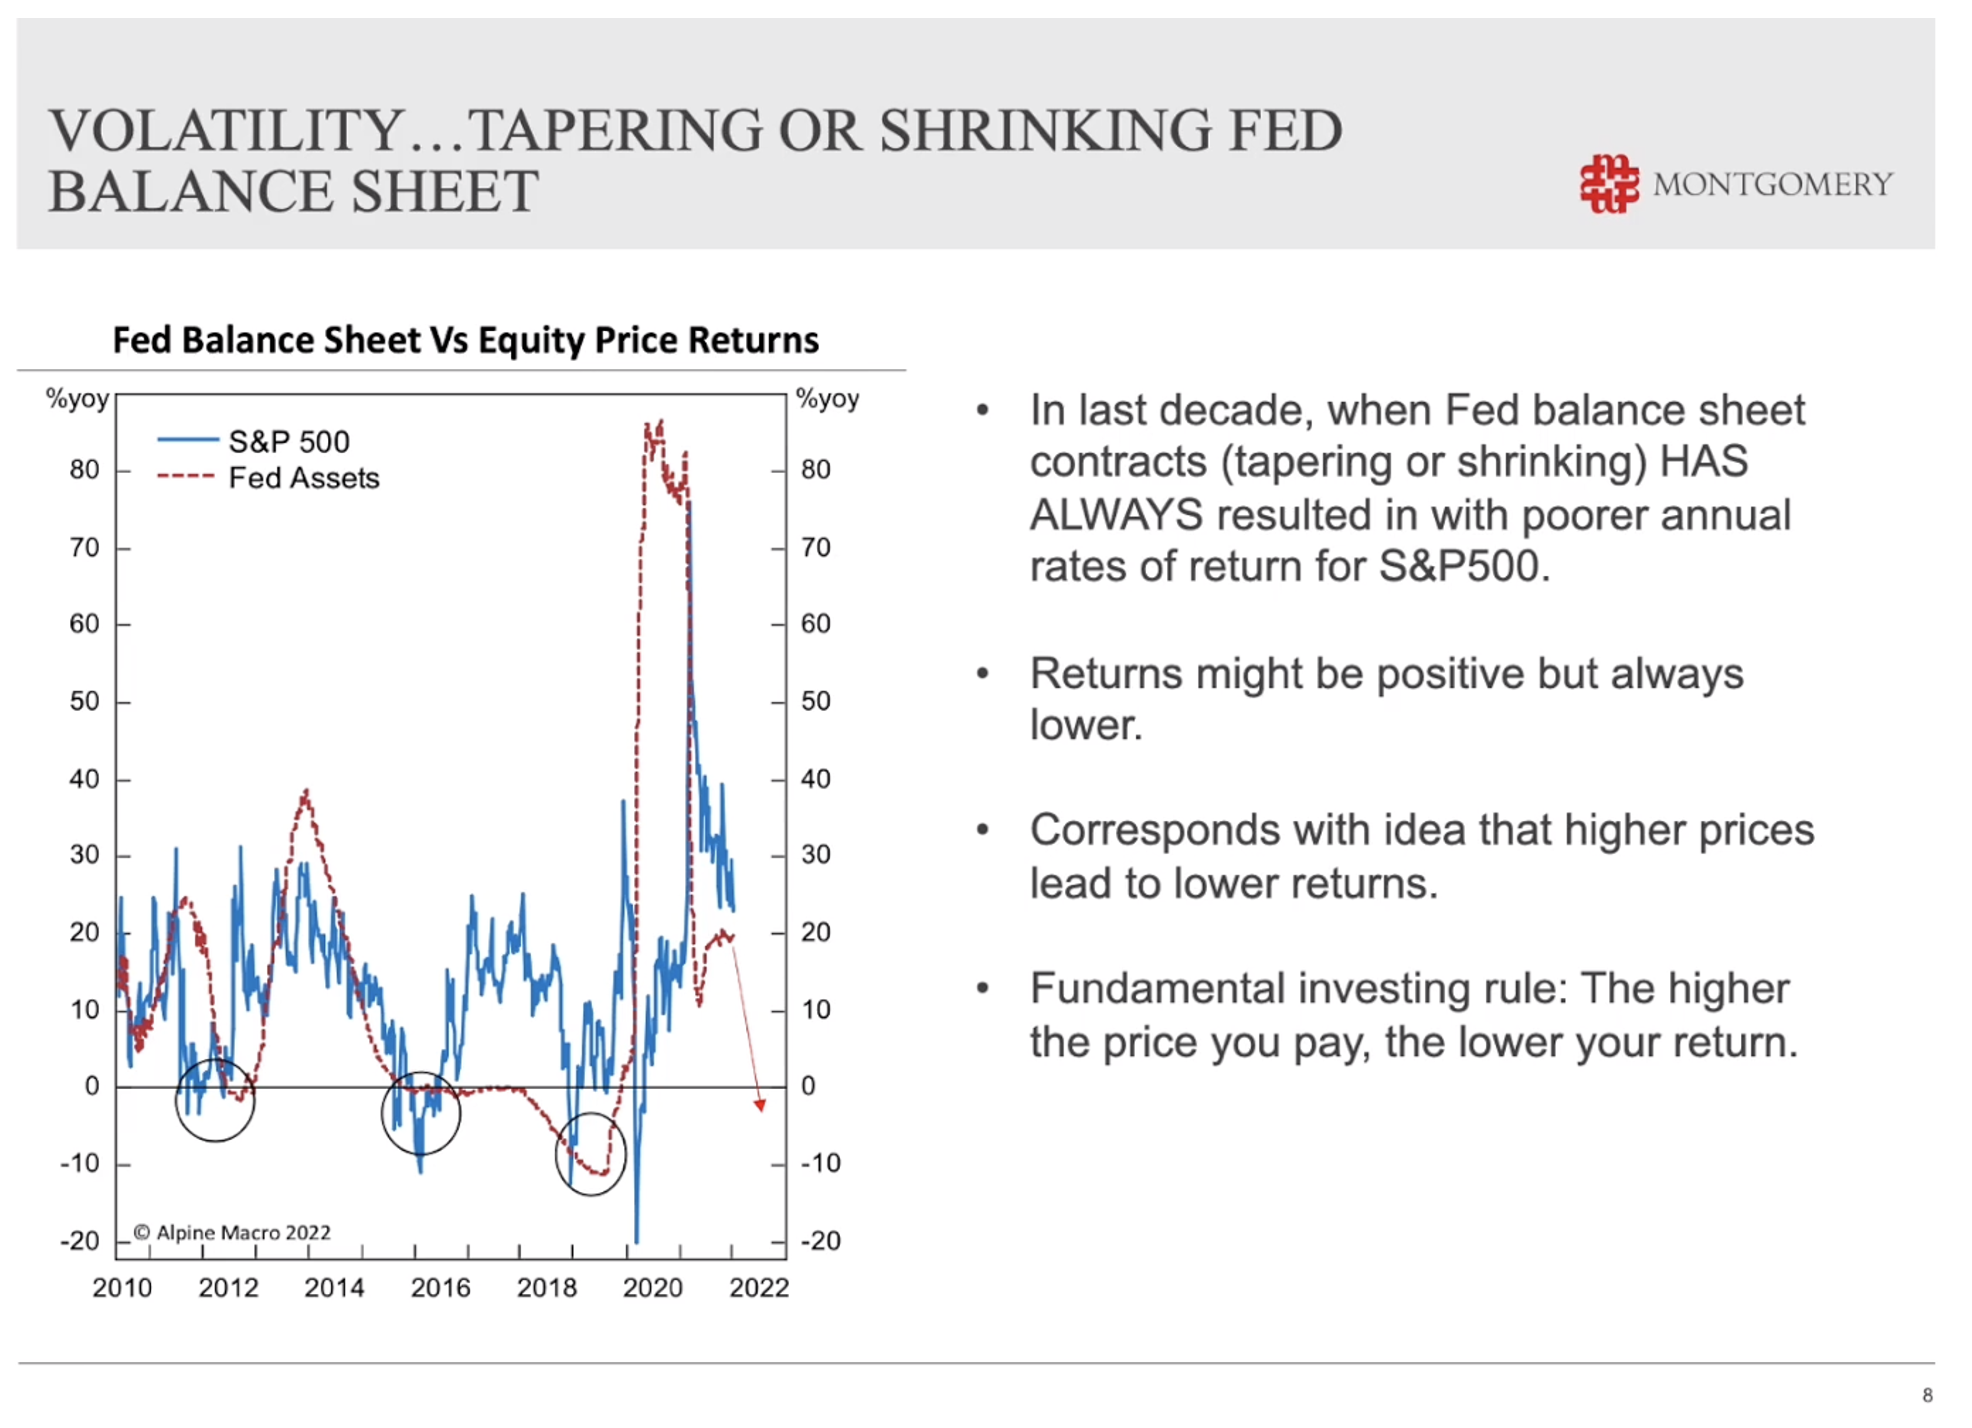
In fact, the greater the inflation, the greater the contraction in PEs. You can see on this particular chart also since 1982 to the present, not only is there a negative correlation between interest rates and PEs or equity multiples, but that correlation is somewhat exponential. Now, this is really important to understand, because what it means is that the lower interest rates are the greater the move on in PE, or the greater the contraction in PE for a given increase in interest rates. And that's why investors need to be particularly careful about what we've dubbed the profitless prosperity stocks. They're the stocks with profits pushed way out onto the horizon with no clear line of sight becoming profitable. They're the ones that tend to be most sensitive to interest rate increases or prospective interest rate increases. But of course, because they've contracted so much in terms of their PE, that could also be an opportunity which we'll address in just a moment. In Australia, we've seen that PE contraction occur substantially. Just in the month of January, in fact, from January the fourth, you can see there are companies like Pro Medicus and Transurban and Reese, ARB, IDP Education, Corporate Travel, REA Group, for example, all very high quality companies. And they've seen their PEs contract from between 14 per cent and by almost a third 33 per cent, in fact, contraction in price to earnings multiples. Roger Montgomery (05:09): So, people are willing to pay substantially less for these businesses, in many cases, very high quality businesses than they were just a month or month and a half ago, but the outlook for companies is very different to what their share prices have been doing. We know that share prices are far more volatile than business operations and the changes in business prospects. And you can see this survey from GLG conducted in early 2022, survey of 471 global CEOs, and 68 per cent of those CEOs believe and are very confident or confident that their revenues will grow over the next 12 months. So, what we've seen is this potential setup for great opportunity for investing, because we've seen PEs contract amid short term fees about interest rates and inflation. Roger Montgomery (06:03): But meanwhile, the underlying companies are reporting that they're confident or very confident in a large case of those surveyed, confident or very confident that their revenue are going to grow. So, businesses are continuing to grow. They're continuing to profit, they're continuing to demonstrate bright prospects, and yet their share prices have contracted substantially. So the question remains is, is this an opportunity? Well, before we answer that question, just have a look at the contraction, or think about the contraction that we've seen in the Fed's assets or in their balance sheet. We know that we've seen quantitative easing and that's tipping over to quantitative tapering now. Roger Montgomery (06:54): So in other words, the US Federal Reserve is buying fewer government bonds each month than what they were buying previously. And what you can see in this chart is that not only as we mentioned earlier, is there a relationship between rising interest rates and contracting PEs, but there is also a relationship between equity market returns and a contracting US Federal Reserve balance sheet. That relationship demonstrates that as the Fed contracts its balance sheet, as it goes from quantitative easing buying bonds in substantial amounts, to reducing the number of bonds that it buys, or the amount of bonds that it buys, and then to contracting its balance sheet, where it actually shrinks the balance sheet, rather than grows it at a slower rate.
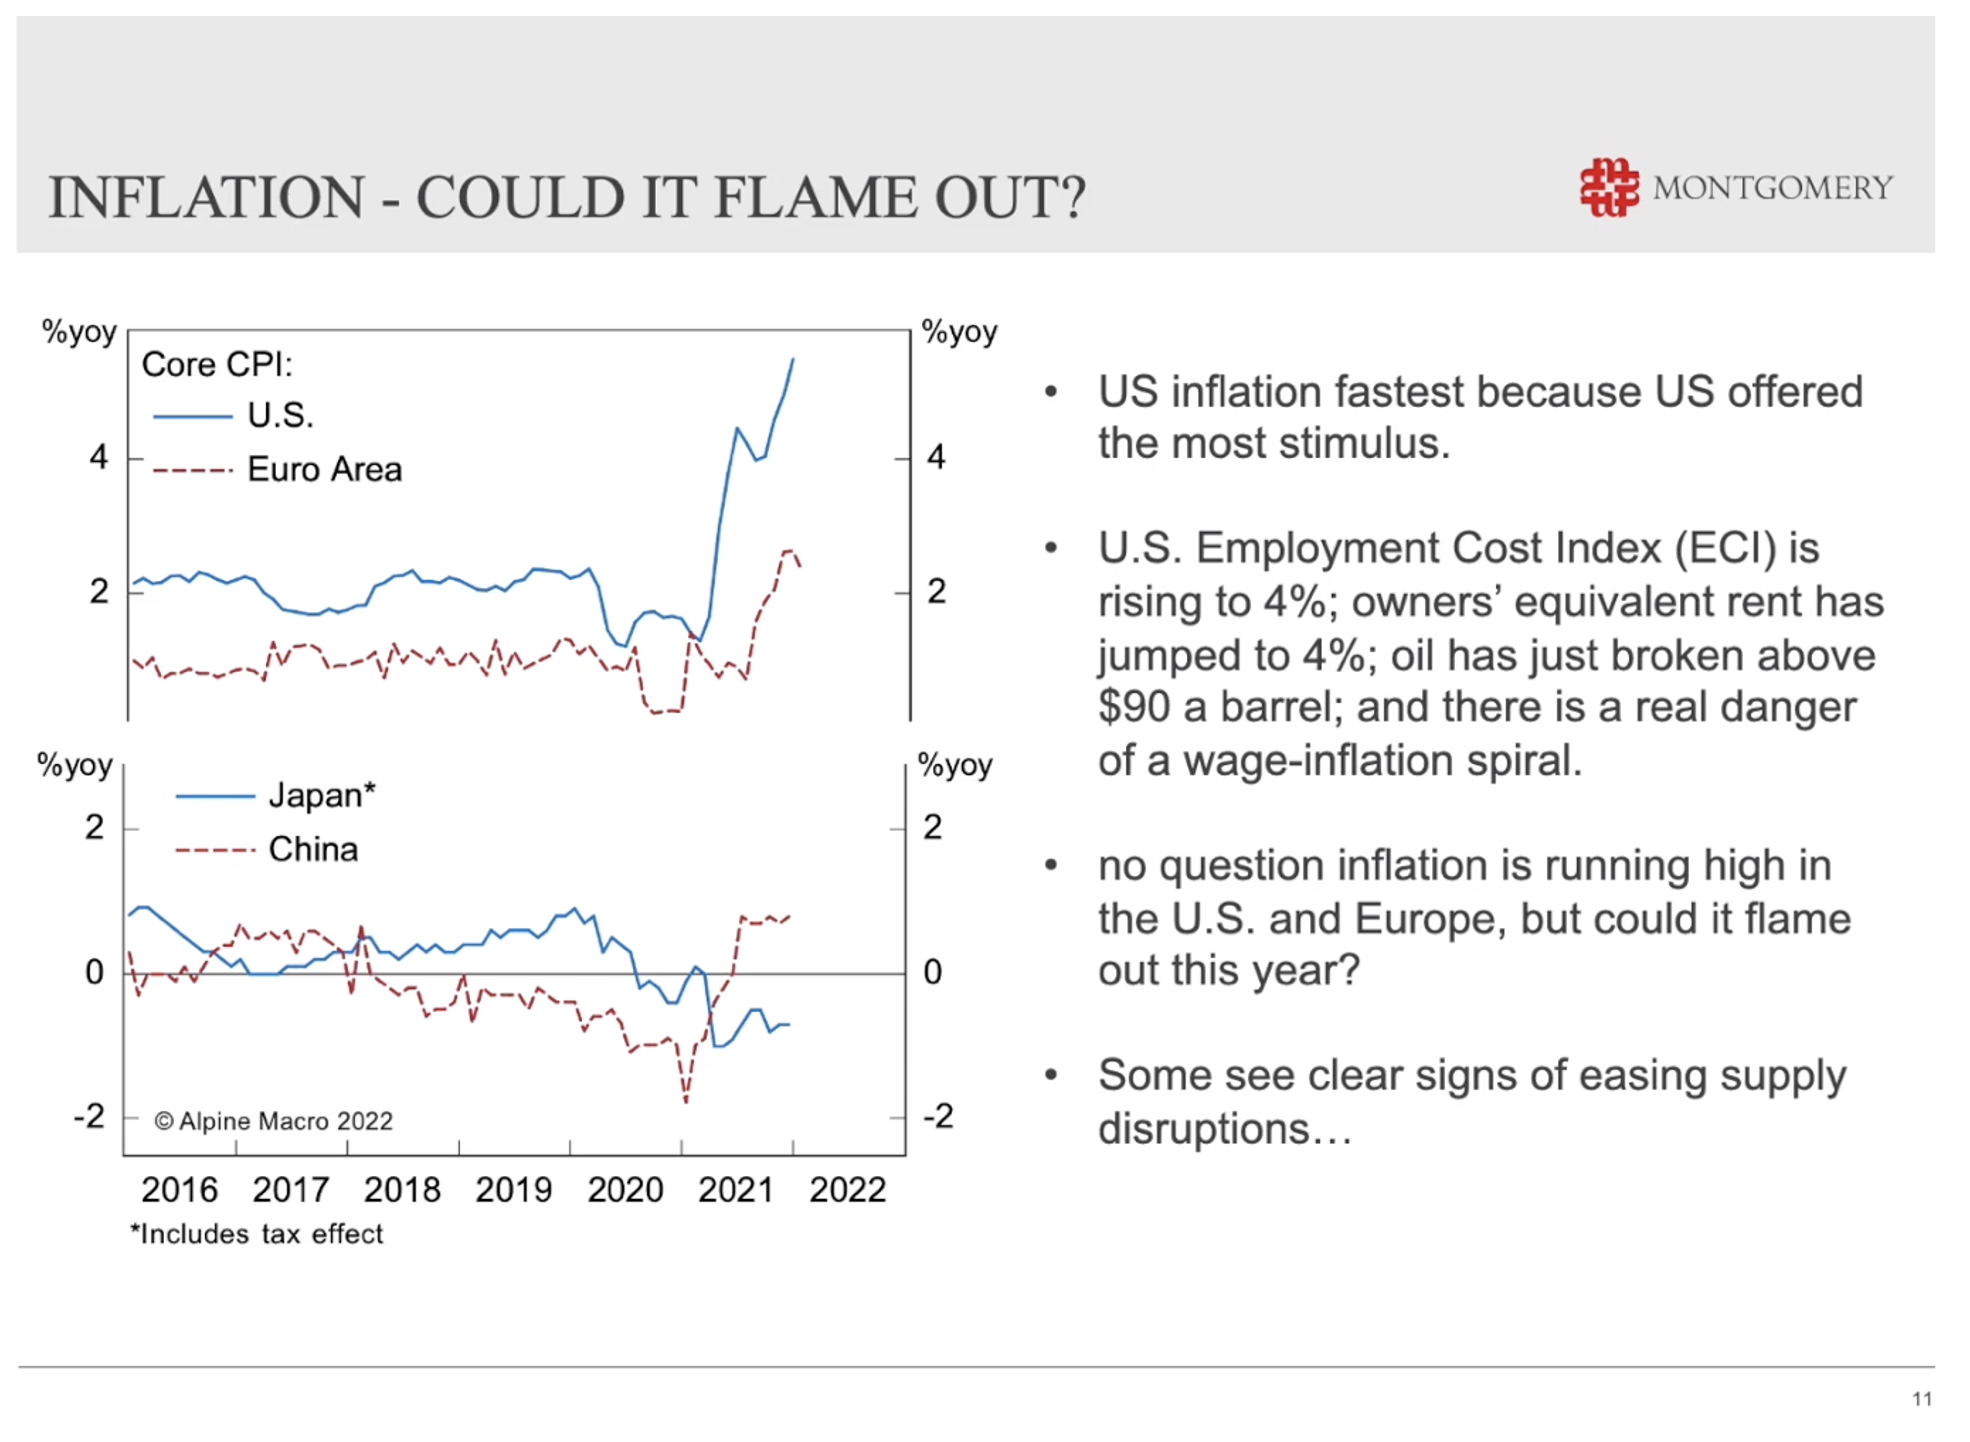
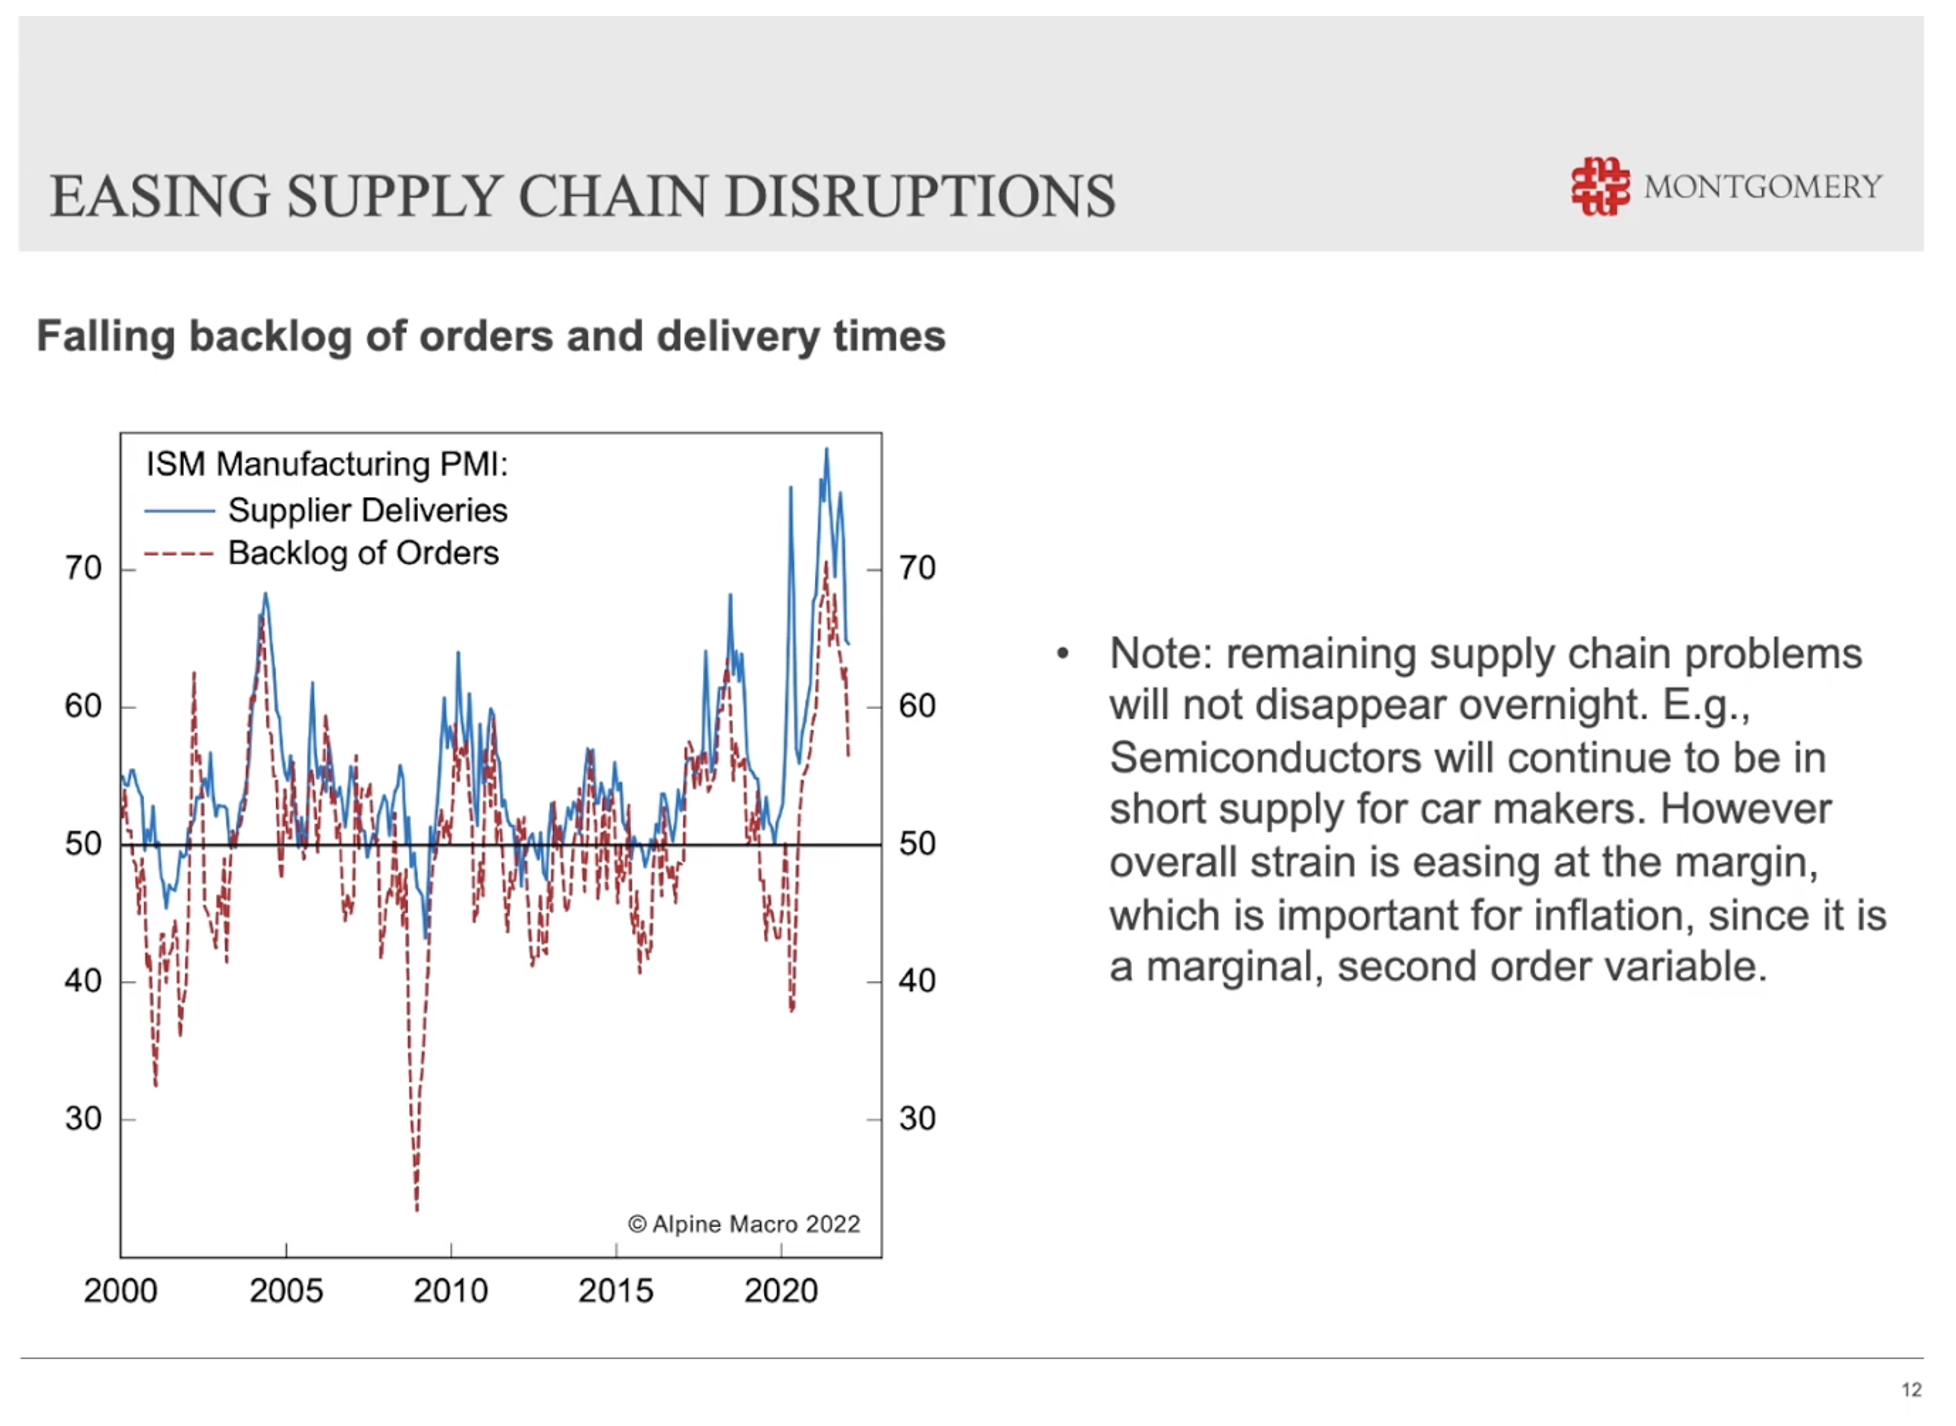
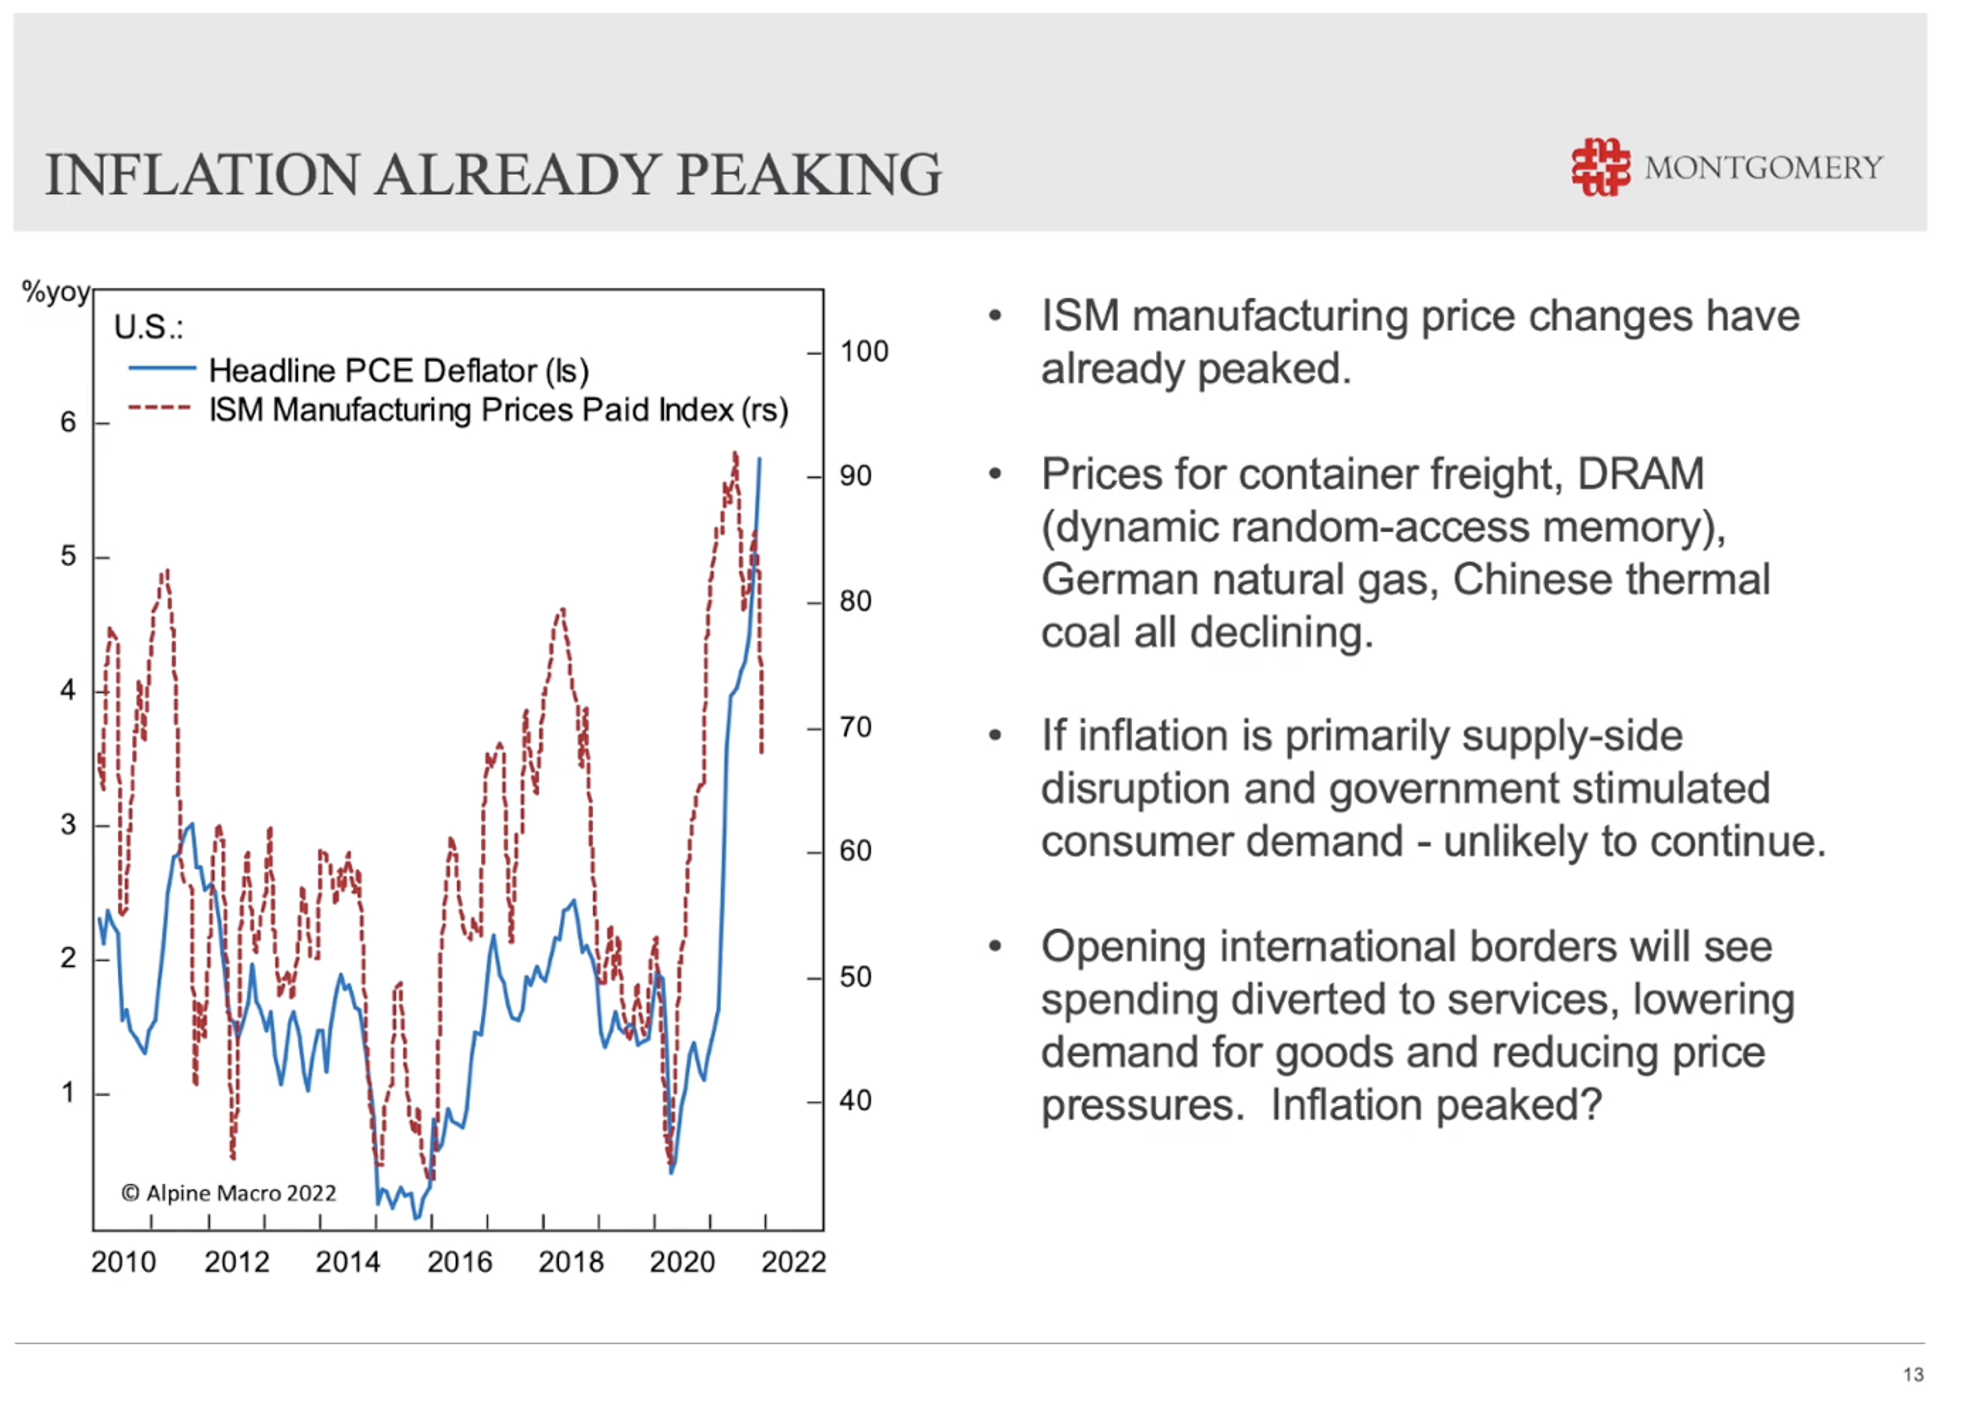
You can see that corresponds to returns on the stock market. The greater the balance sheet expansion, the greater the returns in the stock market. The greater the contraction of the balance sheet, the greater the negative return in the stock market. And that corresponds with a very simple idea that the higher the price you pay, the lower your return if you're paying very high prices for stocks. Then in the future at some point, you're going to end up with a lower return, particularly if you bought or paid high prices for stocks, when the US Federal Reserve's balance sheet was expanding. Now all of this, the prospect of rising interest rates in 2022, as well as a balance sheet contraction looks very similar to 2018. Roger Montgomery (08:26): In 2018, the US Federal Reserve hiked rates four times, and they contracted the balance sheet by about 10 per cent. So, Jerome Powell's hawkish statements recently offers a very similar prospect for 2022. Now, what we have to remember is back in 2015, we had an oil meltdown and a nominal recession in the United States. In 2016 and 2017, the economy then began recovering. The US was growing at about 3.8 per cent. We had Trump's tax cuts, and the economy was thought strong enough to support four rate hikes. For 2018, the conditions however weren't strong enough to support the Fed's four interest rate increases. The Fed arguably went too hard and that produced a stock market correction late in 2018 and importantly, that saw the fed stop raising interest rates. Roger Montgomery (09:24): Now for 2018, the US S&P 500 returned minus 7 per cent, after that stock market correction. And the Fed backed off. What's interesting is though that action of backing off raising interest rates actually saw the S&P 500 generate a 30 per cent return the following year in 2019. So, what is the possibility that the really hawkish statements we're seeing out of the US Federal Reserve now actually coincides with peak inflation fear, or even peak inflation? Is it possible that inflation has already turned the corner, and that we see lower rates of inflation in the future, which then sees the Fed pivot its current policy or current rhetoric to a more dovish and less hawkish rhetoric? Well, here's what the bond market thinks. Roger Montgomery (10:18): If you look at the difference between treasury constant maturity, securities, and treasury inflation index securities, which gives you an inflation break even curve, you can see that yes, expectations for inflation have risen slightly over the next 10 years, but it still remains steeply negative. That curve is steeply negative. Meaning, that inflation is seen by the bond market, at least as not persisting and in fact, temporary. I think about that in the context of what the bond market has actually had to absorb. They've seen 7 per cent inflation, which is massive in the United States. They've digested the possibility of four or five rate hikes from the US Federal Reserve. Roger Montgomery (11:00): They've heard tougher talk from the Fed, and there's also political pressure to deal with inflation. And despite all of that, the bond market remains firmly convinced based on this curve that inflation is a temporary phenomena. And in fact, it's not going to persist at all. In the US of course, inflation is on the front page and inflation has been very high there. And the reason why inflation is fastest in the US is because of course, the US offered the most stimulus. US employment cost index at the moment is rising to 4 per cent. Owner's equivalent rent has jumped to 4 per cent. Oil's just broken above $90 a barrel. So, there are real fears of a wage inflation spiral. Roger Montgomery (11:46): Look, there's no question that inflation in fact is running high at the moment. You can see it on this chart for the US, and it's running high in the US and Europe, but I wonder whether or not it could actually flame out. And in fact, there are some signs at the moment that the supply disruptions that have been partly responsible, or largely responsible for the jumping inflation are starting to ease.
And that coincides with this chart of the ISM manufacturing prices paid index, which is already tipping over. We know that prices for container freight, dynamic random access memory, German natural gas, Chinese thermal coal prices, for all of those things are already starting to decline. So, if inflation is primarily a supply side disruption and government stimulated consumer demand, or the result of those things, then it's quite possible these things aren't going to continue. And of course, if we open international borders, we'll see spending diverted to services again or travel, and that means lower demand for goods. And that we'll see some of the price pressure on those goods start to ease.
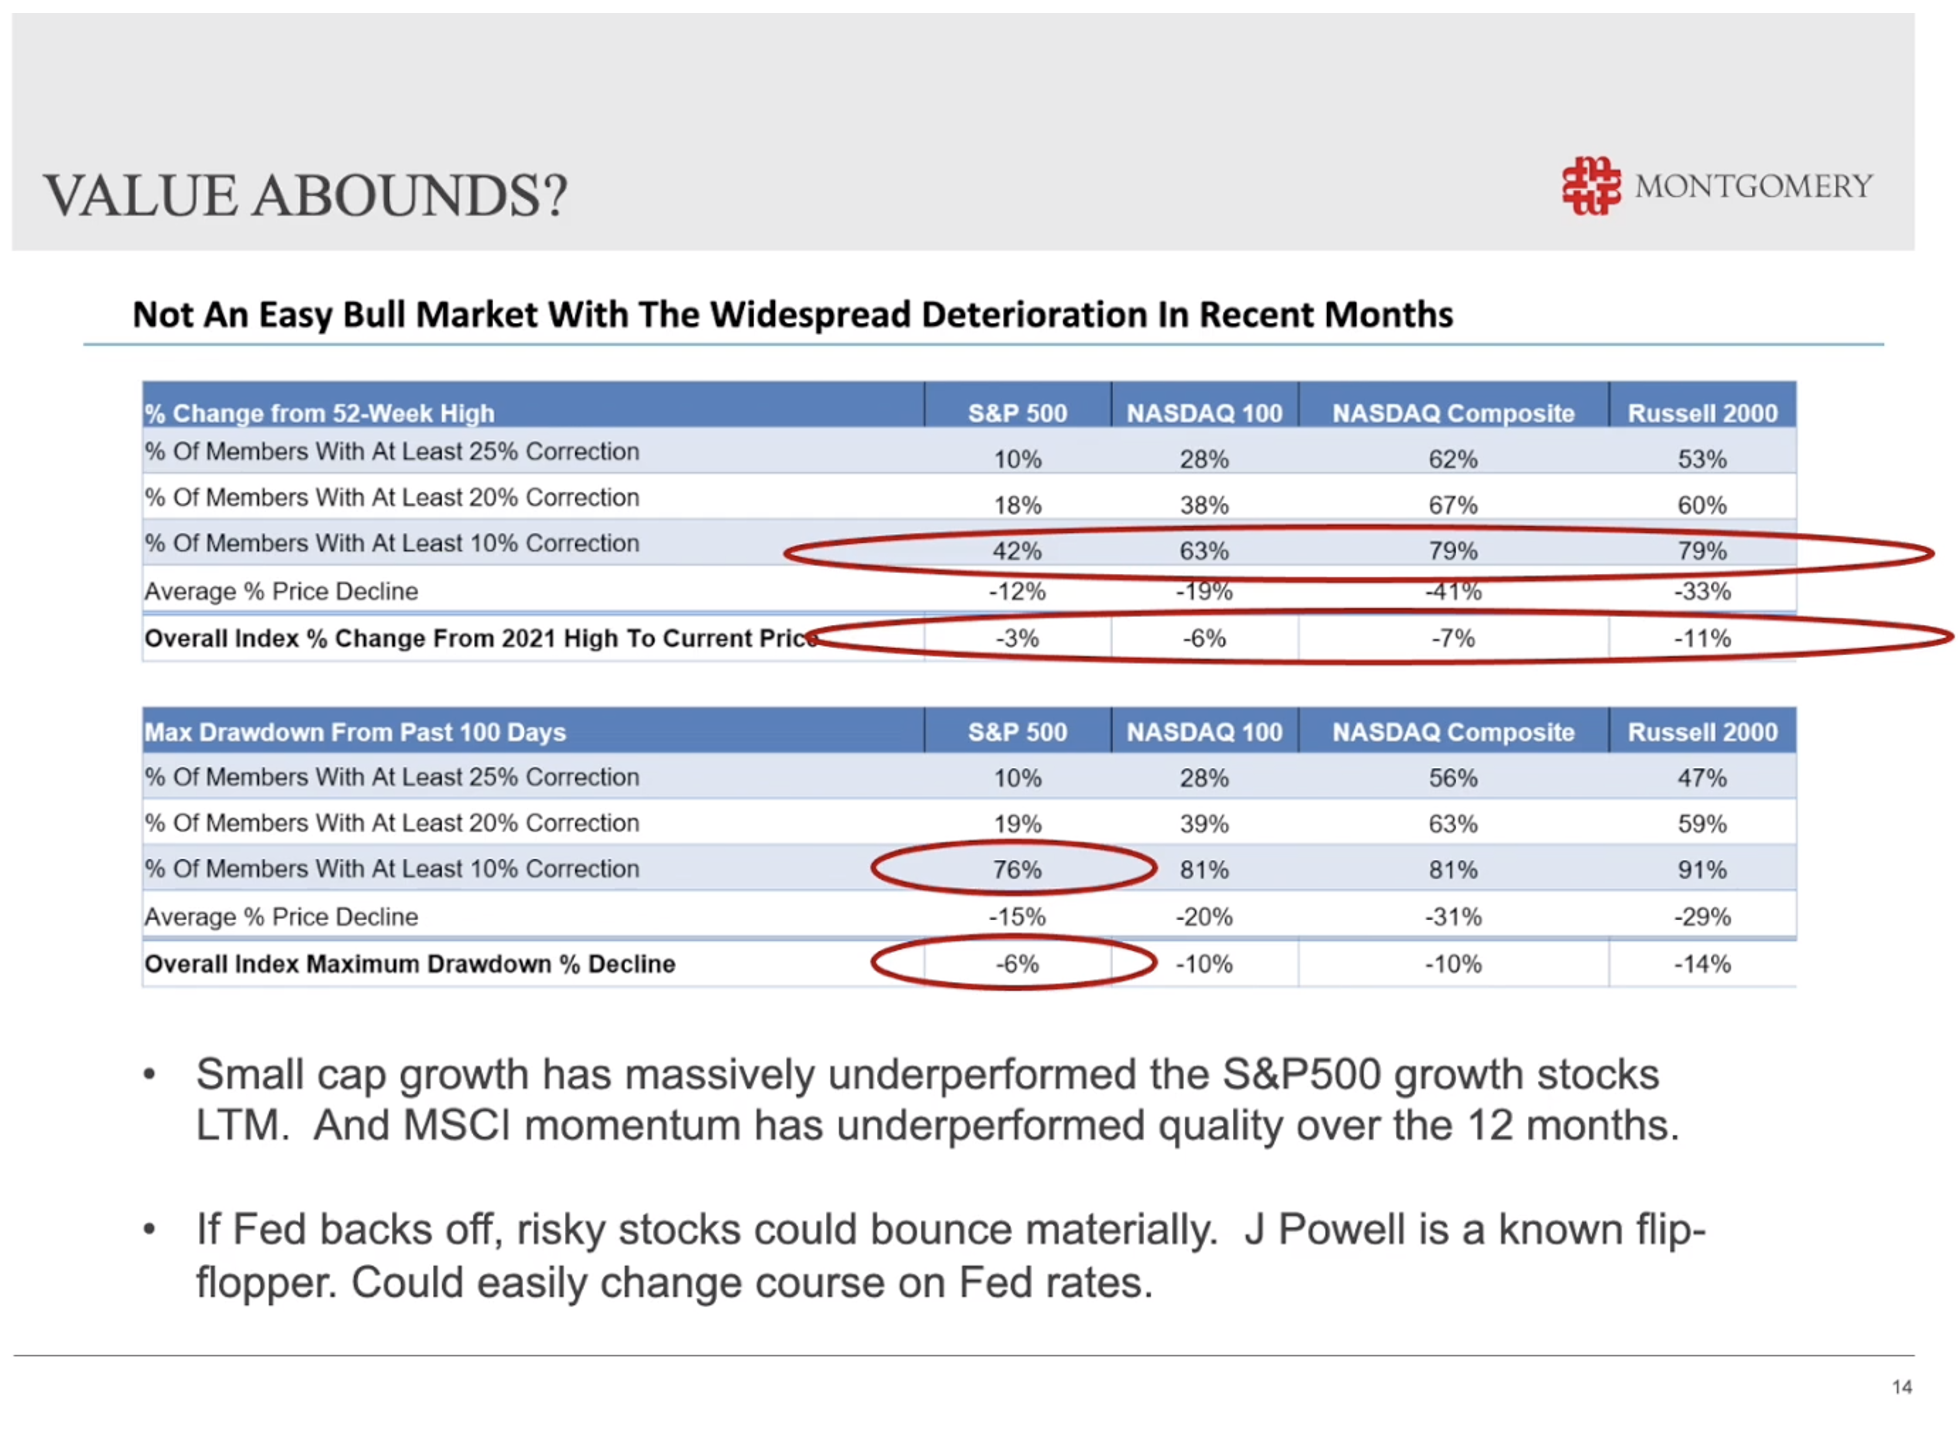
So, it's possible that inflation has actually peaked at the same time that the US Federal Reserve rhetoric is ramping up and causing all those fears in the stock market. And why is this an opportunity? This is an opportunity, simply because if you look at what the indices have done the S&P 500, our small caps index, if you look at the NASDAQ 100 in the United States or the NASDAQ Composite, you can see they've all fallen, but underneath those falls are much more substantial falls for individual issues. You can see on this table that something like 42 per cent of S&P 500 companies have fallen by more than 10 per cent, even though the S&P 500 has only fallen 3 per cent. You can see in the NASDAQ, for example, 79 per cent of companies have fallen by more than 10 per cent, even though the index has only fallen 7 per cent. The same story is true here in Australia, and that presents a host of opportunities. If you can find businesses that are still increasing their net worth, or increasing their value by generating high rates of return on equity, growing their equity by retaining profits, that process takes years to build value, yet the stock market abandons its long term plans, investors abandon their long term assumptions for companies and worry about the short term when interest rates are expected to go up, and inflation has been running in a million miles an hour, but there is an argument as I've just demonstrated that inflation is already peaking, that we'll see consecutive lower rates of inflation in the future. Roger Montgomery (14:39): And the Fed will ease its rhetoric around inflation and interest rate rises. If that happens, then the stock market could very well bounce quite violently. In fact, as violently as it's recently fallen, and that sets up investors for a terrific opportunity for 2022. Thanks for your time, look forward to talking to you again soon. Funds operated by this manager: Montgomery (Private) Fund, Montgomery Small Companies Fund, The Montgomery Fund |

11 Mar 2022 - Markets Volatile; Ukraine Invaded
|
Markets Volatile; Ukraine Invaded Laureola Advisors February 2022 THE INVESTMENT ENVIRONMENT - Markets Volatile; Ukraine Invaded The S&P 500 declined 5.3% in January. Gold and oil were up; crypto and bond prices down. The Russians invaded the Ukraine on 24th of February but markets already had a full slate of concerns prior to the invasion. Inflation refuses to go away: consumer prices were up 7.5% and housing prices up 18.8% in the USA with even smaller markets showing this level of increase. The Bloomberg Commodity Index is up over 12% ytd, led by crude and gasoline. Fertilizer is double the price from a year ago and the world's largest supplier of weedkiller - an important input in food production - declared a force majeure due to shortages of the key ingredient glyphosate. Many key commodities futures have slipped into backwardation indicating low stockpiles of the world's most important commodities (food, energy, metals) without the usual supply response. The Goldman Commodity analyst described the situation as "unprecedented". Our hearts go out to the brave Ukrainians in their struggle and of course their problems dwarf any investment issues. But the Russian invasion makes the global investment landscape even more uncertain: Russia is the 5th biggest trading partner with the EU, the #1 supplier of energy to the EU, and, with the Ukraine, an important exporter of corn and wheat. Uncertainties have increased; the value of a non-correlated investment strategy like Life Settlements is greater than ever. THE LIFE SETTLEMENT MARKETS - Markets Stable; Tertiary Markets Active LS Markets were stable with average gross, projected IRR's in the 12% to 14% range on completed transactions. There were interesting developments in the tertiary market where several larger portfolios were offered including one with over 100 policies. There was some indication that the sellers were motivated and that at least some of the portfolios were of good quality, which is a marked difference from most of the past two years where tertiary trades were mostly the undesired policies to be avoided at all costs. The Life Settlement news magazine "The Deal" reported encouraging developments in the fight to prevent insurance companies from competing with Life Settlements by offering special "enhanced cash surrender offers" which may violate insurance laws in at least some States, in part because the offers may favour some policy holders over others. The issue was raised and discussed at a recent meeting of the National Association of Insurance Commissioners with several States having already fined some carriers for such offers and other States starting to review their own legal and regulatory framework and how it applies to this relatively recent development. It appears to be another example of insurance companies trying to make life difficult for the Life Settlement industry with limited success, probably due to quality legal representation and lobbying of the LS industry and the fact that each policy holder has a vote. Written By Tony Bremness Funds operated by this manager: |

10 Mar 2022 - How to Handle the Current Falling Market
|
How to Handle the Current Falling Market Wealthlander Active Investment Specialist February 2022
Some investors have asked us how to handle a falling market as many of their investments are losing a lot of money. Here is a summary list of our suggestions about what can be done to stop the unnecessary pain, and adapt portfolios to the new environment. 1. Recognise the Game has Changed Inflation hurts the poor and the middle class who make up the majority of US voters. A significant majority of US voters don't own much in the way of anything that benefits from price increases and haven't benefitted meaningfully from historic asset price inflation. Hence a heavily politicised FED may be forced politically to prioritise fighting inflation ahead of boosting investment markets. They do this by reducing stimulus and raising interest rates. Unfortunately for investors, fighting inflation through reducing balance sheet expansion and raising interest rates only works by crushing demand first. This means economic demand and demand for equities need to get crushed as a necessary precondition to central banks effectively fighting inflation, if they attempt to do so. We might think of this as a policy mistake or a central bank choice, as other measures of fighting inflation (such as addressing supply and labour force issues) are better than anything central banks can do - but it is what it is and comes attendant potentially dramatic effects on mainstream markets. Effectively, one needs to acknowledge the investment cycle, as we highlighted in our article in early January "Four Ways to Massively Improve Performance in 2022: https://www.livewiremarkets.com/wires/four-ways-to-massively-improve-performance-in-2022 By recognising that the game has changed, investors can pivot their portfolio approach from what has worked in a bull market driven by disinflation and interest rates moving to 0, to what works better in a bear market caused by inflation, higher interest rates and reduced stimulus and demand (as massive stimulus packages are withdrawn and inflation bites into real wages growth). The first thing that astute investors can and are doing is reduce the risk of losing money by selling or reducing assets that don't work outside a bull market, and which are at risk of building larger losses. Importantly, it is not losing small amounts but losing large losses in bear markets that destroy investors' long term geometric returns. By way of illustration of this, if you lose 33% you need a massive 50% gain to get back to even; lose 50% and you need 100% gain just to stay still. Furthermore, the journey of the investor is far from pleasant when you are in large losing territory much of the time. Far better not to lose the 33% or 50% in the first place as there is no good cure, but only prevention. 2. Take Advantage of Volatility The assets which are better suited to rising inflation and interest rates include numerous alternatives. These alternatives include skill dependent rather than market dependent managers, market neutral and long short funds, volatility funds, insurance strategies, some CTAs, commodities such as oil and gold, and small subsets of the equity and property market such as shorter duration equities including resources, farmland and water. You probably don't own much of these currently and hence aren't protecting capital from losses as well as you could be in early 2022. The asset classes don't have the marketing and media budgets of the mainstream approaches so you probably don't know as much about them. Importantly, these assets are less likely to lose large amounts over an inflationary period compared with the financial assets mentioned previously. Not losing much in tough periods is the name of the game for long term returns and compounding, as well as the more risk averse. By potentially making money or not losing as much, the assets and strategies mentioned are far better suited to protecting capital and enabling long term compounding of your wealth, and particularly so compared with financial assets which are being meaningfully devalued. Furthermore, they offer a way of crystallising and cashing in strong equity and property gains of the last few years permanently, while still offering growth potential in the future. 3. Take Advantage of Volatility 4. Emphasize Better Value Niche Assets In summaryThere is much you can do not to be a deer in the headlights. Inflationary periods haven't been seen for a long time and most investors need to learn how to adapt to this different environment while it lasts. The ostrich approach with a portfolio suited to an entirely different economic regime doesn't work well when inflation is here. If you're losing large money, it's probably because your portfolio is poorly diversified and extrapolating history that is no longer with us, rather than being adapted to the times. It is far more prudent in current circumstances to adapt to the new investment environment, and buy a broader mix of assets that provide diversification and resilience. This includes a wide range of alternatives, managers that can take advantage of volatility, and better value niche assets. True diversification is the only free lunch in town right now and there is a delicious smorgasbord on offer to choose from. Venison and ostrich is missing from the menu. Funds operated by this manager: WealthLander Diversified Alternative Fund DISCLAIMER: This Article is for informational purposes only. It does not constitute investment or financial advice nor an offer to acquire a financial product. Before acting on any information contained in this Article, each person should obtain independent taxation, financial and legal advice relating to this information and consider it carefully before making any decision or recommendation. To the extent this Article does contain advice, in preparing any such advice in this Article, we have not taken into account any particular person's objectives, financial situation or needs. Furthermore, you may not rely on this message as advice unless subsequently confirmed by letter signed by an authorised representative of WealthLander Pty Ltd (WealthLander). You should, before acting on this information, consider the appropriateness of this information having regard to your personal objectives, financial situation or needs. We recommend you obtain financial advice specific to your situation before making any financial investment or insurance decision. WealthLander makes no representation or warranty as to whether the information is accurate, complete or up-to-date. To the extent permitted by law, we accept no responsibility for any misstatements or omissions, negligent or otherwise, and do not guarantee the integrity of the Article (or any attachments). All opinions and views expressed constitute judgment as of the date of writing and may change at any time without notice and without obligation. WealthLander Pty Ltd is a Corporate Authorised Representative (CAR Number 001285158) of Boutique Capital Pty Ltd ACN 621 697 621 AFSL No.508011. |

9 Mar 2022 - The question is, when should you invest?
|
The question is, when should you invest? Insync Fund Managers February 2022 Why we don't try to predict macro-market changes. We don't need to, no investor does. It is well established that the total returns of a stock follow the earnings growth of a business in the long term. Companies that can sustainably grow their earnings at a high rate over the long term are called compounders. Investing in a portfolio of compounders is one of the best ways to generate wealth for longer-term oriented investors that beat market averages. A major benefit of compounders is that market timing is rarely an issue, hence risk is also reduced. Our industry spends an inordinate amount of time trying to predict or forecast the future of markets. Sophisticated soothsaying by in-large. The probability of getting this right on a consistent basis is very low. Many espouse otherwise but a check of their historical records on predictions are quite revealing. Consider this:
What about the worst 20? It is also valid that avoiding the worst 20 days would have boosted your return beyond the fully invested 7.5% annualised return. The best and worst return periods show that extreme events have a large bearing on investor returns. Based on volatility around extreme events (and their mostly unpredictable appearances), it is impossible to predict the worst and best days. Indexing cannot filter in/out the extremes. If only those sophisticated 'crystal balls' in the hands of commentators and fund managers actually worked! Insync's "active" basket of 28 compounder stocks, carefully constructed to control the risk, delivers outperformance over passive benchmarks, over both full and multiple investment cycles, and does so without having to predict extreme events. Fastest decline in history. The Covid-19 pandemic clearly demonstrates the folly of an approach based on prediction. It created the fastest stock market decline in history catching out investors who believed prediction works. Let's say however, you were right and got out in time. Next and without warning, the fastest recovery in history then occurred. Unless you were in the market you missed out in a big way.
Predictions require constant and correct timing decisions. Stay in or out? If out, when? Then to where? And for how long? Thus, multiple questions need to be answered just for each event. Now, repeat over the life of your investment hundreds of times. No person or organisation has successfully got these answers sustainably right to produce great enduring outcomes. Market timing strategies also cannot benefit from the compounders. This is because timing tends to interrupt the powerful process of the conversion of earnings into price appreciation. Insync's focus on investing in compounders means we don't need to concern ourselves with the low hit-rate strategy of market timing stocks we hold. This is just one way we lower risk to our investors yet retain above average returns over time that endure. Examples of compounders
Funds operated by this manager: Insync Global Capital Aware Fund, Insync Global Quality Equity Fund |


 Roger Montgomery (01:44):
 Roger Montgomery (03:29):
 Roger Montgomery (04:20):
 Roger Montgomery (07:42):
 If you look at this chart here, you can see that supply deliveries and backlog of orders are actually starting to decline already. Sure, there's still supply chain problems. They're not going to disappear overnight. But at the margin, we're seeing the overall strain in the supply chain start to ease as this chart demonstrates.
 Roger Montgomery (12:28):
 Roger Montgomery (13:10):
 Roger Montgomery (14:00):


