
News

Performance Report: Seed Funds Management Financial Income Fund
The Seed Funds Management Financial Income Fund rose by +5.66% over the past 12 months, an outperformance of +1.53% compared with the Solactive Australian Hybrid Securities (Net) benchmark which has returned by +4.13%
Read more...

I Went to China's Robotics Hub - What I Saw Changed My View on the U.S. vs...
For years, the debate around autonomous vehicles has been framed incorrectly. The question has been: when will AI fully replace the human driver? But the real story is far more profound and far more investable. (4-minute read)
Read more...

Performance Report: Airlie Australian Share Fund
The Airlie Australian Share Fund has delivered positive returns 92% of the time since its inception in June 2018, in months when the market was positive.
Read more...

Performance Report: Quay Global Real Estate Fund (Unhedged)
The Quay Global Real Estate Fund (Unhedged) returned +5.24% per annum since its inception in January 2016, an outperformance of +1.36% relative to the FTSE EPRA/ NAREIT Developed NET TR benchmark, which has returned +3.88% on an annualised...
Read more...

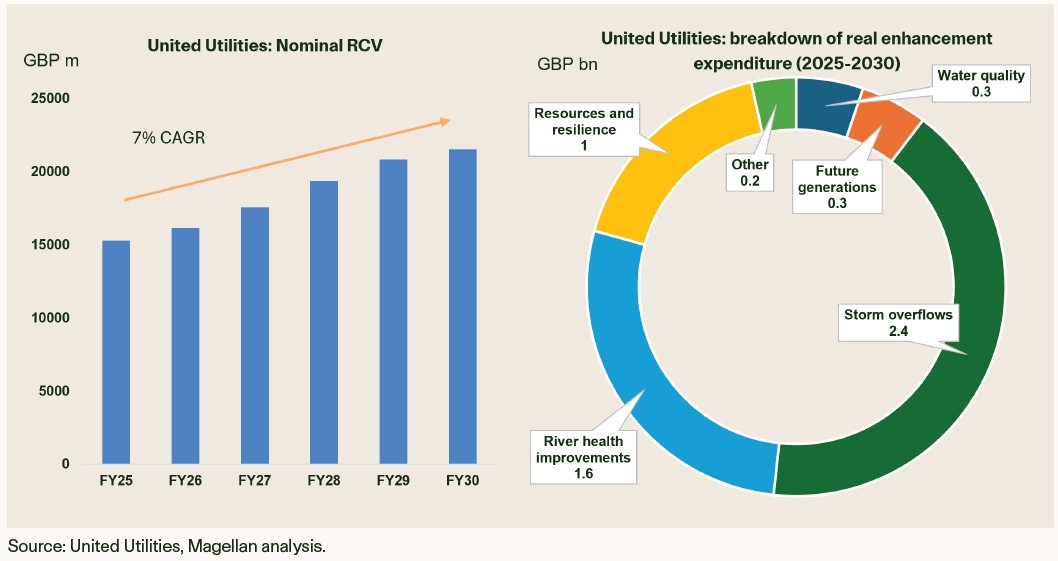
Infrastructure in focus: Turning on the capex tap
Many investors are well-versed in the growth story for data centres, with the rapid building of these assets a focal point in markets and the media. What is perhaps not appreciated is the large-scale capital investment outlook beyond...
Read more...

Hedge Clippings |10 April 2026
The war in the Middle East may have dominated markets, but we will leave the rights and wrongs of that to others. What cannot be ignored, however, is the war's impact on markets.
Read more...

Performance Report: Bennelong Australian Equities Fund
The Bennelong Australian Equities Fund has delivered positive returns 89% of the time since inception in February 2009, in months when the market was positive.
Read more...

Performance Report: 4D Global Infrastructure Fund (Unhedged)
The 4D Global Infrastructure Fund (Unhedged) rose by +20.53% over the past 12 months, outperforming the S&P Global Infrastructure TR (AUD) benchmark by +6.23%, which has returned +14.30%.
Read more...

What Goldman Sachs teaches about risk
If you ever need proof a billion-dollar net worth won't solve all your problems, take it from the man who made that kind of cash from nothing. More on that in a minute. (5-minute read)
Read more...

Phil Strano: Staying the course in credit
Geopolitical shocks and a sharp repricing of rates have driven bond yields materially higher. While volatility has increased, Phil Strano (Head of Australian Credit Research) believes resilient credit markets and elevated income levels are...
Read more...