News

12 Apr 2022 - The Rate Debate - Episode 26
|
The Rate Debate - Episode 26 Yarra Capital Management 06 April 2022 How high and how fast can rates go? The RBA expects to see economic data that will drive them to hike interest rates earlier than expected. Markets have already jumped the gun and priced future hikes into bond prices. Is the economy as strong as central banks believe, and will interest rates go up as aggressively as the market suggests? Tune in to hear Darren and Chris discuss this in episode 26 of The Rate Debate. |
|
Funds operated by this manager: Yarra Australian Equities Fund, Yarra Emerging Leaders Fund, Yarra Enhanced Income Fund, Yarra Income Plus Fund |

11 Apr 2022 - Global stocks provide clues to accelerating inflation
|
Global stocks provide clues to accelerating inflation Janus Henderson Investors April 2022 Key Takeaways
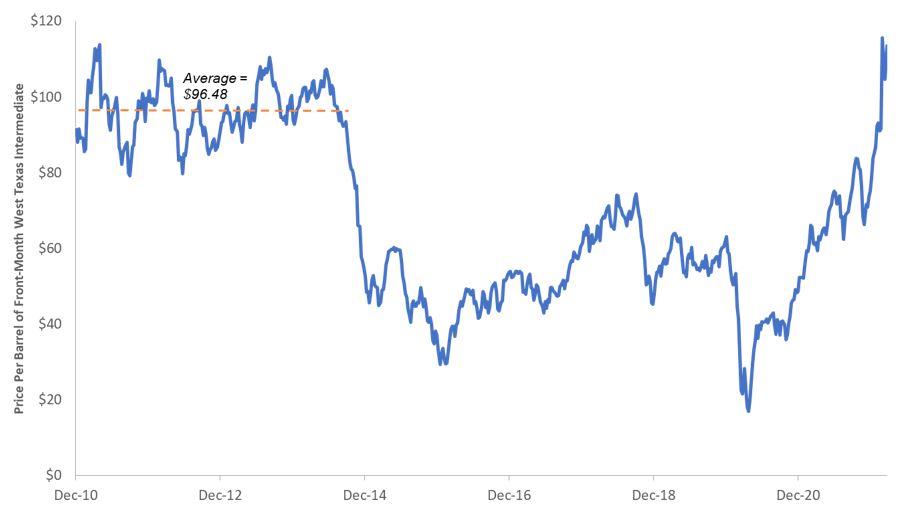
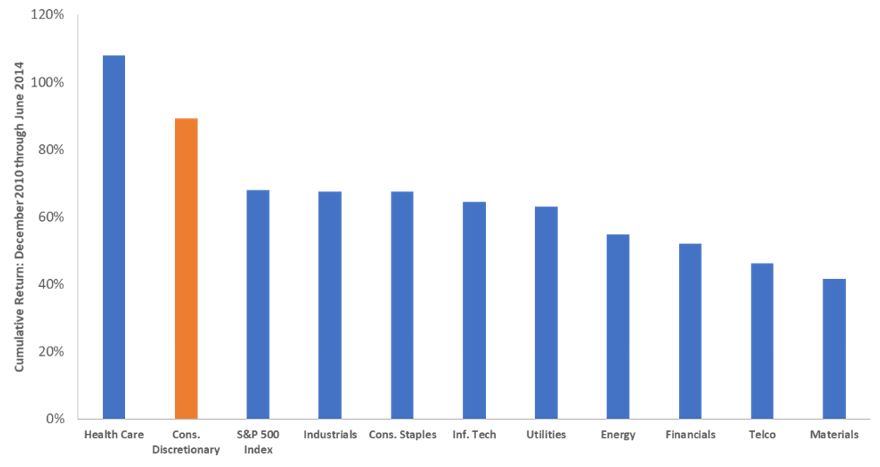
Accelerating inflation has rightly caught the attention of policy makers and investors alike. Expectations that rising prices would cool during the latter half of 2021 proved misplaced as annual US inflation, as measured by the Consumer Price Index, rose 7.9% in February. The core reading, which strips out volatile food and energy, climbed 6.4%. Both are multi-decade highs. The risk that a rapid rise in prices poses to the US - and global - economy is perhaps best illustrated by how quickly the Federal Reserve (Fed) has pivoted toward overtly hawkish policy, with the US central bank now forecasting the equivalent of seven 25 basis point (bps) rate hikes this year. The blunt instrument of higher policy rates is not the only factor that gets a vote in the future trajectory of prices. An economic maxim is 'the cure for higher prices is higher prices'. In more conventional parlance, economists refer to this phenomenon as demand destruction, the notion that prices can rise by such a degree that consumer behaviour is altered, thus removing a catalyst for any additional step up in inflation. A contemporaneous Google search will show that demand destruction is top of mind for market participants these days, especially with respect to the jarring rise in energy prices. An anecdotal gauge for measuring the potential for demand destruction is signals from equity markets. Not only do investors vote with their sell orders on sectors that may be at risk of slowing earnings growth, but also some management teams revise forward guidance based on their expectations for customers' tolerance of higher prices. What are these signals presently telling us about the possibility of pinched consumers cutting back on purchases? They have not reached that point - yet. While acknowledging that inflation has already entered consumers' psyches, several factors lead us to believe that prices still have some room to run before shoppers' behaviour is altered to the degree that it itself becomes a headwind to growth. Household balance sheets remain strong, and historical precedent indicates that current prices at the pump and other rapidly rising costs can be tolerated - albeit begrudgingly - by consumers. Still, the degree to which prices have risen and the fact that two-thirds of US economic activity is based on consumption means the situation merits monitoring, especially given the glaring inaccuracy of recent inflation forecasts. Make up your mindConventional wisdom was that early 2021 inflationary pressure was due to the low base effects of 2020 lockdowns and would eventually roll off. More recently, the pandemic has also been cited as the cause of inflation due to supply disruptions in key industrial inputs - among them semiconductors and labour. Possibly hoping to be forgotten by policymakers has been the material effects of $4.8 trillion of liquidity that the Fed has injected into the economy since the onset of the pandemic. While extraordinary support was merited during the depth of economic lockdowns, we were concerned that the magnitude of this stimulus would result in the unintended consequence of inflation and that the lagging nature - typically over a year - of these initiatives would mean attempts to rein in accelerating prices would prove a day late and more than a dollar short. All these inflationary ingredients were present even before Russia's incursion into Ukraine sent prices on certain energy and materials products on a near vertical trajectory. Regardless of the cause, elevated inflation is here, and it is up to equities investors to figure out how to navigate this environment. Coincidentally, data on both the sector and individual company level can provide important clues about how inflation is evolving and how consumers are reacting to these developments. A likely suspectEnergy prices' contribution to inflation cannot be ignored. They rose 25.6% compared to February 2021 and are a main driver of overall inflationary pressure. How much more consumers can bear elevated energy costs depends upon both their duration and the degree to which they keep climbing. With respect to duration, the absence of Russian products in global markets does not bode well. When reviewing company-level plans for capital expenditure, there are virtually no short-cycle projects that can be quickly brought online to meet existing demand. Consumers have weathered worse without being compelled to alter consumption patterns. Energy consumption in the US tends to be inelastic, meaning consumers are relatively insensitive to rising prices. Between 2011 and the July 2014, crude as measured by West Texas Intermediate, averaged nearly $100 per barrel. If consumers had felt the need to compensate for higher gasoline prices by scrimping elsewhere, the most likely target would have been discretionary purchases. Yet during this period, the consumer discretionary sector outperformed the broader S&P 500® Index and was the stock market's second-best-performing sector. Price per barrel of West Texas Intermediate Crude
Source: Bloomberg, as of 25 March 2022. Cumulative total return by S&P 500 sector: January 2011-June 2014
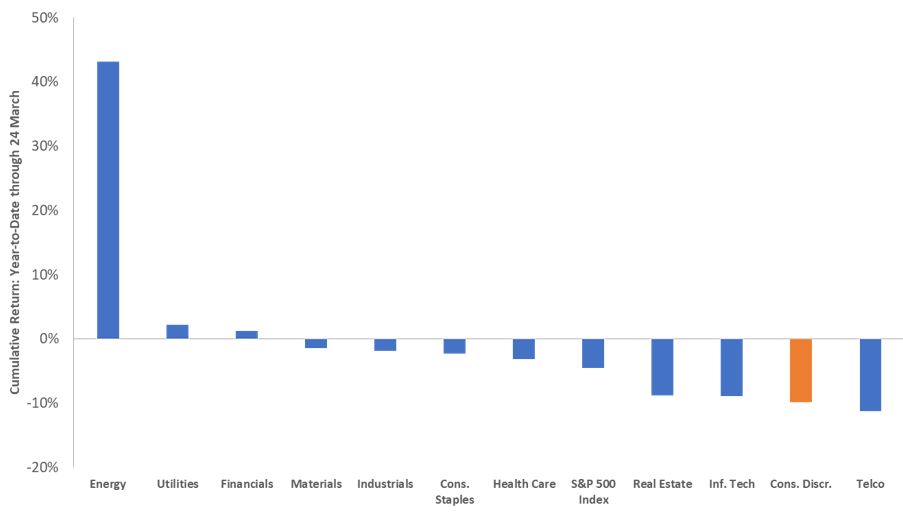
Cumulative total return by S&P 500 sector: year-to-date 2022
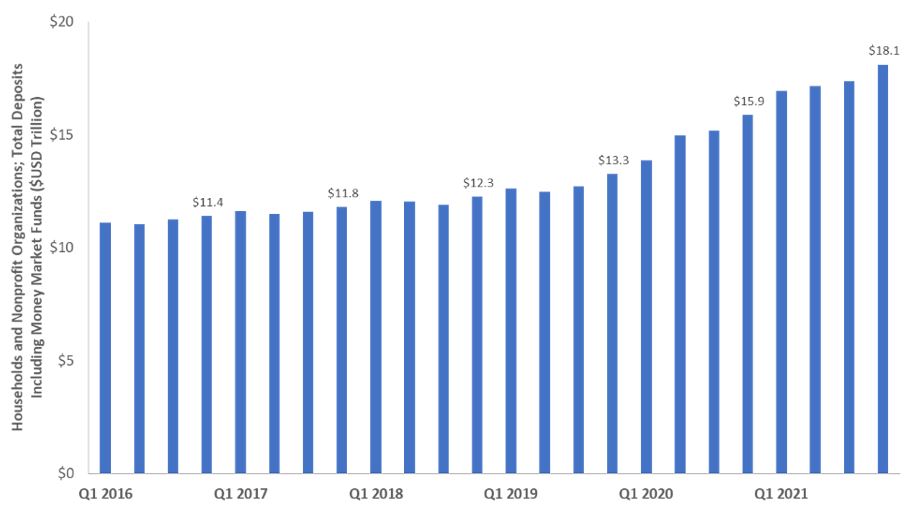
Although the ultimate duration of this period of elevated energy prices remains unknown, prices for crude and refined products are lower than the 2011-2014 period in real (inflation-adjusted) terms. Looking forward, there is no magic number as to when demand destruction kicks in. Often mentioned are $150 per barrel of crude and a $5.00 national average at the pump. The reality is, however, that prices are drifting higher and at some point, consumers may be forced to prioritise expenditures. Exacerbating the situation is that lower-income households will be most acutely affected by sustained higher energy prices as a greater percentage of their monthly outlays are allocated toward energy. A similar dynamic is facing emerging market consumers. In Europe, households and businesses are receiving a secondary gut punch in the form of higher utility costs given their greater reliance upon Russian energy exports. The takeaway for investors is that discretionary sectors that cater to these cohorts may be most exposed to forced changes in consumer behaviour. In a sign that energy demand remains steady, the margins - or cracks - for refiners between their crude input costs and the revenues derived from end products have thus far held up. Should demand falter, we would expect to see refiner margins narrow. Rainy day fundsAnother factor that leads us to believe that the economy is not yet at risk of seeing a curtailment in consumption is the robust health of household finances. Although consumers' monthly savings rates have recently slid as the most generous period of fiscal stimulus is behind us, the cumulative effects of these extraordinary programs have left consumer balance sheets at historic levels. As of the fourth quarter 2021, cumulative household savings have reached a record $18 trillion. This cushion has, thus far, enabled households to weather the current bout of inflation. Household and nonprofits' savings
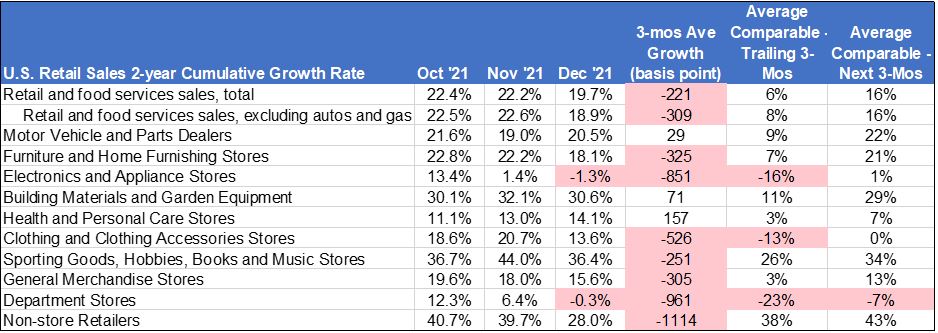
An indicator that peak stimulus has passed is the recent deceleration of retail sales in an array of categories. To compensate for the upheaval caused by pandemic-related shutdowns, we looked at two-year growth rates to gauge which segments have experienced the most deceleration. As of December, this rate for retail sales ex automobiles and gasoline was 18.9%, well below November's 22.6%. There is some noise in these data, as holiday purchases were likely pulled forward to the October/November period, thus meaning the post-holiday figures may have only fallen back to longer-term trends. Furthermore, there are only so many things consumers can buy, and we are not alone in believing that at some point, purchases will shift from the goods that buoyed retail over the past two years toward services such as travel and entertainment. Any potential dip in sales of goods over the next few months may reflect, in part, this transition rather than solely alarmed consumers snapping their wallets shut. Two-year US retail sales growth rates
Still, some retail data points flash signs of caution. Deceleration has been particularly notable in department stores, electronics and appliance stores and non-store retailers. The path does not appear any easier as the hurdle - as measured by two-year comparables - for upcoming months is considerably higher across many retail segments in contrast to those of last autumn. A canary in the coal mineTo-be-determined is whether the sequential slowdown in these categories is the result of pulled-forward purchases or inflation beginning to bite. Should the latter be what's unfolding, one would expect consumers to first cut back on nonessential purchases. And this is largely how the market is interpreting it. Year-to-date, through March 24, the consumer discretionary sector has returned -9.8%, well below the -6.0% of the S&P 500 Index. Yet, we believe it is too early to draw firm conclusions that lower prospects for discretionary stocks are directly tied to rising inflation. Other contributing factors are also likely at play. Entering the year, the sector's forward price-earnings (P/E) ratio sat well above its long-term average and was exposed to the risk of multiple compression in the face of rising interest rates (its full-year P/E ratio fell by as much as 24% before slightly rebounding). Also, categories that include goods might see earnings and multiple pressure, although that may be offset, to a degree, by strength in experiences-related sectors. The takeaway for investors is that a cocktail of inflation, rising rates and multiple compression represents a risk to consumer-related stocks - and equities markets more broadly - until the ultimate cadence and ending point of monetary tightening are established. As previously stated, in the 2011 through mid-2014 period of high oil prices, consumer discretionary was the second-best-performing sector. There have been periods of inflation-induced demand destruction, namely the late 1970s and the years preceding the Global Financial Crisis, but notably, consumers' finances were nowhere near as healthy as they are at present and the US economy was substantially more energy intensive, meaning consumers and businesses were much more vulnerable to an uptick in oil prices. Based on our conversations with management teams, we have been able to tease out some potential risks and opportunities within the retail sector, should inflation remain elevated. Given the ability of higher-income consumers to absorb elevated food and energy prices, we believe that companies catering to this market segment are better positioned to sustain margins. The same holds true for companies with pricing power, meaning they can pass along higher input costs to customers. We are more circumspect on companies exposed to low-end wage inflation. Physical retailers already face staffing challenges, and absent any meaningful growth in the labour force, we foresee the bidding war for workers to continue. Part and parcel with stimulus checks is the pulling forward of certain purchases. Retailers focusing on durable goods such as appliances, as well as other home-centric categories, may be vulnerable to revenue air pockets caused by this phenomenon. Lastly, higher transportation costs have the potential to exacerbate lingering supply chain disruptions as retailers have come to rely upon higher priced alternatives - such as air freight - to get products to market. Should this trend continue, current estimates for discretionary sector operating margins could prove too optimistic. Looking forwardNearly 8% headline inflation has forced the Fed to react. Given the delayed effect of rate hikes - along with still very low levels - the point at which tighter policy begins to constrict growth is likely some ways off. Yet the tempering effects of demand destruction likely remain relatively farther on the horizon as well. An unprecedentedly level of consumer savings will likely enable households to tolerate a relatively extended period of higher prices. The question is how long will this stand. Supply disruptions, wage pressures, fiscal largesse and commodities upheaval have all contributed to the inflationary backdrop. Corralling these forces stands to be tall task and investors should be prepared for how a sustained period of elevated prices will reverberate through equity markets. Consumer Price Index (CPI) is an unmanaged index representing the rate of inflation of the U.S. consumer prices as determined by the U.S. Department of Labor Statistics.
This information is issued by Janus Henderson Investors (Australia) Institutional Funds Management Limited ABN 16 165 119 531, AFSL 444266 (Janus Henderson). The funds referred to within are issued by Janus Henderson Investors (Australia) Funds Management Limited ABN 43 164 177 244, AFSL 444268. The value of an investment and the income from it can fall as well as rise and you may not get back the amount originally invested. Past performance is not indicative of future performance. Prospective investors should not rely on this information and should make their own enquiries and evaluations they consider to be appropriate to determine the suitability of any investment (including regarding their investment objectives, financial situation, and particular needs) and should seek all necessary financial, legal, tax and investment advice. This information is not intended to be nor should it be construed as advice. This information is not a recommendation to sell or purchase any investment. This information does not purport to be a comprehensive statement or description of any markets or securities referred to within. Any references to individual securities do not constitute a securities recommendation. This information does not form part of any contract for the sale or purchase of any investment. Any investment application will be made solely on the basis of the information contained in the relevant fund's PDS (including all relevant covering documents), which may contain investment restrictions. This information is intended as a summary only and (if applicable) potential investors must read the relevant fund's PDS before investing available at www.janushenderson.com/australia. Target Market Determinations for funds issued by Janus Henderson Investors (Australia) Funds Management Limited are available here: www.janushenderson.com/TMD. Whilst Janus Henderson believe that the information is correct at the date of this document, no warranty or representation is given to this effect and no responsibility can be accepted by Janus Henderson to any end users for any action taken on the basis of this information. All opinions and estimates in this information are subject to change without notice and are the views of the author at the time of publication. Janus Henderson is not under any obligation to update this information to the extent that it is or becomes out of date or incorrect. |
|
Funds operated by this manager: Janus Henderson Australian Fixed Interest Fund, Janus Henderson Australian Fixed Interest Fund - Institutional, Janus Henderson Cash Fund - Institutional, Janus Henderson Conservative Fixed Interest Fund, Janus Henderson Conservative Fixed Interest Fund - Institutional, Janus Henderson Diversified Credit Fund, Janus Henderson Global Equity Income Fund, Janus Henderson Global Multi-Strategy Fund, Janus Henderson Global Natural Resources Fund, Janus Henderson Tactical Income Fund |

8 Apr 2022 - The French presidential election
|
The French presidential election abrdn April 2022 It's election time in France, as the nation heads to the polls on 10 April. There will then be a runoff between the top two candidates on 24 April. So, how do we think the election will play out? And what could it mean for investors? A quick recap Unlike other European states, the French president is the main figure in the nation's political system. He/she holds executive and legislative powers, including the appointment of a prime minister that reflects the parliamentary majority. The president therefore drives the policymaking agenda. He/she is also the head of national defence and diplomacy. Where do we stand? Ahead of April's vote, President Macron enjoyed a comfortable lead in both the first- and second-round polls. His handling of the Russia-Ukraine crisis has bolstered his standing in the eyes of many voters. Further, the 2022 elections are taking place against a very different economic and political backdrop than previous campaigns. France has experienced one of the strongest recoveries from the Covid-19 pandemic and is no longer regarded as one of the 'sick men' of Europe. Angela Merkel's retirement has left Macron as Europe's senior statesperson. As a result, he enjoys stronger support at this stage of the campaign than his two predecessors. Nonetheless, support for populist candidates is once again robust. Veteran far-right leader Marine Le Pen remains Macron's main challenger. Her Euroscepticism has moderated since 2017 as she attempts to appeal to the political centre. Le Pen's tone is less incendiary than in previous campaigns. Meanwhile, higher inflation is eroding workers' purchasing power. She and others are evoking the spectre of 'green inflation' to scare-up votes. This is putting the efficacy of France's climate strategy at the heart of the electoral debate. That said, the political spectrum is more fragmented than ever. The candidacy of Eric Zemmour could potentially fracture the far-right vote. As a candidate, he combines controversial stances on immigration with liberal (but vague) economic policies. Unlike Le Pen, he seems to recognise the unsustainability of the French pension system. At the same time, he is even keener to pick a fight with the EU on legal sovereignty. At the opposite end of the political spectrum, Jean-Luc Mélenchon represents a different type of economic danger. As an avowed socialist, he wants to increase tax on overtime work, raise marginal tax rates and re-regulate labour markets. Each of these would undermine progress to improve the competitiveness of the French economy. Nonetheless, Mélenchon's campaign has picked up considerable momentum in recent weeks. The result - a market perspective In the event France elects a far-right candidate, assets would likely come under pressure. We would expect to see a widening of French sovereign bond spreads and underperformance of domestically-oriented French equity and credit securities. However, given populists' retreat from hardline Eurosceptic views, the fallout would likely be less extreme than if it had occurred in 2017, or what we saw after the 2018 Italian elections. The largest risk is less the outright victory of an extreme candidate, but rather a more fragmented parliament following regional elections in June. A second-term centrist government is likely to have to compromise with parties of both the left and right over economic, energy, and European policy. This has the potential to lead to policy stasis. By contrast, markets would welcome the re-election of Macron. His victory would imply policy continuity and further progress on the reform agenda. We could possibly see further EU integration and a renewed attempt to tackle pension reforms. Further, Macron is an advocate for more investment in green and nuclear technologies. However, he will be wary of raising fuel or carbon taxes for fear of reviving the Gilets Jaunes movement. Pension reform will be the hardest issue to tackle. Macron wants to increase the retirement age from 62 to 65. Many will find that hard to swallow. It could also revive the social tensions that plagued the first years of his presidency. The largest risk is less the outright win of an extreme candidate, but rather a more fragmented parliament following regional elections in June. Who will win? At the time of writing, Macron remained in the driving seat. By our numbers, he will likely face Le Pen in the second round of voting, despite Mélenchon's recent surge. Thereafter, we expect Macron will retain the presidency, albeit on a tighter margin than we thought a month ago. Indeed, two polls published on 28 March showed Le Pen narrowing the gap by three points. If they faced each other in the final round, an Ifop-Fiducial group indicated Macron would win by just 53% versus Len Pen's 47%. One potential risk to this scenario is historically low voter turnout following a race overshadowed by the Russia-Ukraine crisis. That said, there's little consensus as to which candidates would suffer most from more voters staying at home. All in all, it promises to be an interesting week ahead. We'll bring you our latest analysis once the final votes are counted. Author: Alexandra Popa, Macro ESG Research, Abrdn Research Institute |
|
Funds operated by this manager: Aberdeen Standard Actively Hedged International Equities Fund, Aberdeen Standard Asian Opportunities Fund, Aberdeen Standard Australian Small Companies Fund, Aberdeen Standard Emerging Opportunities Fund, Aberdeen Standard Ex-20 Australian Equities Fund (Class A), Aberdeen Standard Focused Sustainable Australian Equity Fund, Aberdeen Standard Fully Hedged International Equities Fund, Aberdeen Standard Global Absolute Return Strategies Fund, Aberdeen Standard Global Corporate Bond Fund, Aberdeen Standard International Equity Fund , Aberdeen Standard Life Absolute Return Global Bond Strategies Fund, Aberdeen Standard Multi Asset Real Return Fund, Aberdeen Standard Multi-Asset Income Fund |

7 Apr 2022 - The Rise of the Contactless Economy
|
The Rise of the Contactless Economy Insync Fund Managers March 2022 Fingertip readers and facial recognition used to be something we only saw in Hollywood movies, now they are staples in our economy. The way we purchase has dramatically adjusted to the new normal. Covid-19 has created an unprecedented global change in how we pay for things. There has been a profound and permanent change in behaviour in Australia and many parts of the world. Payment apps are easy to use, they offer improved security and the work from home offers balance, since Covid means more time to browse from home via laptops and phones.
Insync's Portfolio Manager, John Lobb tells us more on the The Rise of the Contactless Economy Megatrend: Funds operated by this manager: Insync Global Capital Aware Fund, Insync Global Quality Equity Fund |

7 Apr 2022 - Anna Hong: Debt, disruption and demographics determine where bonds go next
|
Anna Hong: Debt, disruption and demographics determine where bonds go next Pendal 25 March 2022 |
|
AUSTRALIAN 10-year bonds yields are at a four-year high. Where will they go from here? To answer that we need to ask another question: what level of interest rates can the Australian economy withstand? We think a neutral cash rate of 1.5% to 2% is bearable. But 3% will be an overshoot that strains the Australian economy. Under those conditions, the Australian Government 10-year bond yield becomes interesting at current levels around 2.75%. Why? Because the global trajectory of three key factors — debt, disruption and demographics — hasn't changed despite recent events, especially in developed economies. DemographicsEven though headline population growth is positive, it's largely driven by net migration which has been impacted by Covid. Australia's fertility rate is below the replacement rate and life expectancy is on the rise. This means we have an ageing population. Adding higher interest rates to that mix will significantly impact GDP growth.
Disruption Technology has transformed every facet of our lives and it's not about to stop. With continued technological progress we can expect goods prices to move downwards as we reap the rewards of manufacturing and logistical efficiencies. (Once the current supply-shock eases of course.) This means that while inflation is a now-problem, it will not be a long-run issue which central banks need to tackle with never-ending rate hikes. DebtFinally, consider the debt overhang. As a nation we continue to indulge in our favourite activity - buying property. The Australian household debt picture is nuanced, however. We're one of the most indebted nations in the world, but we're also rather good at things like pre-payment, so we can get ahead of the debt mountain. This pragmatism will lead to many households tweaking spending decisions as interest rates rise. At a time when disposable income has already been hit by oil prices, the RBA will be cautious about adding further strain. The dynamics of Debt, Disruption, Demographics means that the most probable outcome is a neutral cash rate of around 2%. Rates higher than that will lead to curtailing of GDP growth, straining the Australian economy. This may be welcomed in restraining inflation in the near-term but not in the medium-term. Portfolio ImplicationsWith current Australian Government (ACGB) 10-year bond yields at 2.75%, aggressive rate hikes are almost fully priced in. Cash sitting on the sidelines will find value here as the Reserve Bank continues to delay rate hikes. Economists' consensus has the first hike occurring in August — therefore investors may need to wait until late 2023 for cash returns to exceed 1.5%. The risk versus reward makes this an attractive option for balanced portfolios. Bonds are still a defensive instrument, given forward uncertainties, especially in the geopolitical space. Investors will need them in their portfolios. Any investor currently underweight bonds should be looking to get back to neutral. We think the next three-to-six months may bring levels which are attractive for investors looking to go overweight bonds. Written By Anna Hong, Assistant Portfolio Manager |
|
Funds operated by this manager: Pendal Total Return Fund |
|
This information has been prepared by Pendal Fund Services Limited (PFSL) ABN 13 161 249 332, AFSL No 431426 and is current as at December 8, 2021. PFSL is the responsible entity and issuer of units in the Pendal Multi-Asset Target Return Fund (Fund) ARSN: 623 987 968. A product disclosure statement (PDS) is available for the Fund and can be obtained by calling 1300 346 821 or visiting www.pendalgroup.com. The Target Market Determination (TMD) for the Fund is available at www.pendalgroup.com/ddo. You should obtain and consider the PDS and the TMD before deciding whether to acquire, continue to hold or dispose of units in the Fund. An investment in the Fund or any of the funds referred to in this web page is subject to investment risk, including possible delays in repayment of withdrawal proceeds and loss of income and principal invested. This information is for general purposes only, should not be considered as a comprehensive statement on any matter and should not be relied upon as such. It has been prepared without taking into account any recipient's personal objectives, financial situation or needs. Because of this, recipients should, before acting on this information, consider its appropriateness having regard to their individual objectives, financial situation and needs. This information is not to be regarded as a securities recommendation. The information may contain material provided by third parties, is given in good faith and has been derived from sources believed to be accurate as at its issue date. While such material is published with necessary permission, and while all reasonable care has been taken to ensure that the information is complete and correct, to the maximum extent permitted by law neither PFSL nor any company in the Pendal group accepts any responsibility or liability for the accuracy or completeness of this information. Performance figures are calculated in accordance with the Financial Services Council (FSC) standards. Performance data (post-fee) assumes reinvestment of distributions and is calculated using exit prices, net of management costs. Performance data (pre-fee) is calculated by adding back management costs to the post-fee performance. Past performance is not a reliable indicator of future performance. Any projections are predictive only and should not be relied upon when making an investment decision or recommendation. Whilst we have used every effort to ensure that the assumptions on which the projections are based are reasonable, the projections may be based on incorrect assumptions or may not take into account known or unknown risks and uncertainties. The actual results may differ materially from these projections. For more information, please call Customer Relations on 1300 346 821 8am to 6pm (Sydney time) or visit our website www.pendalgroup.com |

6 Apr 2022 - Paragon - Quarterly Update & Outlook Webinar (1-Apr)
|
Webinar recording: Quarterly Update & Outlook Webinar (1-Apr)
|

6 Apr 2022 - Another era of quantitative tightening beckons
|
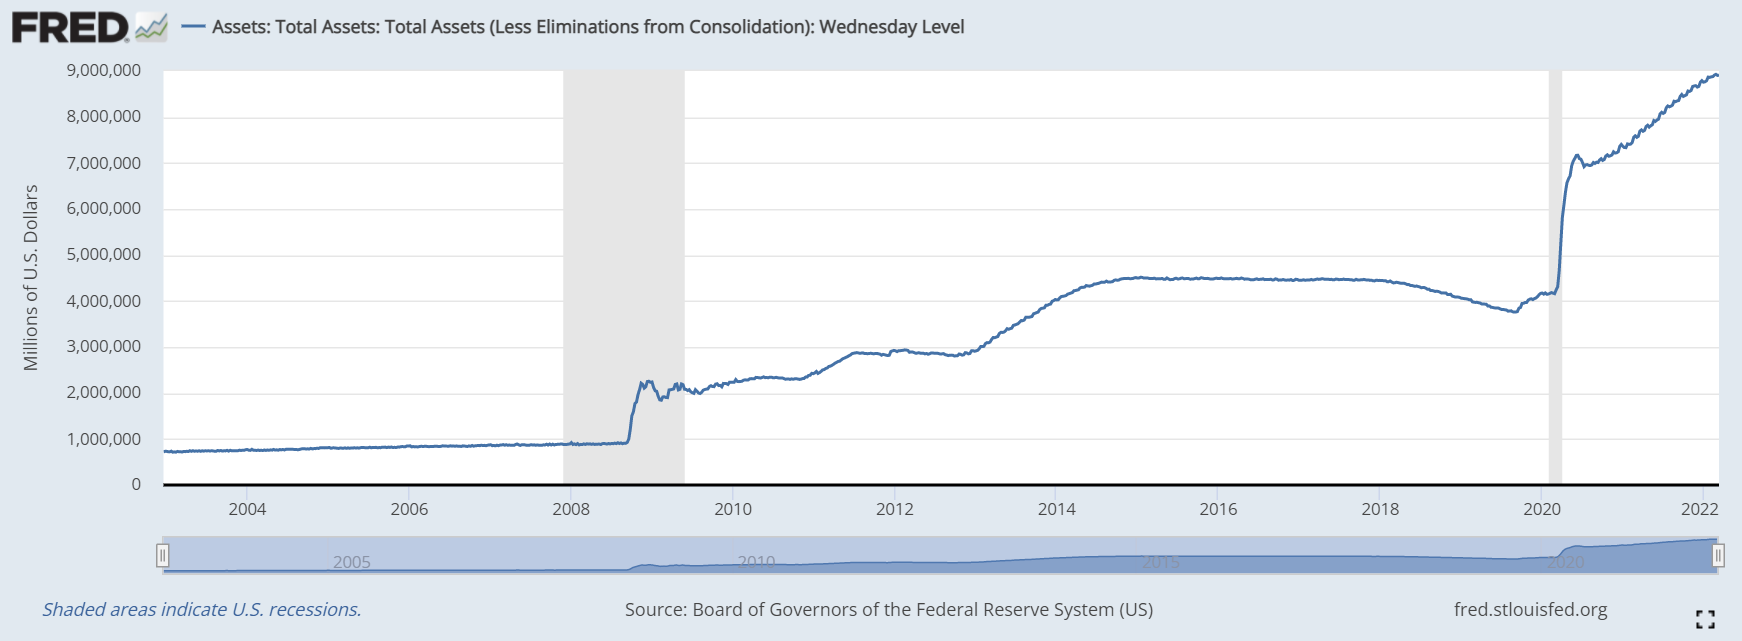
Another era of quantitative tightening beckons Magellan Asset Management March 2022 Hurricanes Harvey, Irma and Maria may have devastated parts of the US in 2017 but the Janet Yellen-led Federal Reserve was determined to persist with an unprecedented way to tighten monetary policy. The central bank in October that year commenced selling the assets on its balance sheet, to unwind eight years of on-and-off quantitative easing.[1] The 'taper tantrum' of 2013 showcased the risks. In that year, comments from the Ben Bernanke-led Fed that it would reduce its monthly asset purchases sparked financial turbulence. Such turbulence, the Fed backtracked. No tapering worthy of the name occurred and by 2015 another round of quantitative easing was underway.[2] Investors were thus wary of the quantitative tightening of 2017. What would happen when the Fed shrank a balance sheet that had swelled to US$4.4 trillion from US$900 billion in 2008? How would investors react when the Fed refrained from reinvesting as much as US$50 billion in bonds that matured every month, even if it was the most conversative approach to shrinking a balance sheet?[3] Some turbulence eventuated. But the 'balance sheet normalisation' went smoothly enough for a Fed led by Jerome Powell from February 2018. Until it didn't. On 16 September 2019, when the Fed balance sheet had contracted by about US$600 billion to US$3.8 trillion, strains in the repo market spilled into the money market and the secured overnight financing rate jumped from 2.43% to above 5%, an event the Fed described as "surprising". To provide enough liquidity to ensure short-term interest rates behaved, the Fed restarted asset purchases.[4] Investors nowadays might keep this episode in mind when the Fed restarts asset sales accompanied by at least one other major central bank. On January 26 this year, Powell announced the Fed would "in a predictable manner"[5] reduce its balance sheet that has swelled by US$4.5 trillion since the pandemic struck to US$8.9 trillion now.[6] Eight days afterwards, the Bank of England announced it would reduce "in a gradual and predictable manner" the 895 billion pounds worth of debt it has purchased since 2009.[7] To understand what might happen when the biggest buyers of debt become the biggest sellers, it helps to revisit what happens when central banks undertake quantitative easing. Under the non-conventional policy invented by the Bank of Japan in 2001, a central bank creates money (electronically) as an asset on its balance sheet and buys financial securities in the secondary market with interest-paying reserves. The purpose is to reduce long-term interest rates.[8] Quantitative tightening, as the name suggests, is the reverse process.[9] Once central banks 'destroy' money, long-term interest rates should be higher than otherwise. The first question to ask is: Why do central banks need to reduce their balance sheets? A valid answer is they have no need to. The bloated balance sheets are not causing financial instability, even if pumping them up came with side effects such as asset inflation and excessive risk-taking and is a culprit behind consumer inflation. But central banks are intent on shrinking their balance sheets. (The Bank of England in February started monthly sales of 20 billion pounds worth of corporate bonds.) Why? The main reason is that central bankers are worried that an overstuffed balance sheet could shake the financial system. At some level, the public might lose confidence in the value of their fiat money. Central banks fret that, if circumstances were to change, the market-based rate of interest they pay the holders of their reserves might not be attractive enough to stop these sums being lent out and inflation might accelerate. They worry too the policy option is, in Powell's words, "habit forming".[10] Powell, by this comment in 2012 when as a member of the policy-setting board he opposed Fed asset buying, meant it's another 'Fed put'. This is slang for the moral hazard whereby investors take more risk because they are confident the Fed, in a quest to protect the economy, will act to cut their losses. Another reason for quantitative tightening is political. Quantitative easing stirs charges that central banks make it easier and cheaper for governments to run fiscal deficits. Reversing the process would depower those accusations and reassert central-bank independence. One motivation for the Bank of England for selling assets appears to be that higher short-term interest rates could turn central bank profits into losses for government budgets.[11] If short-term rates rise enough, the interest central banks pay on their liabilities on their balance sheets will exceed the interest they earn on their assets. The bigger the balance sheet the bigger the losses.[12] It means too that a large balance sheet could restrict how high the Bank of England and others could raise key rates.The Fed would be aware of the political storm created if it were to become a loss-maker for Washington.[13] It's notable that the Fed and Bank of England talk of undertaking quantitative tightening in a "predictable manner". That's probably because so much surrounding the stance is unknown. No central bank has ever reversed its asset buying over the medium to long term.[14] The danger today is that central banks want to shrivel their balance sheets when they are raising their key rates to combat inflation. Whereas in 2018-2019, inflation was tame, the Fed now must contend with inflation at 7.9% in the 12 months to February, the highest since 1982. The Bank of England must suppress inflation at 5.5% over the 12 months to January, the highest in three decades. No one knows how high bond yields might rise as central banks raise their key rates and shrink balance sheets, especially if inflation accelerates further.[15] Nor does anyone know how high bond yields could rise without triggering the financial mayhem that occurs when investors anticipate a recession. But the bigger menace of quantitative tightening is that it might show the Fed is not serious about curbing the inflation it dismissed as "transitory" throughout 2021. Even though all US inflation gauges have exceeded Fed comfort levels for months, the Fed is buying assets until the end of March. A Fed that couldn't immediately end asset purchases when inflation first reached 5% mid-last year (for the 12 months to May) is unlikely to allow asset sales to destabilise markets.[16] It's likely that come trouble the Fed would cease asset sales or even resume asset buying - aka QT1. With the cash rate close to zero, quantitative easing is the best Fed put around. Don't be surprised if it resumes. To be sure, the pressure is mounting on the Fed to control inflation, especially as energy and food prices soar after Russia's invasion of Ukraine. But adjusting the key rate will be the means to curb price rises, not asset sales. A Fed balance sheet at double the size of 2018-2019 must be riskier to puncture without mishap - so even timid asset selling could stir trouble. The risks would increase if the Bank of Japan and the European Central Bank were to join the Bank of England and the Fed in shrinking their balance sheets. An inflation outbreak that required an abrupt tightening of monetary policy could escalate the risks of doing nothing about a swollen balance sheet. A recession that prompted more quantitative easing might make it harder to envisage that central banks would ever reduce their balance sheets to pre-2008 levels. Amid the uncertainty, best to frame the Fed's balance sheet as a tool to ensure today's asset bubbles don't burst. The longer-term problem, of course, is that one day the Fed put will be kaput. Investors might confront a hurricane. The kaput put On 19 October 1987, the US share market dropped on opening by about 10%, to follow a 5% decline the previous Friday. Fed chief Alan Greenspan convened a meeting of the Fed's policy-setting board. No action was proposed though one board member urged Greenspan not to fly from Washington to Dallas that day to give a speech.[17] But travel Greenspan did. On arrival in the Texas city, he asked a Dallas Fed official who greeted him at the airport how the stock market had gone. "It was down five zero eight," came the answer. Greenspan felt vindicated in travelling, given the stock market had lost only 5.08 points. "What a terrific rally," Greenspan said. But the man from the Dallas Fed looked pained. Greenspan realised the man meant the Dow Jones Industrial Average had plunged 508 points, nearly 25% of its value and the largest single-day loss in history. Amid concerns the Chicago Mercantile Exchange could collapse due to the events of 'Black Monday', Greenspan ensured the Fed on the Tuesday issued a one-line statement. It said the central bank reaffirmed "its readiness to serve as a source of liquidity to support the economic and financial system". In the first hour of trading, the Dow recouped 40% of the previous day's losses. The 'Greenspan' put was born (as was Greenspan's reputation as 'the maestro'). The Greenspan/Bernanke/Yellen/Powell put has lived a healthy life since. The Fed put has generally manifested itself as rate reductions. But it takes the form of emergency liquidity facilities. It comes in soothing comments (though none as effective as Mario Draghi's 'whatever it takes' of 2011 even if the Greenspan "irrational exuberance" comment of 1996 was a prescient warning).[18] And the put takes the form of quantitative easing. Fed leaders have acted to support asset prices because falling markets can destablilise the financial system and hurt the economy. Declines in asset prices can make consumers feel poorer and can batter their confidence, and thereby restrict the consumer spending that drives about 70% of the economy. The biggest risk with the Fed put is that it cultivates asset bubbles. In 1959 when Greenspan was under the influence of philosopher Ayn Rand, he presented a paper that argued bubbles were recognisable even when investors were irrational. Investors who bid risk premiums close to nothing have taken leave of their senses because they were forgetting the limits "of what can be known about future economic relationships," he said.[19] In his PhD thesis of 1977, Greenspan warned how rising incomes and rising financial prices fed into each other to create asset bubbles that would eventually burst, a contrary view in the heyday of efficient-market belief.[20] Yet as Fed chief from 1987 to 2006, Greenspan acted to ensure bubbles never burst. Greenspan biographer Sebastian Mallaby encapsulated this doublethink in his book title: The man who knew. Mallaby argues that Greenspan knowingly acted carelessly as Fed chair - usually under the cover of aiming for full employment - because "he calculated that acting forcefully against bubbles would lead only to frustration and hostile political scrutiny".[21] The political pressures are unlikely to have changed. The biggest flaw surrounding the Fed put is that it's only credible if a central bank can muster up some sound action. The danger is that one day the Fed might run out of credible emergency measures.[22] A US cash rate close to 0% means rate cuts are no recourse. (The Fed is against a negative key rate.) At some point, a swollen Fed balance sheet might hobble the Fed's ability to inject money into the economy. It's likely the dangers and higher interest rates stemming from quantitative tightening will prevent the Fed shrinking the balance sheet so much quantitative easing can safely restart to prop up asset bubbles. Come the day when the Fed is powerless to respond to bursting asset bubbles, maybe the storms that tear through financial markets can be called Hurricanes Alan, Ben, Janet and Jerome. Author: Michael Collins, Investment Specialist
Source: fred.stlouisfed.org/series/WALCL |
|
Funds operated by this manager: Magellan Global Fund (Hedged), Magellan Global Fund (Open Class Units) ASX:MGOC, Magellan High Conviction Fund, Magellan Infrastructure Fund, Magellan Infrastructure Fund (Unhedged), MFG Core Infrastructure Fund
[1] Federal Reserve. 'Federal Reserve issues FOMC statement.' 20 September 2017. federalreserve.gov/newsevents/pressreleases/monetary20170920a.htm [2] The Fed reassured investors everything was 'data dependent'. See Reuters. 'Key events for the Fed in 2013: the year of the 'taper tantrum'. 12 January 2019. reuters.com/article/us-usa-fed-2013-timeline-idUSKCN1P52A8 [3] The quantitative tightening ended as the Fed cut its key rate three times in four months in 2019 to help a slowing US economy extend its longest growth spree (before slashing the key rate when the pandemic struck in 2020). [4] The central bank later blamed its asset-selling coinciding with corporate tax payments and bond sales by the US Treasury for the troubles. Federal Reserve notes. 'What happened in money markets in September 2019?' 27 February 2020. federalreserve.gov/econres/notes/feds-notes/what-happened-in-money-markets-in-september-2019-20200227.htm [5] Federal Reserve. 'Transcript of Chair Powell's press conference January 26, 2022.' Page 4. federalreserve.gov/mediacenter/files/FOMCpresconf20220126.pdf [6] Federal Reserve of St Louis. FRED economic data. Chart. 'Assets: Total assets (less eliminations from consolidation): Wednesday Level (WALCL). fred.stlouisfed.org/series/WALCL [7] The Bank of England will do this by refraining from reinvesting government debt that matures, immediately selling 20 billion pounds of corporate debt and, when the key rate reaches 1%, by selling gilts. Bank of England. 'Bank rate increased to 0.5% - February 2022.' 3 February 2022. bankofengland.co.uk/monetary-policy-summary-and-minutes/2022/february-2022 [8] In its purest form, quantitative easing is an action wholly within monetary policy. Quantitative easing can veer towards money printing - an action that falls under fiscal policy - if it is used to finance government deficits, as has been doing the Bank of England. [9] Bloomberg News. QuickTake. 'How do central banks shrink their balance sheets?: QuickTake Q&A.' 23 June 2017. bloomberg.com/news/articles/2017-06-23/how-do-central-banks-shrink-their-balance-sheets-quicktake-q-a [10] 'Powell backed Fed's bond-buying plan with reservations in 2012.' The Wall St Journal. 5 January 2018. wsj.com/articles/powell-backed-feds-bond-buying-plan-with-reservations-in-2012-1515171836 [11] Jeremy Warner. 'The £100bn QE timebomb about to hit Britain's struggling finances.' The Telegraph of the UK. 12 February 2022. telegraph.co.uk/business/2022/02/12/100bn-qe-timebomb-hit-britains-struggling-finances/ [12] The Federal Reserve's profits were worth US$107.4 billion to the US federal budget in fiscal 2021. The US cash rate might need to climb above 2.5% to turn central-bank profits into losses. No one is expecting that, particularly as Russia's invasion of Ukraine saps economic growth. See Bloomberg News. 'US Treasury's golden Fed goose is about to get cooked.' 17 February 2022. bloomberg.com/opinion/articles/2022-02-17/the-federal-reserve-s-impending-profit-squeeze [13] The Fed would recall that populists against its independence twisted its decision in 2011 to pay interest on bank reserves into allegations the Fed was gifting banks billions of taxpayer dollars for not lending. [14] House of Lords. Economic Affairs Committee. First report of sessions 2021-22. 'Quantitative Easing - a dangerous addiction?' 16 July 2021. Page 52. publications.parliament.uk/pa/ld5802/ldselect/ldeconaf/42/42.pdf [15] The Bank of England in January and February has increased its key rate by 25 basis points, to lift it to 1%. The Fed is poised to raise its key rate in March. [16] See Mohamed El-Erian. 'The Fed's historic error.' Project Syndicate. 28 February 2022. https://www.project-syndicate.org/commentary/us-federal-reserve-inflation-policy-mistakes-by-mohamed-a-el-erian-2022-02 [17] Sebastian Mallaby. 'The man who knew. The life & times of Alan Greenspan.' Chapter 16 Light Black Monday. Pages 340 to 355. Bloomsbury. 2016 [18] Federal Reserve. 'Remarks by Chairman Alan Greenspan.' At the annual dinner and Francis Boyer lecture of The American Enterprise Institute for Public Policy Research, Washington, DC. 5 December 1996. federalreserve.gov/boarddocs/speeches/1996/19961205.htm [19] Mallaby. Op cit. Pages 56 to 57. [20] Mallaby. Op cit. Pages 212 to 213. [21] Sebastian Mallaby. 'The doubts of Alan Greenspan.' The Wall Street Journal. 29 September 2016. wsj.com/articles/the-doubts-of-alan-greenspan-1475167726 [22] Another risk is the Fed pushes too hard on quantitative easing by buying a wider array of securities. Over the pandemic, the Fed bought corporate debt while the Bank of Japan purchased equities. Such actions would support asset prices to a point where it doesn't and the damage would be even larger. Important Information: This material has been delivered to you by Magellan Asset Management Limited ABN 31 120 593 946 AFS Licence No. 304 301 ('Magellan') and has been prepared for general information purposes only and must not be construed as investment advice or as an investment recommendation. This material does not take into account your investment objectives, financial situation or particular needs. This material does not constitute an offer or inducement to engage in an investment activity nor does it form part of any offer documentation, offer or invitation to purchase, sell or subscribe for interests in any type of investment product or service. You should read and consider any relevant offer documentation applicable to any investment product or service and consider obtaining professional investment advice tailored to your specific circumstances before making any investment decision. A copy of the relevant PDS relating to a Magellan financial product or service may be obtained by calling +61 2 9235 4888 or by visiting www.magellangroup.com.au. Past performance is not necessarily indicative of future results and no person guarantees the future performance of any strategy, the amount or timing of any return from it, that asset allocations will be met, that it will be able to be implemented and its investment strategy or that its investment objectives will be achieved. This material may contain 'forward-looking statements'. Actual events or results or the actual performance of a Magellan financial product or service may differ materially from those reflected or contemplated in such forward-looking statements. This material may include data, research and other information from third party sources. Magellan makes no guarantee that such information is accurate, complete or timely and does not provide any warranties regarding results obtained from its use. This information is subject to change at any time and no person has any responsibility to update any of the information provided in this material. Statements contained in this material that are not historical facts are based on current expectations, estimates, projections, opinions and beliefs of Magellan. Such statements involve known and unknown risks, uncertainties and other factors, and undue reliance should not be placed thereon. Any trademarks, logos, and service marks contained herein may be the registered and unregistered trademarks of their respective owners. This material and the information contained within it may not be reproduced, or disclosed, in whole or in part, without the prior written consent of Magellan. |

5 Apr 2022 - Volatility, Uncertainty, and War
|
Volatility, Uncertainty, and War Laureola Advisors March 2022 THE INVESTMENT ENVIRONMENT - Volatility, Uncertainty, and War The S&P 500 dropped 2.6% in February and by mid-March was down 13% on the year. Other markets did even worse: Euro Stoxx ( -16.9%), Nasdaq 100 (-21.3%), and China CSI 300 (-31.4%). All markets were volatile, but the commodity markets were the worst with the LME suspending Nickel trading due to a 250% rise in two days. China based Tsingshan Holding Group Co is rumored to have a huge short position backed by JP Morgan and other banks and could not meet margin calls. Oil traded as high as $130 a barrel. European fertilizer makers have had to cut production due to the high price of natural gas and European steel manufacturers are cutting operations due to record prices for power. The war in Ukraine intensified with millions of refugees, hospitals and schools bombed, and over a thousand casualties so far. Investors' thoughts will clearly be with the Ukrainian population as they resist, but any analysis of the range of potential economic and political outcomes can only be speculative. The future is more uncertain than ever with even more pressures on inflation, supply chains, commodity prices, and food production - projected slower economic growth and higher inflation. Investors were already struggling to analyse the potential effects of the unwinding of 13 years of unprecedented QE and ZIRP policies and now the uncertainty has been compounded. Markets are likely to remain volatile and future investment value harder to gauge than ever. 2022 may be a good year to be invested in Life Settlements. THE LIFE SETTLEMENT MARKETS - LS Markets Stable; News from a European Investor Conference The Life Settlement markets remained stable albeit with lower volume and a gradual shift in favour of the buyers, contrary to the past two years which favoured the sellers. The Fund Managers attended an Investor Conference in Amsterdam in early March and it was an interesting study in contrast compared to similar conferences in the USA. There was a strong focus on ESG related issues including the need to be ESG accredited and have ESG Directors in house to ensure ESG rules were being followed in all investment decisions. The majority of the attendees and panelists had jobs that were ESG related. No one actually defined ESG precisely - it seems to be similar to a successful political slogan and can mean different things to different people. The emphasis on ESG and its impact was astonishing given how little attention was paid to the recent invasion of Ukraine, the scale of the conflict, and its potential consequences on investments in all asset classes. One of the more interesting non-ESG investment topics was the ability of different strategies to perform in the current investment climate with the unwinding of ZIRP, the war in Ukraine, and the forecasted lower growth and higher inflation scenario. Here there was a strong case for the Laureola Life Settlement strategy, which (for the record) has been given the ESG accreditation by the UN PRI on account of its contribution to solving social issues. Written By Tony Bremness Funds operated by this manager: |

5 Apr 2022 - 10k Words - March Edition
|
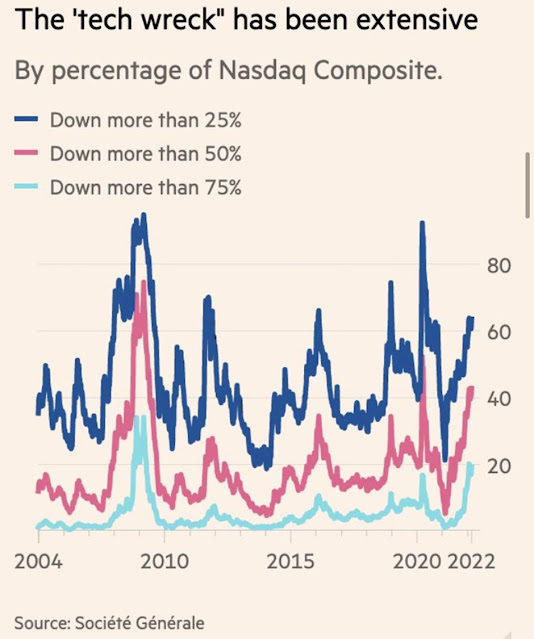
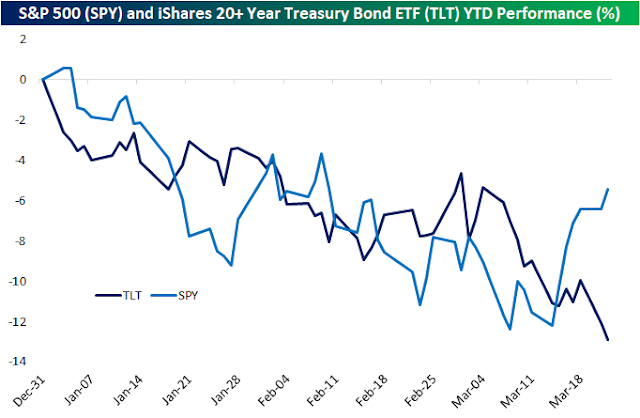
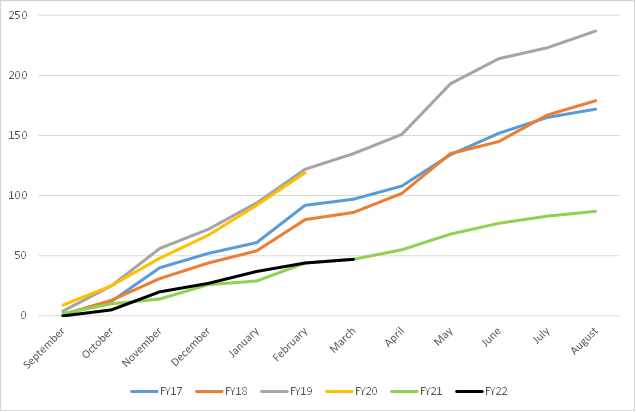
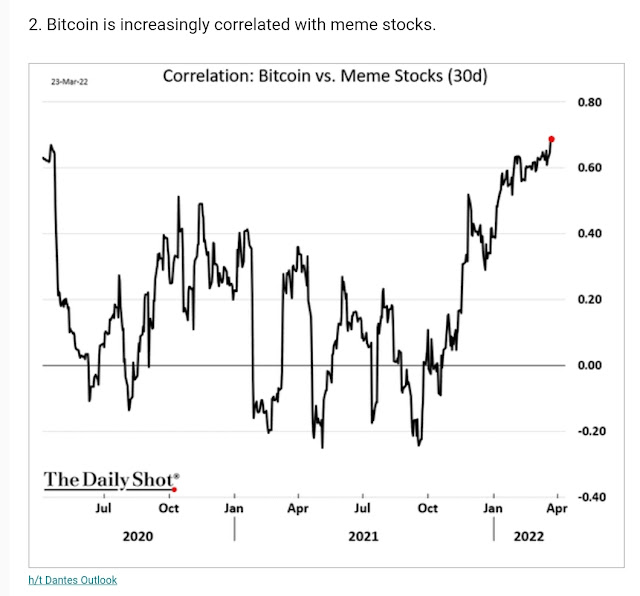
10k Words - March Edition Equitable Investors March 2022 Apparently, Confucius did not say "One Picture is Worth Ten Thousand Words" after all. It was an advertisement in a 1920s trade journal for the use of images in advertisements on the sides of streetcars. Even without the credibility of Confucius behind it, we think this saying has merit. Each month we share a few charts or images we consider noteworthy. The extent of the new "Tech Wreck" is highlighted by Societe Generale with 60%+ of stocks in the index down more than 25%, including 20% down more than 75%. But bonds have not delivered on their promise of safety as Bespoke and The Irrelevant Investor highlight. Back in Australia, Wilsons counts only 47 earnings downgrades in total for FY22 (so far), which is similar to FY21 but well below pre-Covid years. Wilsons also shows an unusually large spread between growth in small and large caps. The correlation of bitcoin with the more speculative parts of the equities market has been mapped courtesy of The Daily Shot. Finally, Bloomberg highlights that Australian polling indicates a change of federal government is on the cards. Nasdaq's latest "tech wreck"
Source: Societe Generale, @jsblokland
US equities (S&P 500) v long-term bonds (iShares 20+ Year Treasury Bond)
Source: Bespoke Bond market drawdowns: US equities (S&P 500) v Vanguard Total Bond Market ETF
Source: The Irrelevant Investor
Number of ASX downgrades per financial year
Source: Wilsons
ASX large cap growth less small cap growth
Source: Wilsons Bitcoin correlation with "meme" stocks
Source: The Daily Shot, Dantes Outlook Australia's election polls pointing to change in government
Source: Bloomberg, Newspoll Funds operated by this manager: Equitable Investors Dragonfly Fund Disclaimer Nothing in this blog constitutes investment advice - or advice in any other field. Neither the information, commentary or any opinion contained in this blog constitutes a solicitation or offer by Equitable Investors Pty Ltd (Equitable Investors) or its affiliates to buy or sell any securities or other financial instruments. Nor shall any such security be offered or sold to any person in any jurisdiction in which such offer, solicitation, purchase, or sale would be unlawful under the securities laws of such jurisdiction. The content of this blog should not be relied upon in making investment decisions.Any decisions based on information contained on this blog are the sole responsibility of the visitor. In exchange for using this blog, the visitor agree to indemnify Equitable Investors and hold Equitable Investors, its officers, directors, employees, affiliates, agents, licensors and suppliers harmless against any and all claims, losses, liability, costs and expenses (including but not limited to legal fees) arising from your use of this blog, from your violation of these Terms or from any decisions that the visitor makes based on such information. This blog is for information purposes only and is not intended to be relied upon as a forecast, research or investment advice. The information on this blog does not constitute a recommendation, offer or solicitation to buy or sell any securities or to adopt any investment strategy. Although this material is based upon information that Equitable Investors considers reliable and endeavours to keep current, Equitable Investors does not assure that this material is accurate, current or complete, and it should not be relied upon as such. Any opinions expressed on this blog may change as subsequent conditions vary. Equitable Investors does not warrant, either expressly or implied, the accuracy or completeness of the information, text, graphics, links or other items contained on this blog and does not warrant that the functions contained in this blog will be uninterrupted or error-free, that defects will be corrected, or that the blog will be free of viruses or other harmful components.Equitable Investors expressly disclaims all liability for errors and omissions in the materials on this blog and for the use or interpretation by others of information contained on the blog |

5 Apr 2022 - American bourbon and business insights
|
American bourbon and business insights Forager Funds Management 24 March 2021 Steve Johnson and Gareth Brown are in Chicago for an episode of 'Stocks Neat'. They taste-test an American bourbon and recap their research trip in the US. Tune in as they reflect on the impacts of inflation and supply chain disruptions on businesses in the US, and the potential impact of the war in Ukraine on the Australian economy. |
|
Funds operated by this manager: Forager Australian Shares Fund (ASX: FOR), Forager International Shares Fund |
 Source: Bloomberg, as of 25 March 2022.
 Source: Bloomberg
 Source: Federal Reserve, as of 31 December 2022.
 Source: U.S. Census Bureau, as of 31 December 2022.

