News

10 Mar 2023 - When inflation meets recession
|
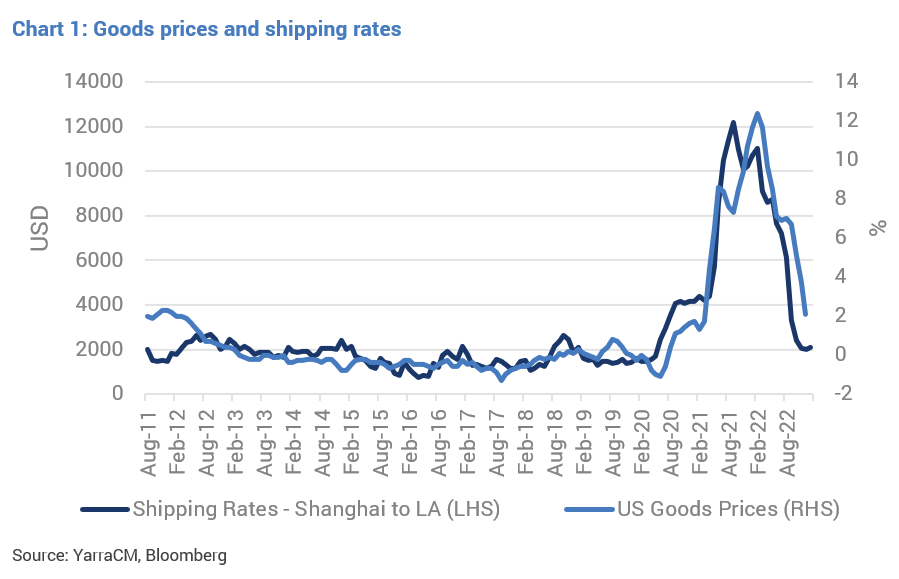
When inflation meets recession Yarra Capital Management February 2023 So, has inflation peaked or not?Given the multi-decade high inflation levels of 2022 was the precursor to aggressive interest rate hikes, a key driver for the 2023 outlook is the direction of inflation. Throughout 2022 three core factors drove higher inflation; supply chain issues, amplified goods demand due to stimulus, and a commodity price shock. All three appear to have peaked. Several economic indicators suggest that supply chain issues are behind us. The supply chain measure provided by the Federal Reserve has fallen, shipping rates between the US and China have normalised (refer Chart 1), and key global exporters such as Korea and Germany are now seeing export orders decline.
Additionally, the impact of central bank rate rises through 2022 should see consumer spending slow in 2023, as the fastest rate hiking period in the past 30 years quickly constrains household budgets. In Australia, we expect to see mortgage costs rise anywhere from 20-60% (for the typical borrower), with those who borrowed on a fixed rate over the past 18 months will see a 60% increase in payments. After an era of cheap money and stimulus provided during COVID, this should take the sails out of the outsized goods demand over the past two years.
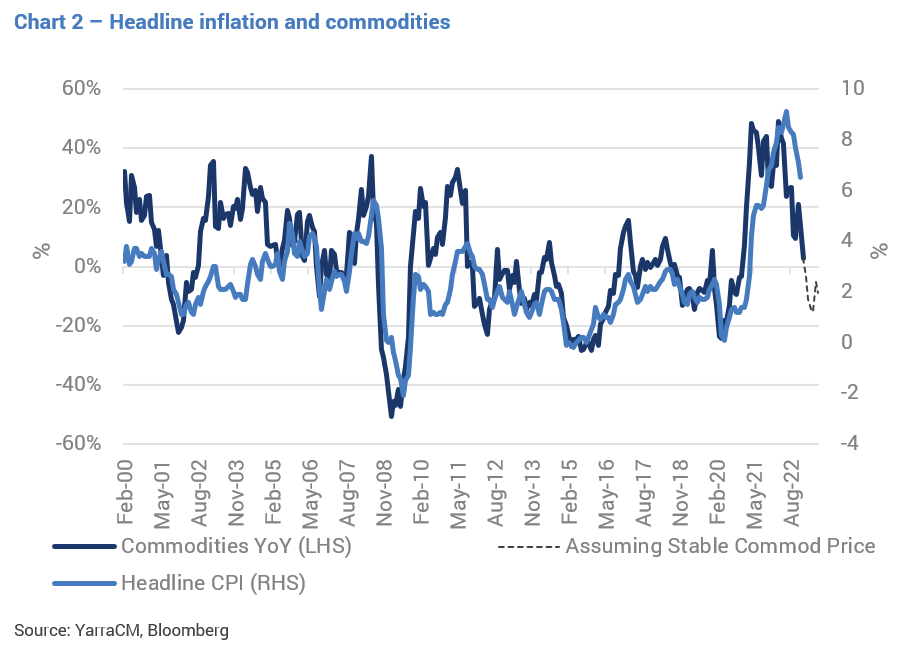
While geopolitical risk related to Russia dominated headlines in 2022, commodity prices have begun to fall. Oil is now flat on a year-on-year basis and commodities are declining. Commodity prices are one of the strongest predictors of inflation, and the more benign commodity prices, point to inflation falling away in 2023 (refer Chart 2).
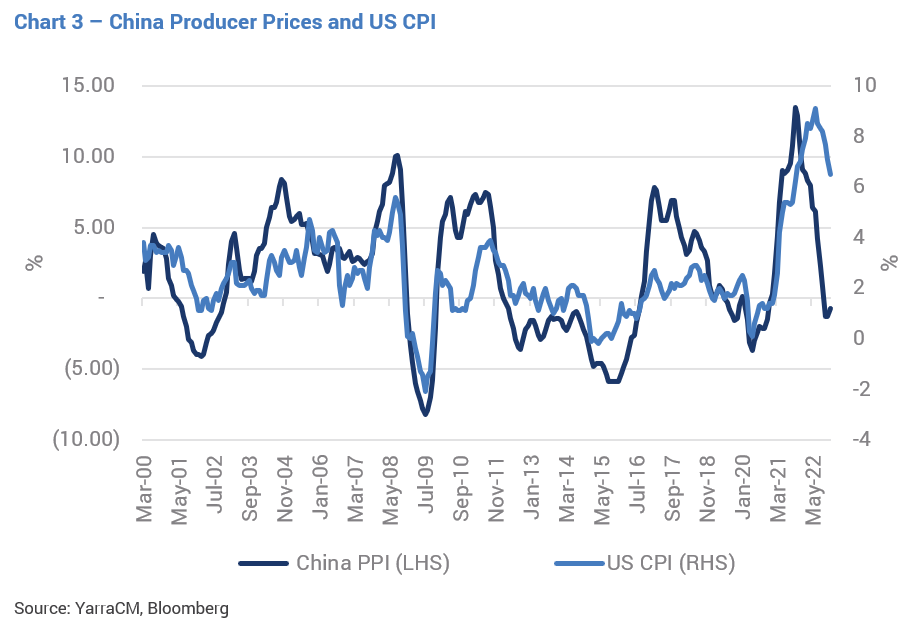
Outside of these factors, several other lead indicators of inflation are beginning to decline. These include producer prices in China dropping to deflationary levels (refer Chart 3).
PMI surveys show that firms are now reporting that input prices are falling, and small business surveys show the number of firms passing on price increases has peaked (refer Chart 4).
While the indicators do not point to a deflationary environment, the speed with which they have shifted, combined with the central bank's aggressive hiking cycle, suggests that we could see inflation back within their target bands by the middle of the year. This would encourage central banks to keep interest rates high but remove their hawkish bias. Signs pointing to rising recession riskThe second factor that is likely to determine interest rates in 2023 is related to recession risk. Historically, when a recession occurs, interest rates fall aggressively as central banks ease financial conditions to boost their economies. This has occurred in every recession over the past 50 years (refer Chart 5).
On average, following a recession, the cash rate dropped by 400 basis points, with smaller decreases only occurring when the cash rate hit the zero bound (refer Table 2). In no instance did the cash rate finish the recession higher or at the same rate it started.
If the US enters a recession in 2023, there will be pressure on the Federal Reserve to cut the cash rate. Currently, several recession indicators are starting to flash red and point to a distressing growth signal. These signals can be seen in the leading index of US growth, new orders, consumer expectations, and housing. For example, the leading US growth index has moved into contraction (refer Chart 6) and is now at a level indicative of a recession, as observed in all of the past eight occurrences.
A warning sign of recession can also be a result of falling indexes including new orders relative to inventories which have now seen the US yield curve invert across multiple maturities (refer Chart 7). Historically, this has preceded a recession by approximately six to 12 months, reflecting monetary policy has become too tight for economic conditions. As with the leading index above, curve inversion has not given a false positive and has preceded all recessions since 1970.
In addition, we are seeing recessionary signals such as a weak housing market and an extreme softening in consumer confidence.
While many may hope that the economy faces an unemployment-less recession, i.e., that unemployment doesn't rise as growth falls, this would be an extremely rare occurrence. Over the past 50 years, unemployment has never remained stable through a recession, rising anywhere from 0.6% to 3% higher over a six-month period. If the US economy does enter a recession, a rise in unemployment should not be far away.
The key takeaway is that we have not seen this many recessionary signals since 2007, creating strong pressure for central banks to ease rates should a recession occur. Interest Rate Outlook - Inflation meets recessionThese two forces produce two very different outcomes for central banks and interest rates. On the one hand, high but slowing inflation should encourage central banks to maintain their hawkish stance, hold rates high and ensure that inflation returns to its 2% targets. However, the deterioration in economic data would historically have seen a dovish tone being adopted by now. So which force should win? The below chart shows that, historically, recession risk dominates. When recession occurred in the '70s, '90s, and '00s, rates fell even when inflation was high. Furthermore, in 1974 and 2008, the cash rate fell before inflation peaked and was still running at over 5%.
Despite this, the Federal Reserve continues to present an extremely hawkish message, expecting to make cash rate moves that take little consideration of the existent lags in monetary policy. The Federal Reserve dot plot (a chart that records each Fed official's projection for the central bank's key short-term interest rate) currently shows an expectation for cash rates to be around 5.5% in 2023. Considering this, it may set up 2023 to be a tale of two halves; higher cash rates to begin the year and lower cash rates mid-year as the Fed acknowledges the recession risks. With this in mind, we believe rates will end 2023 lower than 2022, even if central banks continue to talk a hawkish message in the first few months of this year. If the recessionary indicators prove correct, then rate cuts of 400 points is the magnitude required to restart the economy, which would drag short-dated interest rates into a 1-2% range. The Yield Curve - Flatter short-term, much steeper long termThe yield curve is one of the most consistent series in bond markets as both the driver of its changes and the levels it respects. While bond yields have fallen from 15% to 0%, the spread between the two and 10-year bonds has typically been range bound between -100bps and +250bps. When looking at the two-component rates of the curve, it is easy to see that monetary policy direction is the key driver that determines both steepening and flattening. When the cash rate rises the yield curve flattens, and when the cash rate falls the yield curve steepens. This occurs as the 2-year yield makes larger moves with the change in the cash rate while the 10-year yield is slower-moving. Typically, the 2-year yield moves the fastest to cause large changes in the shape of the curve (refer Chart 11).
We can make two comments about the direction of the curve:
As such, we currently favour a steepening position for three reasons. Firstly, central banks can change their minds and we believe that the magnifying recession signals should not be ignored. If the recession risks are proven true, we should see dovish actions take place sometime in 2023 which will cause the curve to steepen. This idea is backed up by the fact that post-1970, curve inversion has signalled that rate hikes should be coming to an end.
Secondly, the typical flattening cycle occurs over multiple years, while the steepening period is usually far shorter, with the first 100 points of steepening occurring over 9-12 months.
And finally, the curve typically struggles to flatten through -50 to -75 levels that are now broken and take the inversion to historically stretched levels. As such, we are looking to position ourselves to capture the next 200-point move steeper, rather than the last 20-50 points flatter. Is the RBA done with interest rate hikes?While the majority of this outlook has focused on the US, as Australian and US long end rates are highly correlated, for short-dated rates it is important to consider whether or not the RBA has finished its hiking cycle. This is important as the differential between US and Australian short-dated rates is largely determined by the cash rate differential. When the Australian cash rate is higher than that of the US, then 2-year bond yields in Australia will be higher too. Since Australian short-dated bonds remain well below the US, the ability for them to move in a similar nature to the US will depend on the RBA's next action.
One of the key differences between Australia and the US is that the Australian mortgage market is predominantly a variable rate market, while the US mortgage market is fixed. This means the Australian household should feel the brunt of rate hikes faster and at a lower interest rate than in the US. We determine how restrictive monetary policy is by estimating the percentage of disposable income allocated to repaying loans. This measure accounts not only for interest rates but total debt loads and income in the economy. As shown below, the current RBA hikes have already taken this measure to some of the tightest monetary policy settings we have seen in the past 40 years.
Since the Australian policy setting is becoming historically tight, and the global economy is slowing, we believe the RBA is approaching the end of its hiking cycle. If this is the case, 3-year bond yields should have already peaked for this cycle and are currently close to what we consider a fair value. Whether or not short-dated bonds can rally in Australia in 2023 will depend largely on what the RBA does with the cash rate. In previous hiking cycles, if the cash rate can remain stable for 12 months or longer (1995 and 2010), then 3-year bond yields consolidated at those levels for an extended period (refer Table 3). However, when the cash rate held at its peak for only six months (such as in 2000 and 2008), bond yields rallied in anticipation of future cuts and saw yields materially under the cash rate.
Currently, it's too premature to tell whether the RBA will need to cut rates in 2023, as the lead growth indicators for Australia are not as weak as they are in the US. However, if the US and Europe enter a recession, we would expect Australia to follow. Given we are likely near the peak of the cash rate cycle, this effectively sets up an outlook where two outcomes can likely occur. If the global economy avoids a recession, Australian 3-year yields should be somewhat stable and trade around 3.50%. Alternatively, if the global economy continues to slow, we should end the year with yields well below 3%. Therefore, we expect there is a strong likelihood that short-dated yields will end in 2023 lower than in 2022. Author: Chris Rands, Co-Portfolio Manager of the Yarra Australian Bond Fund |
|
Funds operated by this manager: Yarra Australian Equities Fund, Yarra Emerging Leaders Fund, Yarra Enhanced Income Fund, Yarra Income Plus Fund |

9 Mar 2023 - Investment Perspectives: 10 charts for optimism in 2023

8 Mar 2023 - This retailer has been savaged on results but does it provide an opportunity?
|
This retailer has been savaged on results but does it provide an opportunity? Novaport Capital February 2023 Tim Binsted from NovaPort Capital runs the ruler over this retailer's results and provides an outlook for the coming 12 months. Specialty retail has been a tough place to operate over the past 12-18 months. Gone are the goldilocks conditions of the pandemic (at least from a retail perspective), where everyone was at home remodelling their living rooms and updating their décor. Replaced by an environment of higher interest rates, mortgage stress, and increased economic uncertainty. The company we're focused on today has been savaged by the market on the back of its latest results, perhaps unfairly, suggests Tim Binsted from NovaPort Captial.
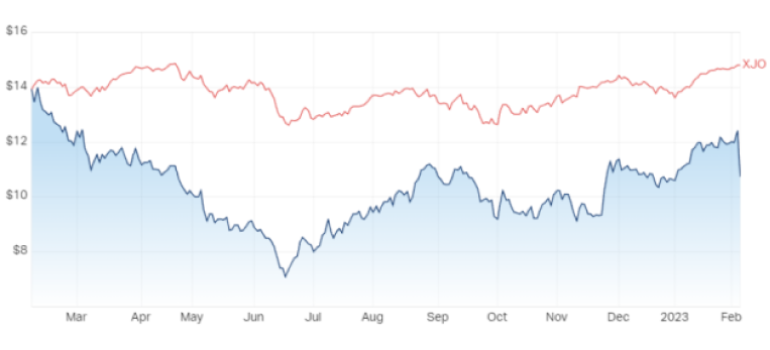
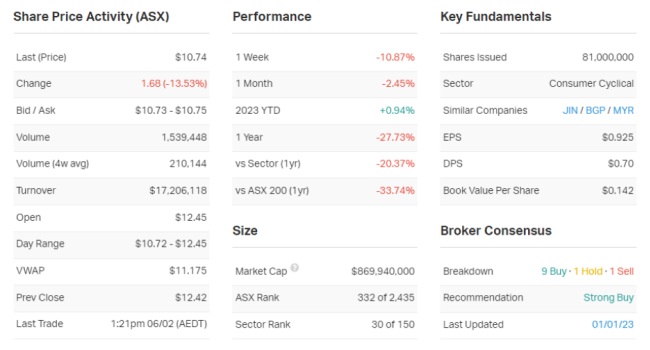
The stock in question is Nick Scali (ASX: NCK) and whilst the company's results were much stronger than a year ago, with revenue and EBITDA up more than 50% each, written sales orders were down more than 12% on January 2022 - and that's what has spooked the market. The NCK share price performance has been solid since the June low, rallying from around $7 to north of $12 before today's results. Join me as I dive into the results with Binsted and get his take on the prospects for Nick Scali as it continues to navigate the post-Covid retail landscape. Nick Scali (ASX: NCK) H1 key results and company data
In one sentence, what was the key takeaway from this result? It looks like the froth from the lockdown-driven boom in furniture sales has ended. The stock is down 13% on the results. In your view, was it an overreaction, an under-reaction or appropriate? I think it looks like a bit of an overreaction. I think we had the market jumping at shadows leading into the market lows with big fears about retail disaster. The whole sector sold off and then it rallied when trading was better than expected and it rallied quite hard into the result. Everyone was expecting that the boom in COVID sales couldn't last forever. I think it's not surprising that we've had some moderation, but the market's now extrapolating this going forward. I think it's jumped at shadows before, recovered and rallied.
We're there any major surprises in this result that you think investors should beware of? No major surprises. We've all seen rising rates. We all knew there was a huge boom in sales during COVID per this category in particular, those comps were never going to last.
I mean, they're [sales] not falling off a cliff. They're still well up on pre-COVID. I wouldn't have thought there's a massive surprise in there. The main positive surprise would be how well they're executing on the Plush acquisition. Would you buy, hold or sell NCK on the back of these results? RATING: Hold Please note that NovaCapital currently hold this stock in its portfolio. What's your outlook on NCK and its sector over the year ahead? Are there any risks to this company and its sector that investors should be aware of?
I think you'd also expect that rising rates will put a little bit of a dent in as well, but you've got very strong employment, so that should support sales to some degree. As long as unemployment is below 4%, wages are still strong. That's a mitigating factor. And then you should see them bank a lot of synergies from the acquisition of Plush, which is going really, really well. They've got one of the best management teams in the business executing that. They've got $20 million out already on a runway basis, and they're getting the margins up in that Plush business. There's 6-7% percentage points of margin that they're getting through there.
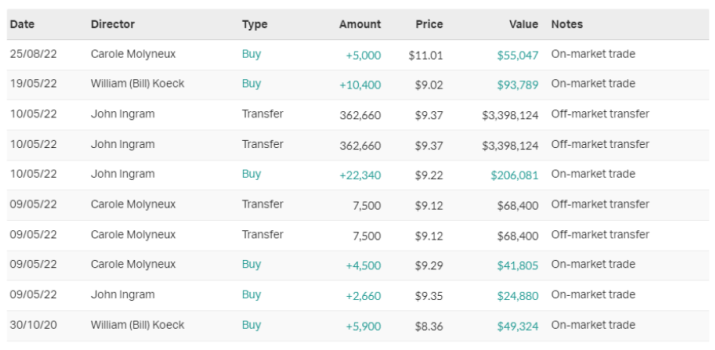
I think the retail sector, generally, it is going to get tougher with rates going up. You've got a lot of fixed mortgages rolling off, it's been well flagged, that's going to hit consumers, but we're coming off a really high base and the valuations aren't that high for Scali and some of its peers. There's a few offsetting factors there, but you have to say sales would have to be a bit less rosy, but it just depends on individual stocks and how they're placed to manage that. There will be a little bit of top-line pressure, but it's well-run business with good margins and a great acquisition to deliver synergies. From 1-5, where 1 is cheap and 5 is expensive, how much value are you seeing in the market right now? Are you excited or are you cautious on the market in general? RATING: 2-3 I think you'd have to say it's pretty exciting. I think you probably have to say somewhere between a two and a three. And the reason that I've given you a range, I'd probably skew it more towards two. For cheapness, there is value, but we just haven't really seen the earnings pressures yet. We've had a very good period for market earnings. I think we've had the PE come down, bit of a de-rate with the interest rate rises, and we haven't seen the earnings pressure yet. Maybe we're just starting to see a little bit of that through pockets of the market. I think you want to see a bit more of an adjustment there. Plus, we've had a big rally over Christmas and into February reporting, so that's taken away some of the ultra cheapness out of the market. But there's opportunity. The market's rebased a bit and it's a good time to be investing. 10 most recent director transactions
Source: Market Index Funds operated by this manager: NovaPort Microcap Fund, NovaPort Wholesale Smaller Companies Fund This material has been prepared by NovaPort Capital Pty Limited (ABN 88 140 833 656, AFSL 385 329) (NovaPort). It is general information only and is not intended to provide you with financial advice or take into account your objectives, financial situation or needs. To the extent permitted by law, no liability is accepted for any loss or damage as a result of any reliance on this information. Any projections are based on assumptions which we believe are reasonable, but are subject to change and should not be relied upon. Past performance is not a reliable indicator of future performance. Neither any particular rate of return nor capital invested are guaranteed. |

7 Mar 2023 - Glenmore Asset Management - Market Commentary
|
Market Commentary - January Glenmore Asset Management February 2023 Equity markets were stronger in January, as investor sentiment shifted toward a potential soft landing (ie. inflation moving back to acceptable target levels without a severe economic downturn). In the US, the S&P 500 rose +6.2%, the Nasdaq was up +10.7%, whilst in the UK, the FTSE 100 increased +4.3%. On the ASX, the All Ordinaries Accumulation Index rose +6.4%, with consumer discretionary and technology sectors outperforming, whilst utilities underperformed, as investors chased cyclical and higher risk exposure. In bond markets, the US 10 year bond rate fell -31 basis points to close at 3.52%, whilst in Australia, the 10 year yield was broadly flat at 3.55% Commodity markets were broadly stronger in January. Iron ore rose +10%, gold +6%, and copper +11%. After a very strong rise since mid 2020, thermal coal fell sharply (-35%) and has continued to fall in February month to date. Crude oil declined -2% in the month. The A$/US$ appreciated +4% to close at US$0.70. Funds operated by this manager: |

6 Mar 2023 - Magellan Infrastructure Strategy Update
|
Magellan Infrastructure Strategy Update Magellan Asset Management January 2023 |
|
Magellan's Deputy CIO, Head of Infrastructure and Portfolio Manager, Gerald Stack, mentions the challenges that the Infrastructure portfolio faced in 2022. Gerald describes how the portfolio is positioned now to take advantage of growth trends such as the re-opening of the global economy and the transition to renewable energy. |
|
Funds operated by this manager: Magellan Global Fund (Hedged), Magellan Global Fund (Open Class Units) ASX:MGOC, Magellan High Conviction Fund, Magellan Infrastructure Fund, Magellan Infrastructure Fund (Unhedged), MFG Core Infrastructure Fund Important Information: This material has been delivered to you by Magellan Asset Management Limited ABN 31 120 593 946 AFS Licence No. 304 301 ('Magellan') and has been prepared for general information purposes only and must not be construed as investment advice or as an investment recommendation. This material does not take into account your investment objectives, financial situation or particular needs. This material does not constitute an offer or inducement to engage in an investment activity nor does it form part of any offer documentation, offer or invitation to purchase, sell or subscribe for interests in any type of investment product or service. You should read and consider any relevant offer documentation applicable to any investment product or service and consider obtaining professional investment advice tailored to your specific circumstances before making any investment decision. A copy of the relevant PDS relating to a Magellan financial product or service may be obtained by calling +61 2 9235 4888 or by visiting www.magellangroup.com.au. Past performance is not necessarily indicative of future results and no person guarantees the future performance of any strategy, the amount or timing of any return from it, that asset allocations will be met, that it will be able to be implemented and its investment strategy or that its investment objectives will be achieved. This material may contain 'forward-looking statements'. Actual events or results or the actual performance of a Magellan financial product or service may differ materially from those reflected or contemplated in such forward-looking statements. This material may include data, research and other information from third party sources. Magellan makes no guarantee that such information is accurate, complete or timely and does not provide any warranties regarding results obtained from its use. This information is subject to change at any time and no person has any responsibility to update any of the information provided in this material. Statements contained in this material that are not historical facts are based on current expectations, estimates, projections, opinions and beliefs of Magellan. Such statements involve known and unknown risks, uncertainties and other factors, and undue reliance should not be placed thereon. Any trademarks, logos, and service marks contained herein may be the registered and unregistered trademarks of their respective owners. This material and the information contained within it may not be reproduced, or disclosed, in whole or in part, without the prior written consent of Magellan. |

3 Mar 2023 - The many facets of gold: Hedging, inflation and interest rates

2 Mar 2023 - Enabling net zero - infrastructure's role in the energy transition
|
Enabling net zero - infrastructure's role in the energy transition abrdn February 2023
Infrastructure is an enabler Infrastructure provides heat, power, mobility, clean water, waste treatment and digital connectivity - all services that underpin a functioning society. It also has the potential to enable change: to improve livelihoods, reduce inequality, improve productivity and support environmental outcomes. When there's a societal imperative, infrastructure can provide the foundation for it to be achieved. This is particularly true of our response to climate change. Economies must fully decarbonise globally by 2050 to give a reasonable chance of keeping the temperature rise below 1.5 degrees by the end of the century. This goal is a firm policy objective in many countries, including the UK and the EU. The role of infrastructure in the transition Using the UK as an example, infrastructure accounts for around 54%1 of total annual emissions. The emissions that come from the construction and operation of infrastructure assets (capital and operational carbon, respectively) represent around 13% of the total. But by far the largest component, making up the remaining 41%, are emissions arising from using infrastructure - referred to as user carbon. The carbon footprint of each business and citizen in the economy is highly dependent on the emissions intensity of the infrastructure they use - that is, the energy and physical resources they use, the data they consume, and the transport options available to them. Significant improvements have been made to the emissions intensity of some sectors since 2010. The energy and waste sectors, in particular, have been subject to ambitious policy packages over this period. But progress isn't fast enough and other sectors like transport lag behind. The choices and behaviours of individuals can help, but without accelerated decarbonisation of the infrastructure services on which we all rely, the 2050 target will be hard to meet. Without accelerated decarbonisation of the infrastructure services on which we all rely, the 2050 target will be hard to meet Mobilising investment in the transition This is a theme that came out strongly in the recent independent review of the UK's net-zero policies2 and one that is central to the EU's Green Deal package3. An estimated £40 billion of annual investment in infrastructure is required over the next decade if the UK is to meet its net-zero commitment4. Across the EU, this figure is approximately €737 billion per year to 20305. These are substantial numbers that require unprecedented collaboration between policymakers and investors. Infrastructure assets are characterised by long construction lead times and decades-long operational lifetimes. If such investment is to be mobilised quickly and successfully, investors need a policy mix that provides sufficient confidence in long-term revenues and returns. This capital is required to develop new low-carbon infrastructure, but also to invest in decarbonising and repurposing existing assets that can play a role in the transition. Many traditional infrastructure assets are inconsistent with the net-zero transition and lack a viable plan. In other words, high user carbon is locked in. For these assets, the clock is ticking on their functional life in the face of increasing carbon pricing, regulation and shifting customer sentiment. Conversely, assets that are aligned with the transition and support reductions in user carbon will attract stronger policy support. This means they will not face the same functional obsolescence over time. As a result, they are likely to support stronger returns for investors over the long term. Our role in the transition We focus on small- and mid-market assets where we are either the majority shareholder or the significant minority partner, and we always have board representation. Small- and mid-market assets represent the majority of infrastructure assets - many utilities, energy generation, and fibre assets fall into this category. We take a long-term view that allows us to assess each asset's role in the low-carbon transition. And we position these assets to benefit from opportunities to create value. Our level of influence and proactive approach to asset management mean we can drive real change in this respect. For example, alongside our investments in operational renewables in Poland and Norway, our Finnish utility Auris Energy has a strategy to phase out the supply of fossil-gas entirely by 2040. Additionally, our North Sea gas asset Noordgastransport has recently gained technical approval to transport hydrogen produced from offshore wind where the laying of electrical cables is not economical. In both cases, assets are being repositioned to support the low-carbon transition and to drive much-needed reductions in user carbon for their customers and the wider economy. The vital role that infrastructure must play in enabling the low-carbon transition is clear. We believe our approach to proactive, long-term, direct infrastructure investment presents a unique opportunity to support the net-zero journey. Author: Ruairi Revell, Head of Sustainability - Infrastructure |
|
Funds operated by this manager: Aberdeen Standard Actively Hedged International Equities Fund, Aberdeen Standard Asian Opportunities Fund, Aberdeen Standard Australian Small Companies Fund, Aberdeen Standard Emerging Opportunities Fund, Aberdeen Standard Ex-20 Australian Equities Fund (Class A), Aberdeen Standard Focused Sustainable Australian Equity Fund, Aberdeen Standard Fully Hedged International Equities Fund, Aberdeen Standard Global Absolute Return Strategies Fund, Aberdeen Standard Global Corporate Bond Fund, Aberdeen Standard International Equity Fund, Aberdeen Standard Multi Asset Real Return Fund, Aberdeen Standard Multi-Asset Income Fund Companies are selected for illustrative purposes only to demonstrate the investment management style described herein and not as an investment recommendation or indication of future performance. Past performance is not a guide to future results. 1.The Carbon Project: the scale of the net zero 2050 challenge | Institution of Civil Engineers (ICE) |

1 Mar 2023 - The global inflation bogeyman slips away...
|
The global inflation bogeyman slips away... Insync Fund Managers February 2023 In this White Paper, Insync said five common assertions had been stirring the pessimism pot, one of which was that the resumption of rising interest rates, and therefore inflation, is firmly established. Insync Portfolio Manager John Lobb said, "We disagreed with those pessimistic assertions then, and in the face of further evidence, we still disagree." In August 2022, Insync said the incredible rate of money creation during 2020-2021 of 20% to 30% pa, had dramatically slowed to the average of the historic range of 5-6%. Excess money had been chasing an interrupted supply of goods and services up until last year, pushing up prices artificially. "Today, the Money Supply (M2) rate of change is negative (-1.3%). This has not happened for at least 80 years," Mr. Lobb said. "This development would be of concern to the Federal Open Market Committee (FOMC), since productive investment relies heavily on the availability of credit." In 2022, Insync had also pointed out that inflation of the price of goods leaving the gates of Chinese factories, which had been running at 13-14%, had dropped back to 4%. "The factory gate prices of Chinese manufacturing plants have now declined at -1.3% over the last year," Mr. Lobb said. Additionally, he said that a decline in the net number of small to medium (SME) businesses looking to implement price hikes, also identified by Insync in August 2022, had continued to such an extent that SME pricing intentions in the next three months now match those prior to the pandemic. Looking to carbon energy supplies, which was also touted as an ongoing inflationary pressure, the reverse has been true. "It fell even further than we predicted," Mr. Lobb said. "In more normal times, central banks largely ignore the ebb and flow of global energy and food prices. However, in today's conditions where the labour force has contracted, rises in food and energy prices may strengthen the case for higher rates since pay demands could create a more sustained impulse to inflation." Mr. Lobb said that fortunately, Natural Gas (MMBtu) has dropped 65% in less than six months, back to the same level as that during the previous four northern hemisphere winters. "Besides being used for heating, it's a core determinant of fertiliser and thus food prices. Crude oil and therefore gasoline prices, have declined in excess of 20% to $78/barrel in the last six months. This is even below its price prior to the Russian invasion of Ukraine," he said. "So, whilst the FOMC is usually more interested in CPI ex food and energy, they would appreciate how reductions in the prices of these non-discretionary goods has a positive indirect effect on wage demands in what is a tight labour market." Insync had asserted that inflation over the past few decades had been abnormally low, and they had expected it to settle around its longer-term norm, which is not bad for equity markets. "This is exactly what it is heading towards. Five-year inflationary expectations are now congruent with the 5-10 year inflationary expectations (2.3%) which will calm the nerves of the FOMC," Mr. Lobb said. "It has always been our view that long-term inflation expectations will not revert to those of the recent abnormal past of around 2% due to a less (internationally) mobile labour force and a higher degree of onshoring. Nevertheless, the FOMC's expectations will also be tempered by their assessment of the new global regime, mainly attributable to the re-evaluation of geopolitical risk by large corporates." Insync had also noted that looking at the core drivers of inflation it was hard to see price rises continuing as had been the case in the previous year and, if the prices of the core drivers of inflation stabilise, inflation would drop dramatically in this coming year. "Even total weekly wages, a significant driver of 'stickier' service inflation, are now only growing at 3.5-3.75%, similar to the rate of growth that existed in 2019," Mr. Lobb said. "As employees and managers become more accustomed to the increased prevalence of the hybrid work schedule, productivity should recover from the currently negative -1.7%, leading to an even greater improvement in unit labour costs (ULC). The Federal Reserve is keenly aware that ULC is the real culprit of endemic inflation." While Insync believes the global economy is unlikely to regain its 'fluidity', it also believes the central banks will feel more comfortable promoting a more neutral policy stance based on the above developments. "Perhaps for those investors that hold a pessimistic view, it may be time to question this, to deploy assets towards those equites that are primed to deliver above average earnings growth in a mediocre at best, GDP environment," Mr. Lobb said. Funds operated by this manager: Insync Global Capital Aware Fund, Insync Global Quality Equity Fund Disclaimer |

28 Feb 2023 - Airlie Quarterly Update
|
Airlie Quarterly Update Airlie Funds Management January 2023 |
|
Emma Fisher, Portfolio Manager, reflects on the volatility of the past year and discusses Airlie's investment thesis behind a building products company which has been a recent addition to the portfolio. Speaker: Emma Fisher, Portfolio Manager Funds operated by this manager: Important Information: Units in the fund(s) referred to herein are issued by Magellan Asset Management Limited (ABN 31 120 593 946, AFS Licence No. 304 301) trading as Airlie Funds Management ('Airlie') and has been prepared for general information purposes only and must not be construed as investment advice or as an investment recommendation. This material does not take into account your investment objectives, financial situation or particular needs. This material does not constitute an offer or inducement to engage in an investment activity nor does it form part of any offer documentation, offer or invitation to purchase, sell or subscribe for interests in any type of investment product or service. You should obtain and consider the relevant Product Disclosure Statement ('PDS') and Target Market Determination ('TMD') and consider obtaining professional investment advice tailored to your specific circumstances before making a decision to acquire, or continue to hold, the relevant financial product. A copy of the relevant PDS and TMD relating to an Airlie financial product or service may be obtained by calling +61 2 9235 4760 or by visiting www.airliefundsmanagement.com.au. Past performance is not necessarily indicative of future results and no person guarantees the future performance of any financial product or service, the amount or timing of any return from it, that asset allocations will be met, that it will be able to implement its investment strategy or that its investment objectives will be achieved. This material may contain 'forward-looking statements'. Actual events or results or the actual performance of an Airlie financial product or service may differ materially from those reflected or contemplated in such forward-looking statements. This material may include data, research and other information from third party sources. Airlie makes no guarantee that such information is accurate, complete or timely and does not provide any warranties regarding results obtained from its use. This information is subject to change at any time and no person has any responsibility to update any of the information provided in this material. Statements contained in this material that are not historical facts are based on current expectations, estimates, projections, opinions and beliefs of Airlie. Such statements involve known and unknown risks, uncertainties and other factors, and undue reliance should not be placed thereon. Any third party trademarks contained herein are the property of their respective owners and Airlie claims no ownership in, nor any affiliation with, such trademarks. Any third party trademarks that appear in this material are used for information purposes and only to identify the company names or brands of their respective owners. No affiliation, sponsorship or endorsement should be inferred from the use of these trademarks.. This material and the information contained within it may not be reproduced, or disclosed, in whole or in part, without the prior written consent of Airlie. |

27 Feb 2023 - 10k Words
|
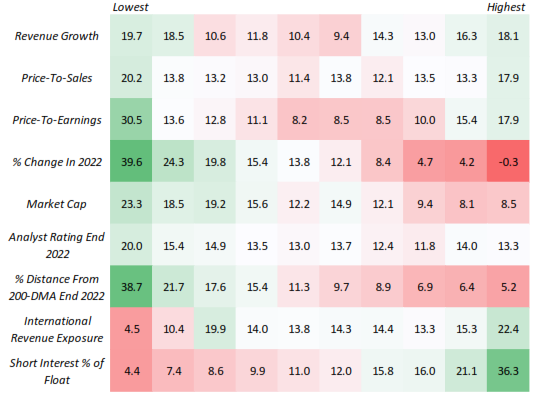
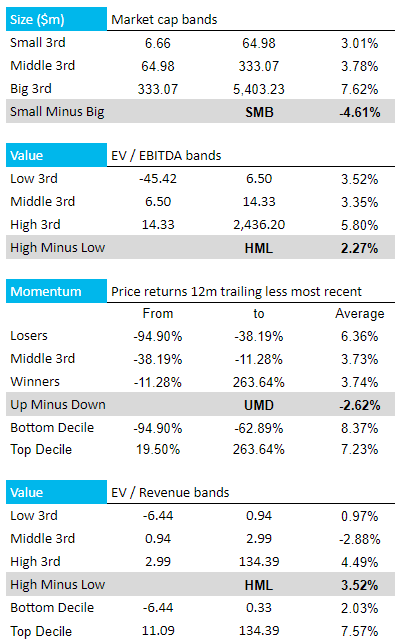
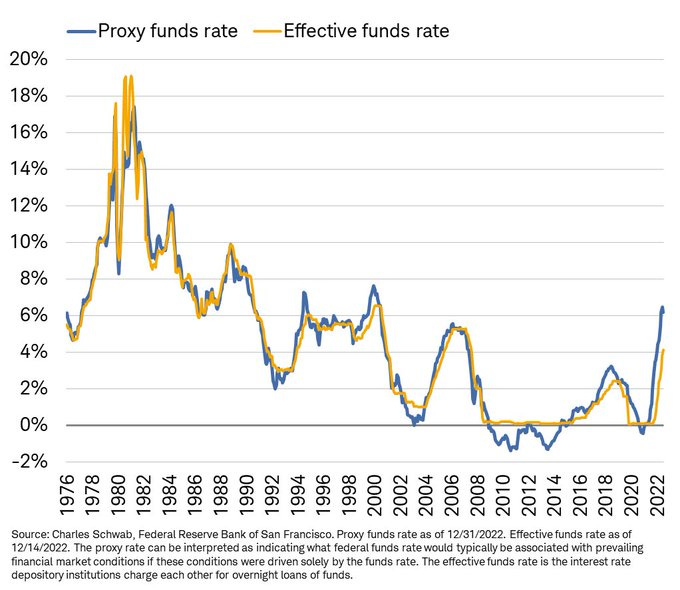
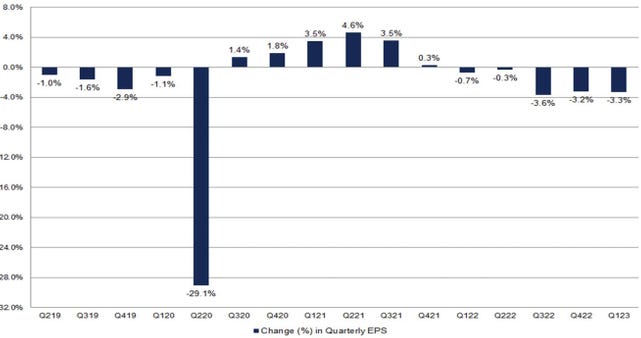
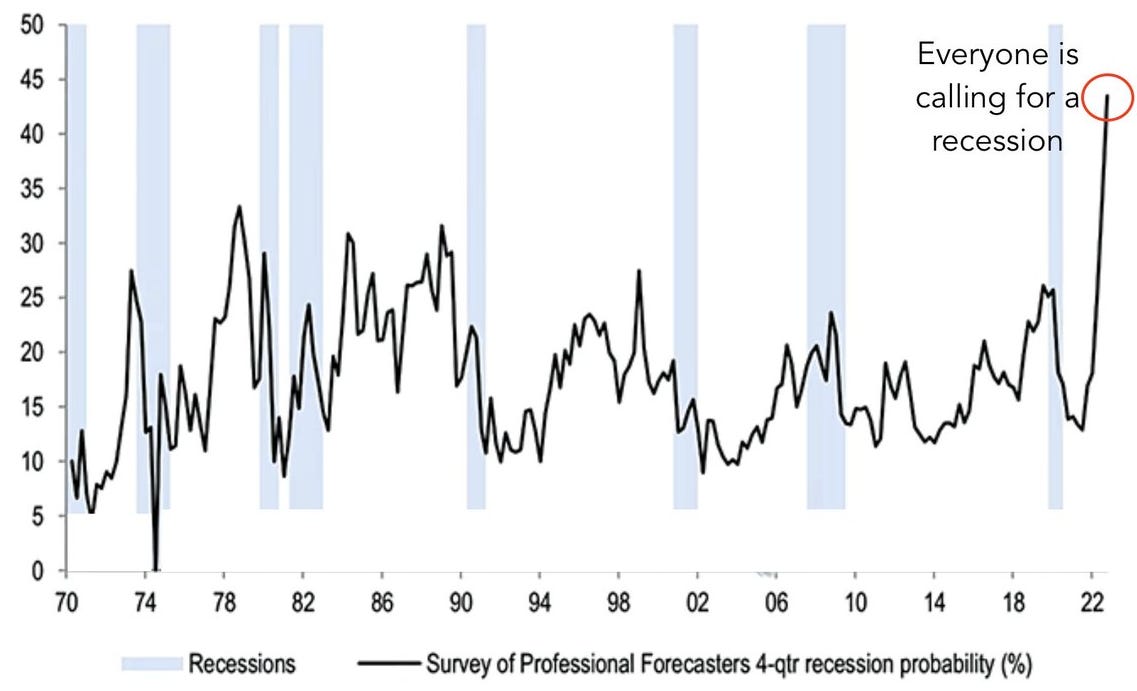
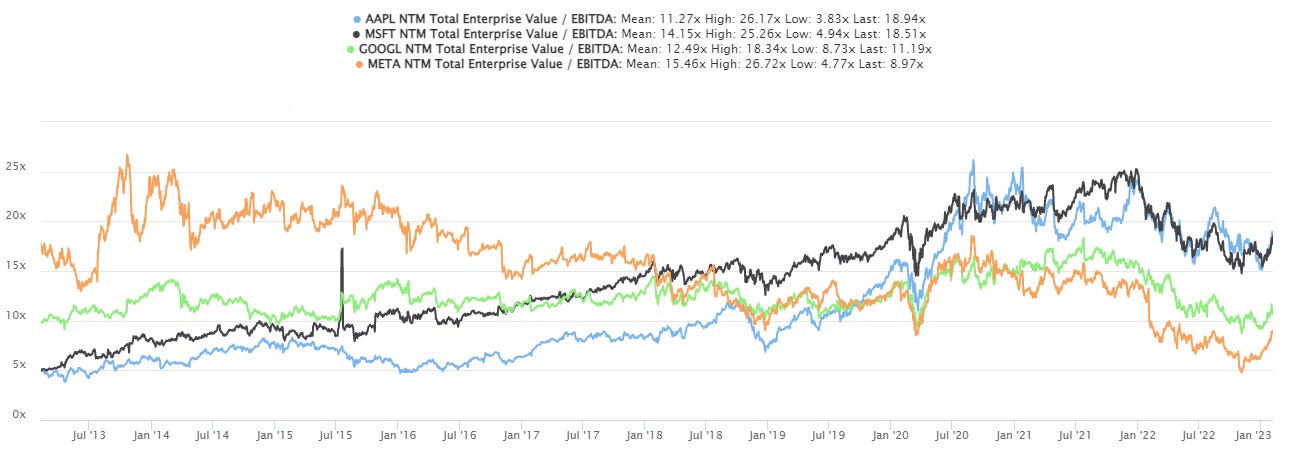
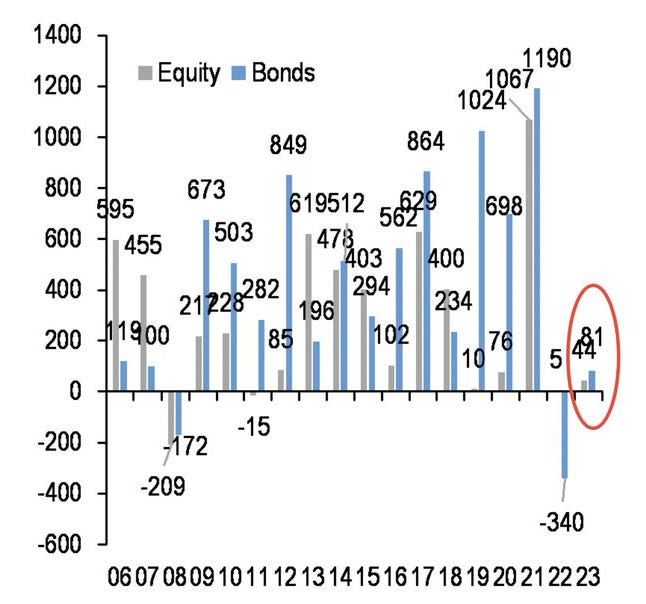
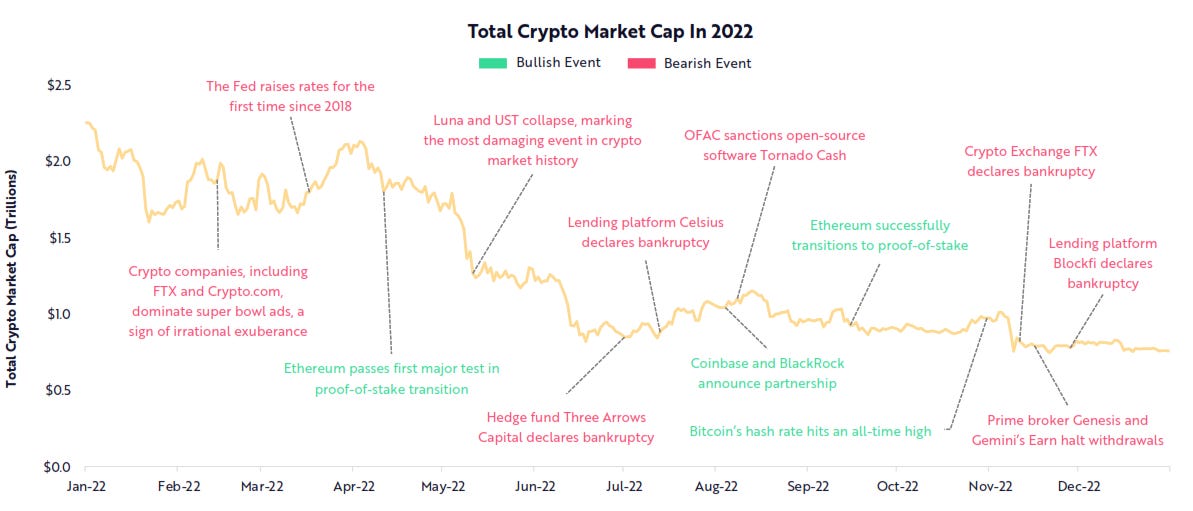
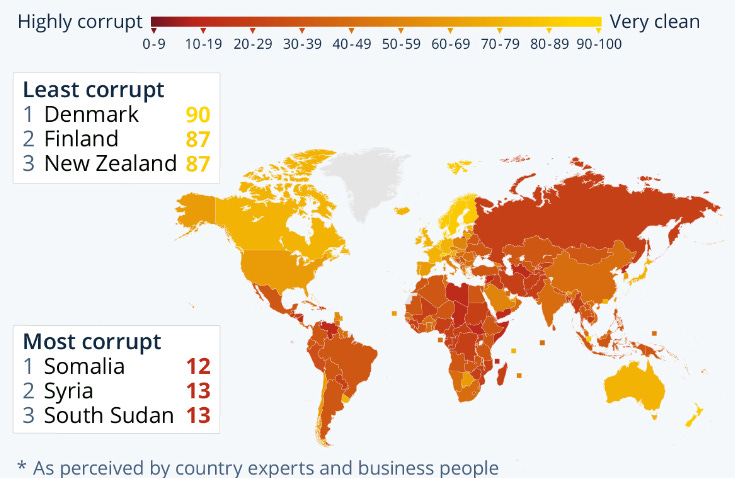
10k Words Equitable Investors February 2023 The "US equity market performance this year can broadly be characterised as a dash for trash," Bespoke declared on Feb 3. Our own analysis of ASX micro-to-mids shows a similar trend - CY2022 losers are now the winners, as are stocks on higher multiples. A case for higher cash rates was charted by Charles Schwab even as Moody's showed inflation is slowing in some countries. FactSet calculated that the decline in the bottom-up EPS estimate recorded during the first month of the first quarter was larger than the 5, 10 and 20 year averages. This follows S&P 500 Q4 GAAP earnings falling 13% year-over-year, as Creative Planning charted. Behind the earnings, JP Morgan found the strongest consensus for a US recession on record. Folkelore Ventures published data on the tough year that was 2022 for Australian VC. In the tech sector we have Apple & Microsoft trading above their 10-year average EV/EBITDA multiples while Google/Alphabet and Meta/Facebook are now below average. JP Morgan reckons households have been deploying into equity and bond funds in early 2023 after underinvesting in 2022. Crypto assets lost $US1.5 trillion in capitalisation says ARK. Finally, we take a look at corruption hot spots via Statista. Russell 1000 Decile Analysis: CY2023-to-date % change
Source: Bespoke
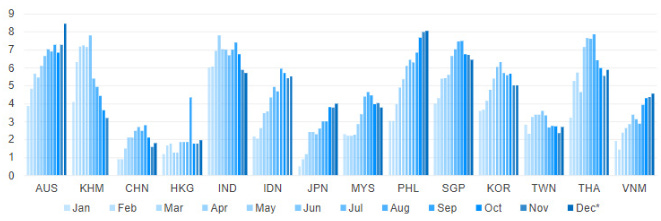
ASX Micro-to-Mids - "Financial, Industrial & Technology" (FIT) factor performance in CY2023-to-date Source: Equitable Investors Proxy Fed Funds Rate Source: Charles Schwab Year-on-year inflation is slowing in some countries Source: Moody's Change in S&P 500 Quarterly EPS: 1st month of quarter Source: FactSet
S&P 500 As Reported (GAAP) EPS Growth (Year-on-Year %) Source: Creative Planning. @CharlieBilello Survey of Professional Forecasters US Recession Probability Source: Pitchbook, Morningstar, @macroalf Australian Venture Capital raisings by number and amount Source: Cut Through Venture, Folkelore Ventures Forward EV/EVITDA multiples over 10 years for tech leaders Source: TIKR, Equitable Investors Global equity & bond fund flows Source: JP Morgan ~$US1.5 trillion wiped out in crypto market capitalisation in 2022 Source: ARK Investment Management Perceived public sector corruption in 2022 Source: Statista, Transparency International February Edition Funds operated by this manager: Equitable Investors Dragonfly Fund Disclaimer Nothing in this blog constitutes investment advice - or advice in any other field. Neither the information, commentary or any opinion contained in this blog constitutes a solicitation or offer by Equitable Investors Pty Ltd (Equitable Investors) or its affiliates to buy or sell any securities or other financial instruments. Nor shall any such security be offered or sold to any person in any jurisdiction in which such offer, solicitation, purchase, or sale would be unlawful under the securities laws of such jurisdiction. The content of this blog should not be relied upon in making investment decisions. Any decisions based on information contained on this blog are the sole responsibility of the visitor. In exchange for using this blog, the visitor agree to indemnify Equitable Investors and hold Equitable Investors, its officers, directors, employees, affiliates, agents, licensors and suppliers harmless against any and all claims, losses, liability, costs and expenses (including but not limited to legal fees) arising from your use of this blog, from your violation of these Terms or from any decisions that the visitor makes based on such information. This blog is for information purposes only and is not intended to be relied upon as a forecast, research or investment advice. The information on this blog does not constitute a recommendation, offer or solicitation to buy or sell any securities or to adopt any investment strategy. Although this material is based upon information that Equitable Investors considers reliable and endeavours to keep current, Equitable Investors does not assure that this material is accurate, current or complete, and it should not be relied upon as such. Any opinions expressed on this blog may change as subsequent conditions vary. Equitable Investors does not warrant, either expressly or implied, the accuracy or completeness of the information, text, graphics, links or other items contained on this blog and does not warrant that the functions contained in this blog will be uninterrupted or error-free, that defects will be corrected, or that the blog will be free of viruses or other harmful components. Equitable Investors expressly disclaims all liability for errors and omissions in the materials on this blog and for the use or interpretation by others of information contained on the blog |
