News

3 Jul 2024 - When the equity markets are misjudging risk focus on what you can control
|
When the equity markets are misjudging risk focus on what you can control Redwheel June 2024 |
|
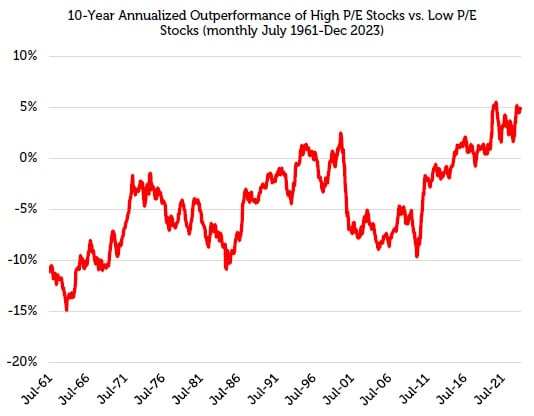
The concept of risk should be simple and straight forward, yet it repeatedly seems to get twisted upside down and back to front, causing bubbles and crashes. For investors, it is the coupling of human behaviour and risk systems that are the root cause of such outcomes. Today, when seven stocks account for 20% of global indices[1], risk seems to have been turned on its head yet again. As excessive valuations and concentration risk in global benchmark indices continue to increase, how can equity investors navigate this environment? We believe the answer lies in accepting what you can control and what you can't. Investors can't control valuations, but they can target income in market conditions where dividends have historically made outsized contributions to total returns. Three quotes that explain how risk can be turned on its head For investors, risk is inseparable from return; both are predicated on an unknowable future. Hence, the risk-free return is usually the lowest: the greater the certainty of future outcomes, the lower both the risk and return. In general, accepting the risk of an uncertain range of future outcomes is necessary to generate a return higher than the risk-free rate. However, it does not guarantee such a return - that's why it is called risk! Therefore, one should strive in an investment process to allocate capital for a range of future outcomes where the probability is skewed towards a favourable return. Naturally this won't always result in a positive outcome. We get things wrong and/or it can take longer to generate a return. The challenge obviously is to get it right more often than not. However, there can be times when, despite leaning the statistics in one's favour, performance can remain sub-par for a period. A coin toss is 50/50 but you can still get a run of heads. Howard Marks wrote, "...human nature makes it hard for many to accept the idea that the willingness to live with some losses is an essential ingredient in investment success". [2] Within active equity management, relative underperformance is "hard for many to accept" despite being "an essential ingredient in investment success". The reasons why are multi-faceted, yet at the kernel of it is a catch created by our own industry. Active managers assume risk in order to generate decent returns. Clients are then told to measure the success of this risk return approach by comparing the outcome to a benchmark. It is therefore assumed that active managers take risk while the benchmark is risk free. Most of the time this makes sense. Within equities, markets are typically rational and accurate at allocating capital, and the risk reward is skewed favourably. However, there are periods where irrationality can take a hold. Benjamin Graham, mentor to Warren Buffett, said: "In the short-run, the stock market is a voting machine, in the long-run, it is a weighing machine". The "weighing" of risk reward becomes replaced by emotion or "voting". It is usually at these times of excessive greed or fear that the benchmarking system turns on its head. In extreme conditions, underperformance becomes magnified and it becomes "hard for many to accept the idea .... to live with some losses". When the herd mentality creates a concentrated market, being different from such a majority feels increasingly wrong. It's at these times, when pressure on fund managers is greatest, that career risk is highest. It's also during these periods that risk systems are most likely to drive investors to move closer to the herd, to the benchmark, in order to reduce the risk of further relative "losses". Yet it is exactly at these times that the understanding of risk is turned on its head. Given the extreme valuations in the benchmark, it is there that the risk is greatest. Despite this, investors are encouraged by emotion and risk systems to invest in the benchmark in an attempt to reduce risk! In the words of Oscar-winning actress Geena Davis: "If you risk nothing, then you risk everything". By trying to reduce risk, you generally succeed only in increasing it. Global equity markets carry considerable risk Right now, equities are a prime example of this inverted appreciation of risk. Once again, the market has become concentrated. A narrow part of the market has created a highly concentrated market. US equities now account for c.70% of the MSCI World index, up from c.30% back in the late 1980's (when as an aside, Japan was c.45% of the MSCI World and is now c.6%!). [3] Within that US dominance, the Magnificent 7 account for c.20% of the MSCI World on their own. Of the S&P 500, the Mag 7 [4] account for c.30% of the index [5], yet only account for 18% of the index's earnings, evidencing the premium valuation applied to these stocks. [6] The chart below illustrates how the market has historically disregarded valuation at extremes (when "voting" takes over), increasing both concentration and risk in the benchmark.
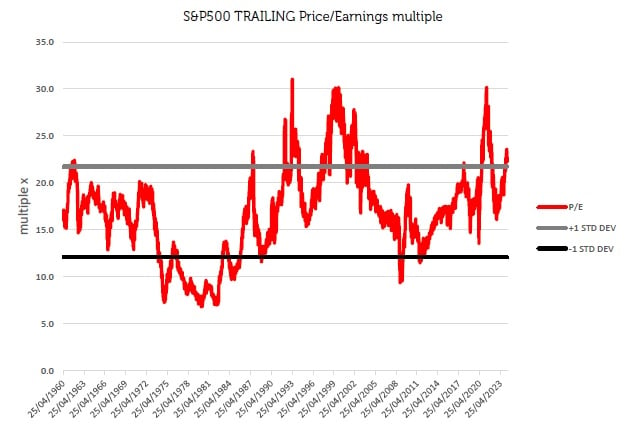
Source: Ken French Data Library, CRSP database, 07/31/1961 - 12/30/2023. Stocks separated into Top Price/Earnings minus Bottom Price/Earnings. The information shown above is for illustrative purposes. Past performance is not a guide to future results. Whether it's the Nifty Fifty bubble in the 1970's or the Magnificent Seven bubble today, the market has repeatedly marched a narrow cohort of the market to excessive valuations, only to see them crash. Yet, it is at these highs and lows, when emotion is dominant, that the pressure is greatest to join the herd. During times of exuberance, when valuation is no longer a concern, investors that follow the benchmark are practically betting on rising valuations. The valuation multiple reflected by the benchmark moves significantly over time, as illustrated by the chart below.
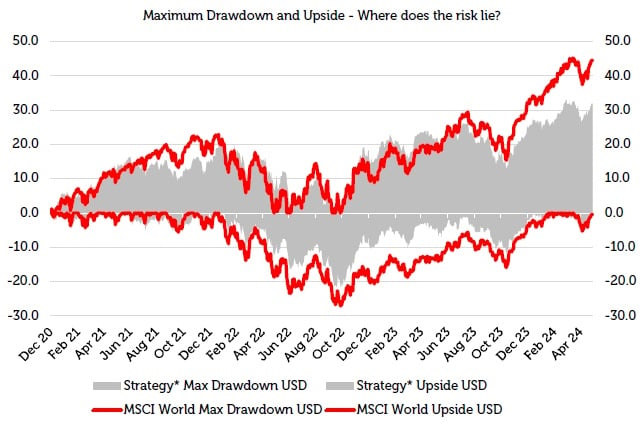
Source: Bloomberg, Redwheel 22 April 2024. The information shown above is for illustrative purposes. Past performance is not a guide to future results. The chart shows that the aggregate price to earnings (P/E) of the S&P 500 since 1960 has spanned a low of 8x to a high of 30x. Today the S&P 500 is above one standard deviation from the average over this period, driven primarily by just seven stocks. The valuation can be influenced by an almost inexhaustible list of things - sentiment, psychology, media, macro events, interest rates, politicians, wars and many more - but it can't be controlled. Despite this, at the extremes when the pressure is greatest to join the herd, investors are simply betting that the valuations will keep rising. Effectively, they are betting on something that is beyond their control, which continues to increase risk while they attempt to reduce it. The chart below demonstrates this well. It shows the maximum drawdowns and upswings in the Redwheel Global Equity Income Strategy (USD) since re-launch in December 2020, compared to the same for the MSCI World index (USD).
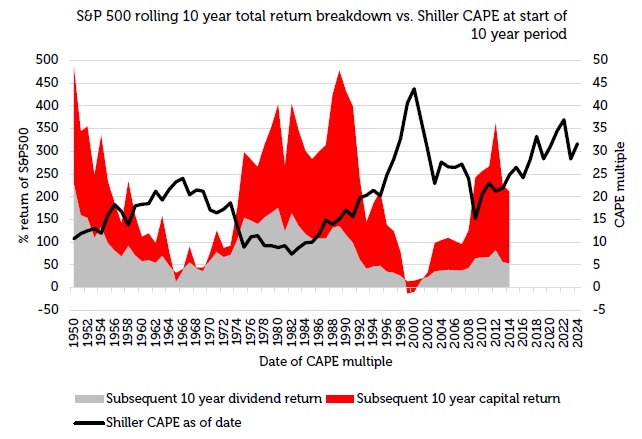
Source: Bloomberg, Redwheel 22 April 2024. The information shown above is for illustrative purposes. Past performance is not a guide to future results. *Please see the disclaimer at the end of this document for further information on the Representative Portfolio. It shows clearly that the moves have fluctuated more in the index than in the strategy. For the most part, the strategy lags during the upswings, but outperforms during the drawdowns. Yet, because the benchmark is seen as lower risk by risk management systems, and due to our own encouragement as an industry, adhering to the benchmark to reduce risk after a period of relative underperformance typically achieves the complete opposite. Focus on what you can control: durable dividends The chart below shows how the periods where emotions ("voting") dominate fundamentals ("weighing") can drive changes in the composition of total returns.
Source: Source: Bloomberg for S&P500 / Shiller Cyclically Adjusted Price to Earnings Ratio (CAPE) www.multpl.com/shiller-pe/table/by-month 31st December 2023. The information shown above is for illustrative purposes. Past performance is not a guide to future results. The chart shows the rolling 10-year returns (USD) for the S&P 500. One can see that the composition of the total return over the rolling 10-year periods changes meaningfully. Sometimes capital return dominates, sometimes the dividend return. The capital return is driven by earnings growth and the multiple applied to those earnings (valuation), which as discussed earlier, are beyond investors' control. However, the dividend return can be controlled. Active managers can invest in companies that aim to deliver durable dividends. Those dividends can then be reinvested to compound a return to drive the total return over time. Of note from the chart above, is that the cycle of the composition of total returns over rolling 10-year periods tends to correlate with the current valuation (Shiller Cyclically Adjusted P/E - CAPE) at the start of the period. The higher the starting valuation, the greater the probability that the next 10 years' total return will be driven by the dividend component, the lower the starting valuation and it is the capital that will likely dominate. Thus, in the current market, where valuations are high, where the last 10-year period has been driven by capital gains, where concentration has once again peaked, many investors are being encouraged by emotions and risk systems to herd into the most uncontrollable, more volatile aspect of total returns to reduce risk! Instead, we believe investors should be focusing upon what is achievable, what is within their control: durable dividends, compounded over time. The less volatile path over time. This is what the Redwheel Global Equity Income Strategy is focused on to deliver robust total returns over time. We focus on what we have a degree of control over: dividends and the yield we get on them.
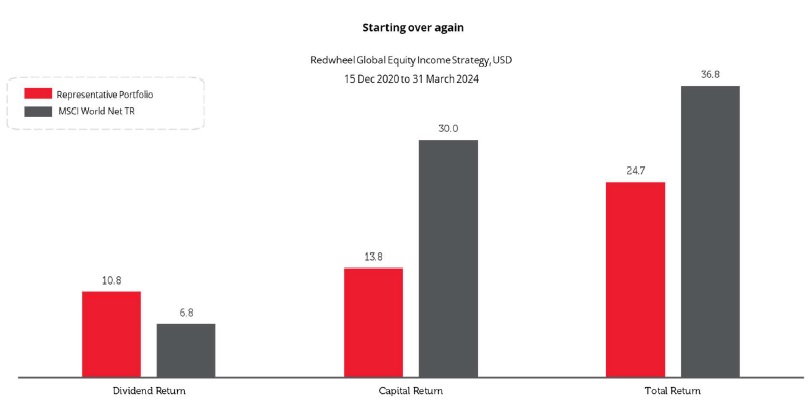
Source: Redwheel, Bloomberg, 31 March 2024 ,USD Dividend yields should drive total returns from here Since resuming the strategy at Redwheel, already the income contribution is greater than the market[1], despite compounding that income at a far lower rate than the market. [7] That is because of the higher starting yield. Given where risk really resides today, we believe that over time, the capital return element of the strategy will normalise in line with the market, allowing the compounding of dividends yields to drive long-term outperformance. Today's relative losses reflect our "willingness to live with some losses [as] an essential ingredient in investment success". However, it is precisely at times like today when it is most appropriate to invest in a strategy like ours that focuses on what can be controlled, rather than the benchmark, where risk has been turned on its head. |
|
Funds operated by this manager: Redwheel China Equity Fund, Redwheel Global Emerging Markets Fund |
|
[1] Source: Factset end of March 2024. [2] Howard Marks, Fewer Losers, or More Winners? Memo September 2023. [3] Source: Factset end of March 2024. [4] Microsoft, Amazon, Google (Alphabet), Tesla, Facebook (Meta), Nvidia and Apple [5] Source: Factset end of March 2024. [6] Source: Factset end of March 2024. [7] MSCI World Net TR index Key Information |

2 Jul 2024 - Bull and bear case for Australian shares in the New Financial Year
|
Bull and bear case for Australian shares in the New Financial Year Airlie Funds Management May 2024 |
|
It's coming to that time of year when equity market strategists and the financial media will start issuing their forecasts for the performance of the stock market in FY25. Airlie's view is to ignore them. Their predictions (like most predictions) are usually wrong.
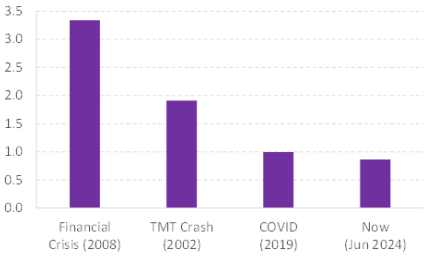
Despite all these events, global equity markets have risen. The S&P/ASX 200 Accumulation index (which includes dividends) has delivered a total return of 47% or 8% per annum [1]. In Airlie's view, the past five years have shown that buying and selling stocks based on a view of the market's impending movements is a fool's game. In this article, Airlie avoids predicting where the market is going to be in 12 months and instead focuses on three reasons for investors to be bullish on Australian equities in FY25 and three reasons to be bearish. BULL CASE FOR AUSTRALIAN EQUITIES1. Corporate balance sheets in good shape Many Australian investors have lived in a period of declining and ultra-low interest rates. Before the RBA's first interest-rate hike in May 2022, the public had not experienced an increase in interest rates since November 2010, and that cycle only saw the cash rate increase from 3% to 4.75%. To find a rate-hiking cycle of equivalent magnitude today, investors would have to go back more According to Airlie, the rise in interest rates over the last two years could be seen as a reminder for investors of the opportunity cost of capital and the value of conservative capital structures. Airlie's view is that when rates were low, debt was considered 'free' and helped prop up risky companies as investors chased greater returns in speculative companies, while other companies were encouraged to take on large amounts of debt to fund acquisitions and growth with no consequence of increasing financial risk. This era of 'free money' is over and balance sheets now matter. Airlie's view is that corporate balance sheets across the ASX 200 in general look in good shape. The chart below shows the leverage ratio of the average industrial company in the ASX 200 today versus previous economic cycles. At less than 1.0x Net Debt/EBITDA, corporate balance sheets look healthy to Airlie. Airlie considers this suggests that Australia's largest companies could be well placed to handle any adverse bumps the economic cycle, competitors or internal issues may throw at them.
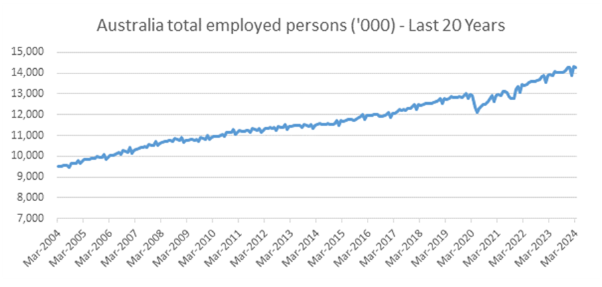
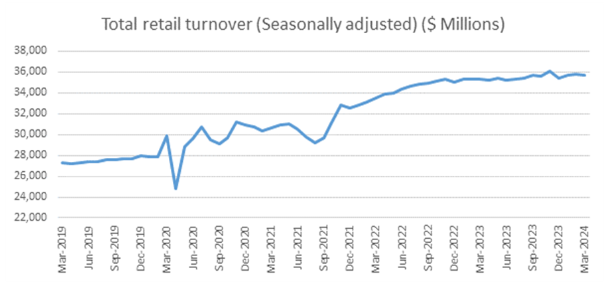
2. Domestic profit pools often supported by a handful of players The grocery sector, where two major supermarket chains account for about 65% of the market. Contrast this with the UK, where the top two grocers account for 43% of the market, and the US, where the four largest supermarket chains have a combined share of 34% [2]. The banking sector, where the four major banks account for over 70% of the home-loan market in Australia [4]. Airlie's view is that this concentration can potentially be a positive for investors in large-cap Australian equities in that they can put their money behind industry-leading companies that have a low risk of being disrupted by competition. Historically these businesses tend to have a track record of stable returns and market-share gains versus their smaller rivals. 3. Australia's place in the world only getting better When we look through a global lens, Australia has a lot going for it - a beautiful place to live, a safe, strong rule of law, and high-quality education. In Airlie's view, even the much-grumbled-about house prices still means some people can buy a house and not a shoebox apartment in capital cities. Australia continues to attract people and capital, both providing a long-term tailwind for the economy. This is best reflected in Australian Bureau of Statistics (ABS) data (see charts below) showing that compared to pre-COVID-19, an additional 1.35 million people are employed in the country (a 10% increase) [5]. This compares favourably to other developed economies like the UK, where the total labour force has increased by just 1% over the same period [6]. Airlie's view is that growth in employed persons translates directly into spending and this has provided a tailwind for Australia's consumer-facing sectors despite cost-of-living pressures. Total retail sales have increased by 30% over the last five years [7]. According to Airlie, the looming tax cuts for individual workers in Australia in FY25 are likely to bolster retail spending and support those companies relying on the domestic consumer.
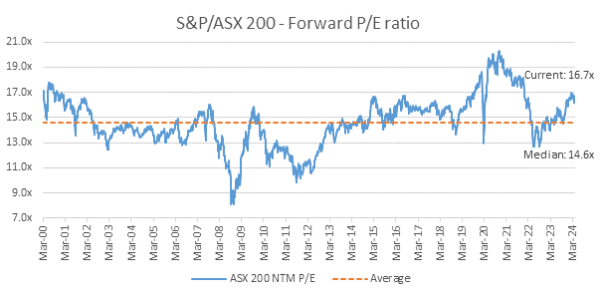
THE BEAR CASE FOR AUSTRALIAN EQUITIES1. Valuations for publicly listed companies have re-rated higher In Airlie's view, higher company valuations reduce the prospect of near-term upside for investors. The rally in equity markets over the past 12 months reflects a level of optimism about 'peak' interest rates and the need to see further evidence for the market to continue re-rating higher. The ASX 200 is currently trading above its long-term median Price Earnings multiple of 14.6 times [8]. This suggests to Airlie that companies in general are valued positively and it's clearly not the "cheap" market Within this aggregate, however, there may still be individual businesses that look attractive, and investors could have to dig for mispriced opportunities.
Source: Factset 2. High cost of living is gaining political attention In Airlie's opinion, concentrated domestic oligopolies can potentially be good for investors. But in an environment where consumers are under pressure, some oligopolies could come under threat from politicians. For example, there have been recent accusations of profiteering levelled at the domestic supermarkets. Airlie would not be surprised if the government turned its attention to other concentrated sectors, so as to be seen to be tackling the cost-of-living crisis. Even if there is no immediate change to regulation of these sectors, Airlie 3. Stick Inflation In Airlie's view, interest rates may well remain elevated, or worse - they may even increase in the coming year. The optimism embedded in sharemarket valuations is predicated on a narrative of peak rates. Any evidence of inflation persisting above the RBA's target range of 2-3% may lead investors to reprice securities lower to reflect a higher cost of capital. To date, the Australian economy has been strong with elevated migration and record-low unemployment supporting demand. And on the supply side, the cost of the energy transition and the restructuring of global trade (away from China) could continue to act as inflationary forces that may well be structural. ConclusionWhile Airlie doesn't have a crystal ball for what 2025 will have in store for the Australian sharemarket, we believe investing in companies with strong balance sheets, and that are market leaders with pricing power, may help drive returns over the long term. Author: Vinay Ranjan Funds operated by this manager: [1] FactSet - ASX 200 total return 5 years to 3 May 2024 Important Information: Units in the fund(s) referred to herein are issued by Magellan Asset Management Limited (ABN 31 120 593 946, AFS Licence No. 304 301) trading as Airlie Funds Management ('Airlie') and has been prepared for general information purposes only and must not be construed as investment advice or as an investment recommendation. This material does not take into account your investment objectives, financial situation or particular needs. This material does not constitute an offer or inducement to engage in an investment activity nor does it form part of any offer documentation, offer or invitation to purchase, sell or subscribe for interests in any type of investment product or service. You should obtain and consider the relevant Product Disclosure Statement ('PDS') and Target Market Determination ('TMD') and consider obtaining professional investment advice tailored to your specific circumstances before making a decision to acquire, or continue to hold, the relevant financial product. A copy of the relevant PDS and TMD relating to an Airlie financial product or service may be obtained by calling +61 2 9235 4760 or by visiting www.airliefundsmanagement.com.au. Past performance is not necessarily indicative of future results and no person guarantees the future performance of any financial product or service, the amount or timing of any return from it, that asset allocations will be met, that it will be able to implement its investment strategy or that its investment objectives will be achieved. This material may contain 'forward-looking statements'. Actual events or results or the actual performance of an Airlie financial product or service may differ materially from those reflected or contemplated in such forward-looking statements. This material may include data, research and other information from third party sources. Airlie makes no guarantee that such information is accurate, complete or timely and does not provide any warranties regarding results obtained from its use. This information is subject to change at any time and no person has any responsibility to update any of the information provided in this material. Statements contained in this material that are not historical facts are based on current expectations, estimates, projections, opinions and beliefs of Airlie. Such statements involve known and unknown risks, uncertainties and other factors, and undue reliance should not be placed thereon. Any third party trademarks contained herein are the property of their respective owners and Airlie claims no ownership in, nor any affiliation with, such trademarks. Any third party trademarks that appear in this material are used for information purposes and only to identify the company names or brands of their respective owners. No affiliation, sponsorship or endorsement should be inferred from the use of these trademarks.. This material and the information contained within it may not be reproduced, or disclosed, in whole or in part, without the prior written consent of Airlie. |

1 Jul 2024 - Performance Report: ASCF High Yield Fund
[Current Manager Report if available]

1 Jul 2024 - Glenmore Asset Management - Market Commentary
|
Market Commentary - May Glenmore Asset Management June 2024 Equity markets were stronger in May. In the US, the S&P 500 rose +4.8%, whilst the Nasdaq was also very strong, up +6.9%. In the UK, the FTSE rose +1.6%. Of note, more than half of the S&P 500's gain was due to four mega cap tech stocks (Nvidia +26%, Apple +13%, Microsoft +7%, and Alphabet +6%). On the ASX, the All-Ordinaries Accumulation Index materially lagged the US indices, rising +0.9%. Technology was the top performing sector (assisted by strong results from Xero and Technology One). Banks also performed well, due to a better than feared reporting season. Telecommunications was the worst performer, dragged down by the underperformance of Telstra. Economic data released from the US in May was generally softer than expected: GDP growth weakened to +1.3%, whilst the April jobs report was also lower than expected. Unemployment remained at 3.9% (almost a 50 year low). Fed Fund Futures are now pricing in a 60% chance of a rate cut at the September Federal Open Market Committee (FOMC) meeting. In bond markets, yields were relatively flat during the month. The US 10-year government bond rate declined - 6 basis points to close at 4.57%, whilst its Australian counterpart was stable, closing at 4.41%. Funds operated by this manager: |

28 Jun 2024 - Hedge Clippings | 28 June 2024
|
|
|
|
Hedge Clippings | 28 June 2024 Like it or not, this week's inflation figures confirmed an unpleasant reality: The RBA is now closer to raising rates than cutting them. Although it was only the monthly number, inflation inched up in April to 3.6%, from 3.5% in March, but then jumped to 4.0% in May. Seasonally adjusted, May's number is a tad higher at 4.1%; excluding volatile items, such as fruit, veg and fuel, also came in at 4.0% (actually down 0.1%), while the Annual Trimmed Mean figure jumped 0.3% to 4.4%. The RBA's task (although out of their direct control) might be helped by figures released yesterday showing job vacancies falling 2.7% in May, and are now down 26% since their post COVID peak in May 2022. That's it for the hard numbers, but where does it leave the RBA? Let's put it this way, the narrow path is getting narrower, to the extent we'd say they're more like walking a tightrope. The challenge for the RBA is that they have a two speed economy, or two sections (at least) of it, each of which is affected differently in the current economic times. Those on lower incomes, or reliant on assistance of some sort, are feeling the pinch, so the government is "splashing the cash" to save them. Meanwhile, more fortunate sections of the community, such as those with higher incomes, or possibly baby boomers enjoying the fruits of their previous labour, or those with the good management or fortune to have paid off their mortgage, have spending patterns that are relatively unaffected by inflation of 4%. So while the RBA is aiming on taming persistent inflation using the only tool at their disposal - trimming demand to match supply - their task is being made more difficult by a government that is trying to soften the inflationary blow, particularly for those less well off, and those hurting as a result of that inflation, including higher mortgage or rental costs, and sky high power bills. Hence Canberra's support for across the board wage increases for 2.6m lower paid workers, and tax cuts and power subsidies for all, each of which kick in from next Monday. In its effort to please those doing it tough, the government is not helping the RBA. Rather, it is helping to fuel inflation, whether it be via tax cuts or income support. That may be helping some people, but it is not helping the RBA. We were always taught that things work best when everyone pulls on the same rope, and in the same direction. This looks more like they're pulling from opposite ends. Which takes us back to the old saying, which according to the Bob Dylan song, can be attributed to Abraham Lincoln: "You can please some of the people all the time, or all of the people some of the time, but you can't please all of the people, all of the time." The government's dilemma is not helped by the fact that there's a countdown to an election due either next May (half Senate) or in September for the House of Representatives. So pencil in sometime between now and 24th of May next year for both. Albo will be desperate not to risk being remembered as a one-term wonder, so it was notable that Treasurer Jim Chalmers was this week spruiking a second successive budget surplus under a Labor government, while carefully avoiding to mention the impending fiscal cliff thereafter. Don't rule out an earlier date if they see things getting stickier. Of course, as pointed out by the new RBA Deputy Governor Andrew Hauser (a.k.a. the first central banker with a rare sense of humour) in this presentation to the Citi A50 Australian Economic Forum last night. While the board is limited to influencing demand via monetary policy, they take a wide range of data into account when making their decisions. First and foremost on the list though is inflation, so watch out for their next rate decision due on Tuesday 6th of August. By next week we may have a topic other than inflation and interest rates to consider. The first debate between Biden and Trump has just concluded, with early indications Biden faltered badly on occasions, but landed a strong blow with his accusation (presumably well practised) that Trump has the morals of an alley cat. Expect snippets of both to be repeated ad infinitum in respective TV ads between now and November. News & Insights 10k Words | Equitable Investors Australian Secure Capital Fund - Market Update | Australian Secure Capital Fund May 2024 Performance News Digital Income Fund (Digital Income Class) Emit Capital Climate Finance Equity Fund Insync Global Capital Aware Fund Insync Global Quality Equity Fund |
|
|
If you'd like to receive Hedge Clippings direct to your inbox each Friday |

28 Jun 2024 - Performance Report: PURE Resources Fund
[Current Manager Report if available]

28 Jun 2024 - Performance Report: Cyan C3G Fund
[Current Manager Report if available]

28 Jun 2024 - It doesn't look like the RBA is planning to join the global rate-cuts club soon
|
It doesn't look like the RBA is planning to join the global rate-cuts club soon Pendal June 2024 |
|
AS expected, there was no rate change from the Reserve Bank today. We believe changes are more likely to happen at RBA meetings where updated forecasts are released in the form of their Statement on Monetary Policy. Those meetings are held in February, May, August and November. What did we get out of today's statement? There are a lot of known unknowns at the RBA at the moment:
The central bank rate-cut club has increased its membership in recent months. The Bank of Canada and the European Central Bank both joined the club this month, easing by 0.25% each. Existing club members include the Swiss National Bank and Sweden's Riksbank. Anyone looking for Australia to join the club soon would be disappointed, however. The final paragraph from today's RBA note said: "Inflation is easing but has been doing so more slowly than previously expected and it remains high. "The Board expects that it will be some time yet before inflation is sustainably in the target range." So the RBA is not ruling anything in or out. Rate hikes? We see this as highly unlikely. What the RBA is looking forThe RBA needs to see inflation moving sustainably towards its target before easing policy. Instead, right now it sees excess demand in the economy and a tight labour market. There is now a higher risk of an RBA policy mistake caused by holding policy too tight, for too long. The RBA is now reactive to past data. Gone are the days of relying on forecasts resulting in policy changes. That is a scenario they are more comfortable with, however. Easing policy too soon - without inflation properly contained - is the death knell for any central banker. Author: Steve Campbell head of cash strategies. |
|
Funds operated by this manager: Pendal Focus Australian Share Fund, Pendal Global Select Fund - Class R, Pendal Horizon Sustainable Australian Share Fund, Pendal MicroCap Opportunities Fund, Pendal Sustainable Australian Fixed Interest Fund - Class R, Regnan Global Equity Impact Solutions Fund - Class R, Regnan Credit Impact Trust Fund |
|
This information has been prepared by Pendal Fund Services Limited (PFSL) ABN 13 161 249 332, AFSL No 431426 and is current as at December 8, 2021. PFSL is the responsible entity and issuer of units in the Pendal Multi-Asset Target Return Fund (Fund) ARSN: 623 987 968. A product disclosure statement (PDS) is available for the Fund and can be obtained by calling 1300 346 821 or visiting www.pendalgroup.com. The Target Market Determination (TMD) for the Fund is available at www.pendalgroup.com/ddo. You should obtain and consider the PDS and the TMD before deciding whether to acquire, continue to hold or dispose of units in the Fund. An investment in the Fund or any of the funds referred to in this web page is subject to investment risk, including possible delays in repayment of withdrawal proceeds and loss of income and principal invested. This information is for general purposes only, should not be considered as a comprehensive statement on any matter and should not be relied upon as such. It has been prepared without taking into account any recipient's personal objectives, financial situation or needs. Because of this, recipients should, before acting on this information, consider its appropriateness having regard to their individual objectives, financial situation and needs. This information is not to be regarded as a securities recommendation. The information may contain material provided by third parties, is given in good faith and has been derived from sources believed to be accurate as at its issue date. While such material is published with necessary permission, and while all reasonable care has been taken to ensure that the information is complete and correct, to the maximum extent permitted by law neither PFSL nor any company in the Pendal group accepts any responsibility or liability for the accuracy or completeness of this information. Performance figures are calculated in accordance with the Financial Services Council (FSC) standards. Performance data (post-fee) assumes reinvestment of distributions and is calculated using exit prices, net of management costs. Performance data (pre-fee) is calculated by adding back management costs to the post-fee performance. Past performance is not a reliable indicator of future performance. Any projections are predictive only and should not be relied upon when making an investment decision or recommendation. Whilst we have used every effort to ensure that the assumptions on which the projections are based are reasonable, the projections may be based on incorrect assumptions or may not take into account known or unknown risks and uncertainties. The actual results may differ materially from these projections. For more information, please call Customer Relations on 1300 346 821 8am to 6pm (Sydney time) or visit our website www.pendalgroup.com |

27 Jun 2024 - Performance Report: PURE Income & Growth Fund
[Current Manager Report if available]

27 Jun 2024 - Performance Report: Insync Global Quality Equity Fund
[Current Manager Report if available]
