News

2 May 2023 - Stock Story: QBE Insurance
|
Stock Story: QBE Insurance Airlie Funds Management April 2023 |
|
Quality management and strong cycle leading business turnaround. QBE is a global commercial insurance provider. The stock is a position we first added to the portfolio in September 2022. This is a company that for a long period had failed to pass almost every step in our process - business quality, financial strength, management quality and valuation. The impetus to revisit the stock was twofold - we liked the medium-term outlook for insurance pricing and the company announced the appointment of a new CEO with a fantastic reputation, Andrew Horton. Insurance pricing is cyclical and alternates between periods of soft and hard market conditions. Several years of above-trend catastrophe events (CATs), as well as covid-related business interruption claims and the return of broad-based inflation, has seen the commercial insurance market tighten considerably. The net has been a prolonged period of premium rate growth not seen since the early 2000s. The cycle looks poised to continue (albeit at a lower rate of growth) as insurers digest and push through the impact of reinsurance rate increases, and continue to price for an inflationary environment. (refer to the premium rate change chart over time at the end). QBE's calendar year 2022 result arguably represented the first reporting period in which investors could plainly see the improved operating performance of the business. Gross written premiums (GWP) grew 13%, inclusive of an average group-wide renewal rate increase of 8%. The company reported GWP growth of 13% constant currency and an underlying combined operating ratio (COR) of 93.7%. Pleasingly, QBE's North American division reported a COR of 98.9%, the division's first profitable result since 2018. The result in North America came despite a weaker-than-average year in the crop insurance business and is consistent with management's focus on portfolio remediation in property programs and growing the retail business to drive scale benefits. At a group level, cost discipline and operating leverage (in a strong rate environment) saw a material improvement in the company's expense ratio, from 13.3% to 12.4%. CATs came in line with November guidance, albeit ~$100m (10%) higher than the original FY22 allowance. QBE reported a 4.1% running yield for the fixed income portfolio to end the period, which is clearly a material tailwind for FY23 (and will support QBE's expectations of a mid-teen ROE). QBE's regulatory capital ratio increased from 1.75x to 1.79x, with debt to total capital reducing from 24.1% to 23.4%, the lowest level in over a decade. Source: company filings
Author: Joe Wright, Senior Investment Analyst Funds operated by this manager: Important Information: Units in the fund(s) referred to herein are issued by Magellan Asset Management Limited (ABN 31 120 593 946, AFS Licence No. 304 301) trading as Airlie Funds Management ('Airlie') and has been prepared for general information purposes only and must not be construed as investment advice or as an investment recommendation. This material does not take into account your investment objectives, financial situation or particular needs. This material does not constitute an offer or inducement to engage in an investment activity nor does it form part of any offer documentation, offer or invitation to purchase, sell or subscribe for interests in any type of investment product or service. You should obtain and consider the relevant Product Disclosure Statement ('PDS') and Target Market Determination ('TMD') and consider obtaining professional investment advice tailored to your specific circumstances before making a decision to acquire, or continue to hold, the relevant financial product. A copy of the relevant PDS and TMD relating to an Airlie financial product or service may be obtained by calling +61 2 9235 4760 or by visiting www.airliefundsmanagement.com.au. Past performance is not necessarily indicative of future results and no person guarantees the future performance of any financial product or service, the amount or timing of any return from it, that asset allocations will be met, that it will be able to implement its investment strategy or that its investment objectives will be achieved. This material may contain 'forward-looking statements'. Actual events or results or the actual performance of an Airlie financial product or service may differ materially from those reflected or contemplated in such forward-looking statements. This material may include data, research and other information from third party sources. Airlie makes no guarantee that such information is accurate, complete or timely and does not provide any warranties regarding results obtained from its use. This information is subject to change at any time and no person has any responsibility to update any of the information provided in this material. Statements contained in this material that are not historical facts are based on current expectations, estimates, projections, opinions and beliefs of Airlie. Such statements involve known and unknown risks, uncertainties and other factors, and undue reliance should not be placed thereon. Any third party trademarks contained herein are the property of their respective owners and Airlie claims no ownership in, nor any affiliation with, such trademarks. Any third party trademarks that appear in this material are used for information purposes and only to identify the company names or brands of their respective owners. No affiliation, sponsorship or endorsement should be inferred from the use of these trademarks.. This material and the information contained within it may not be reproduced, or disclosed, in whole or in part, without the prior written consent of Airlie. |

1 May 2023 - 10k Words | April 2023
|
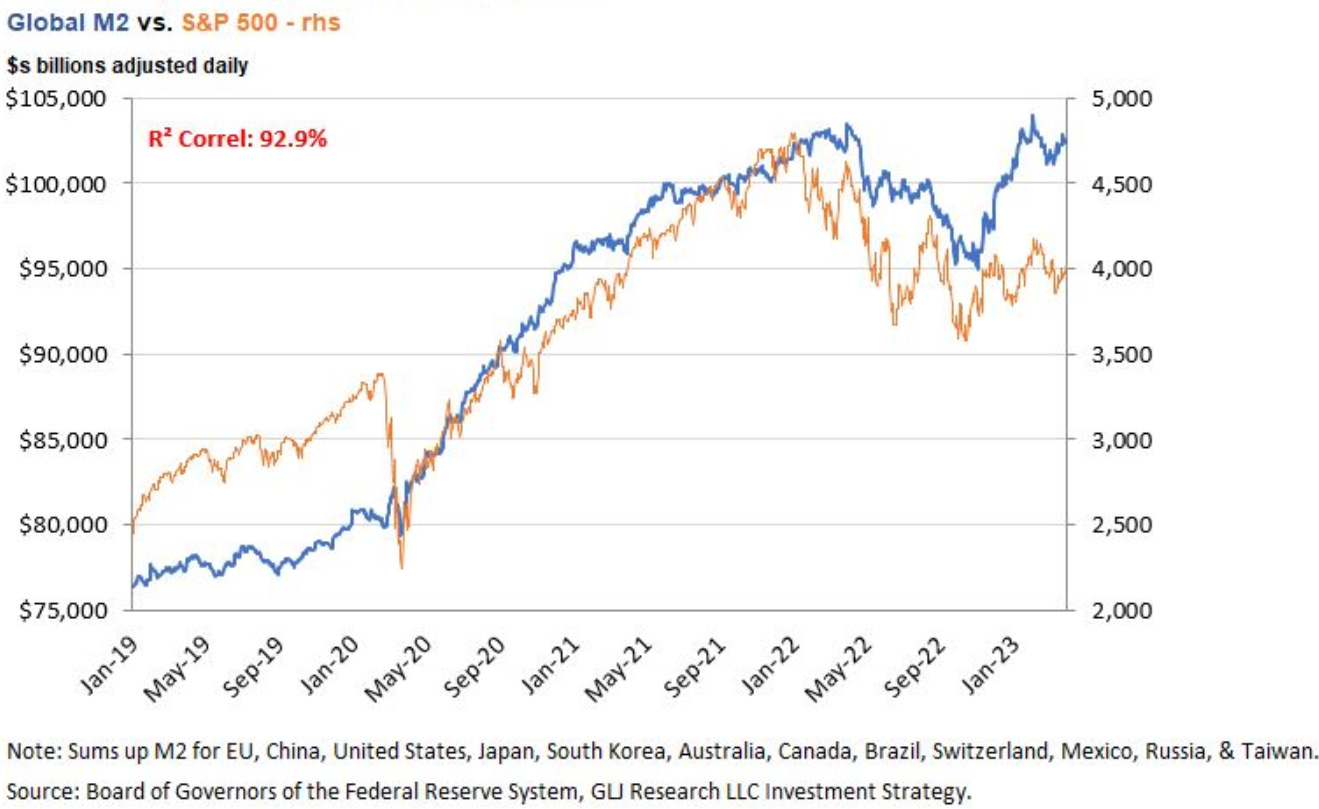
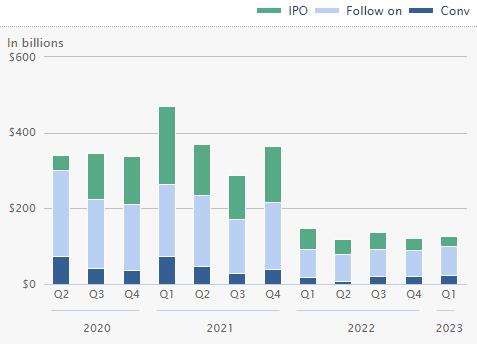
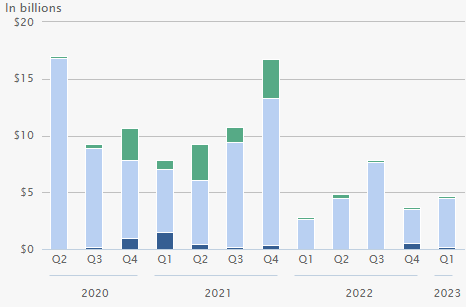
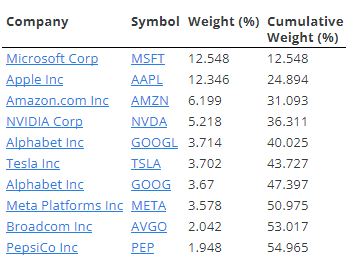
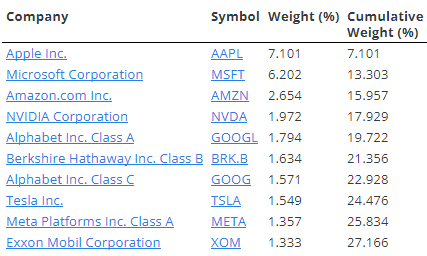
10k Words Equitable Investors April 2023 Funds continue to flow into equities despite recent volatility and recession fears, with Barclays noting fund flows lag performance. Performance is highly correlated with money supply, notes GLJ Research, and central bank liquidity may actually have been increasing lately according to Citi Research. The "Buy the Dip" mantra helps, as Bloomberg charts this strategy's recent success. Despite equity markets holding up, capital raising remains suppressed relative to dealogic's 2020 and 2021 figures. WSJ highlighted aerospace and defence technology as an area where there does appear to be strong capital flows. US banks, however, have seen deposit outflows, as charted here by Reuters. Margins have blown out on ASX-listed debt and hybrids, as per Bell Potter charts, which are largely issued by banks and financials. Bond market volatility is at historically high levels as seen from Bespoke and FT charts. Back in equities, the concentration of major indices stands out and Equitable Investors has pulled together top ten stats. The S&P 500 would have been down in March without "big tech", eToro highlights. US households supporting flows to equities despite recession risk 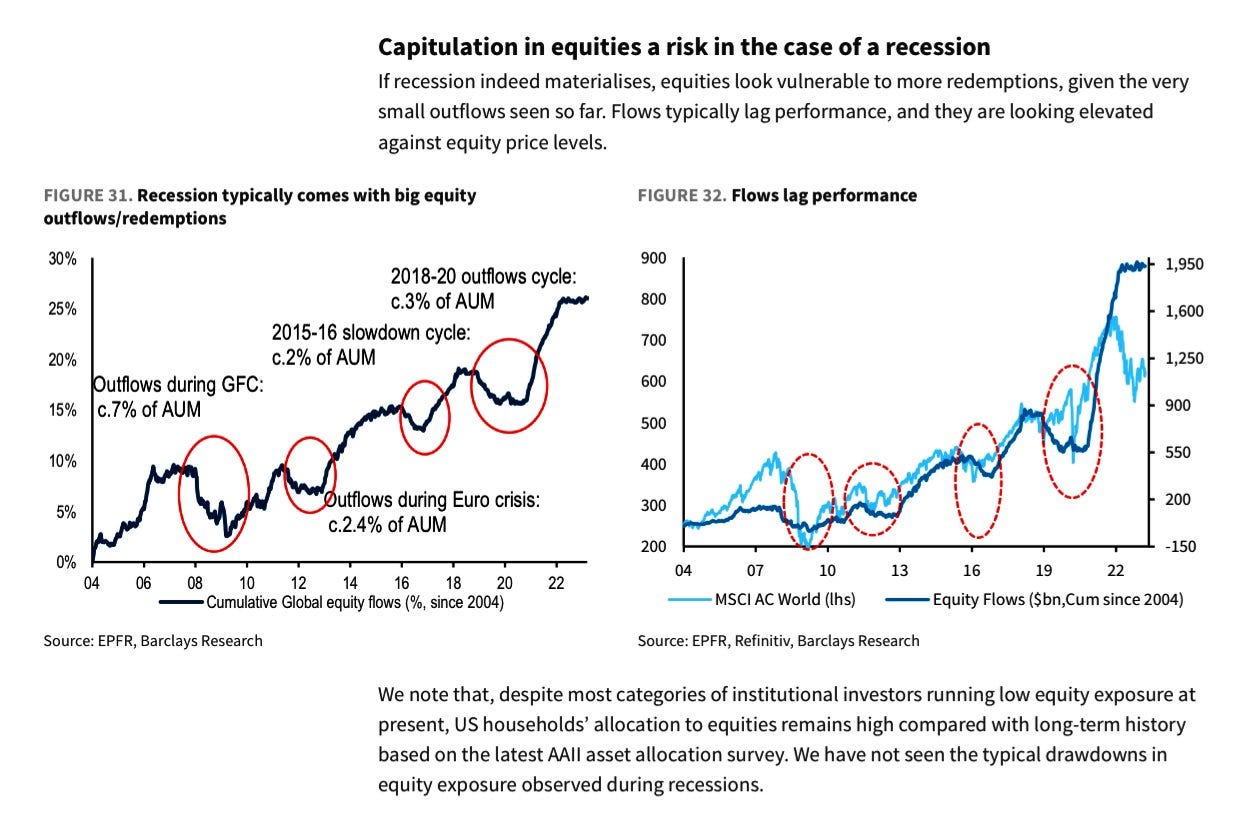
Source: Barclays Research Money Supply (M2) has high correlation with S&P 500
Source: GLJ Research Global central bank liquidity has been increasing according to Citi Research 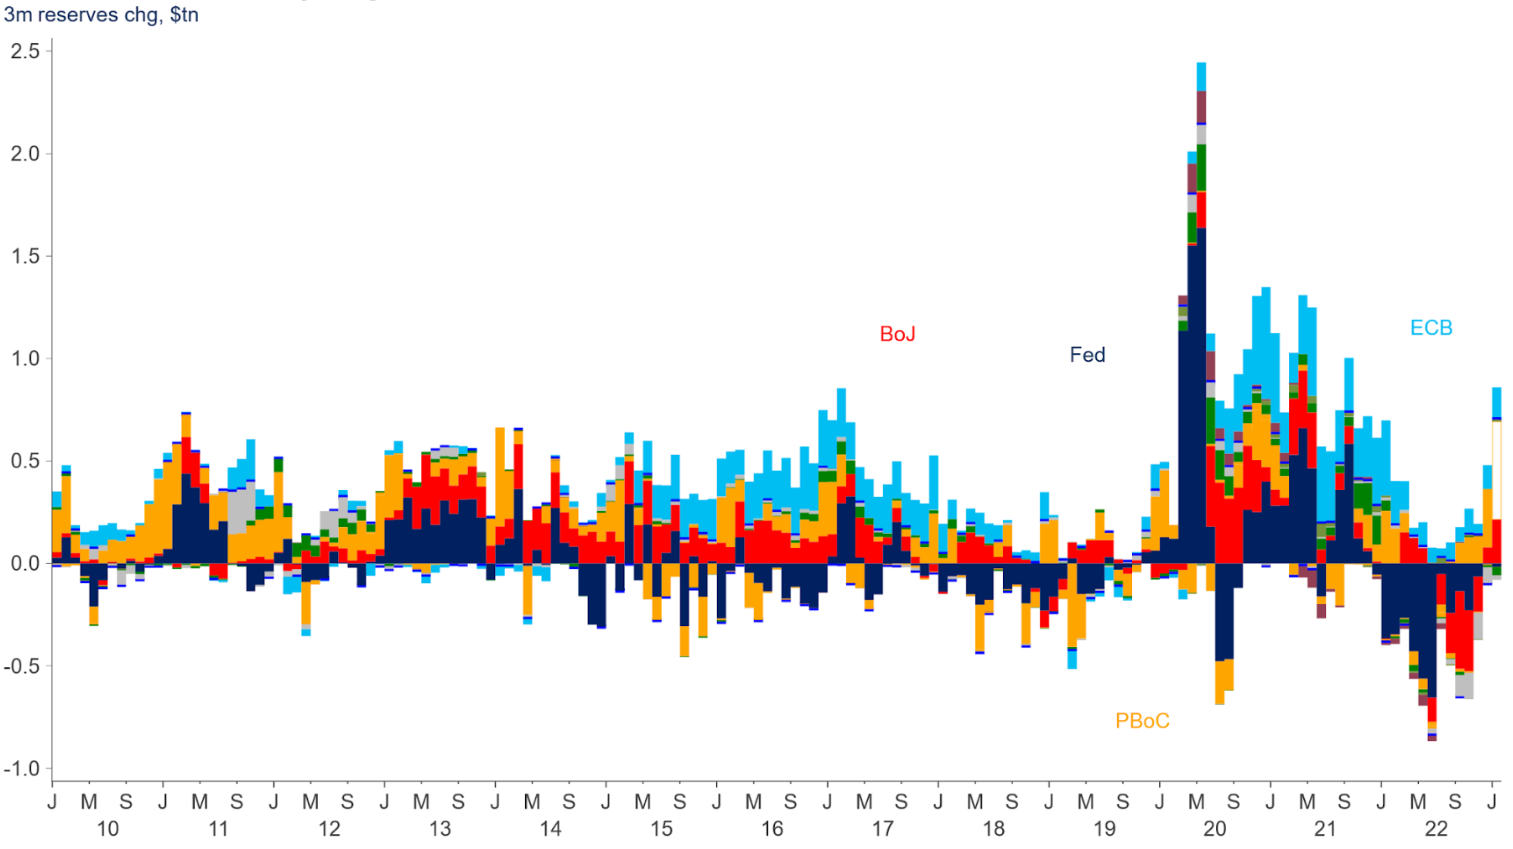
Source: Citi Research, Bloomberg 2023 shaping up as the second best year for dip-buying strategy 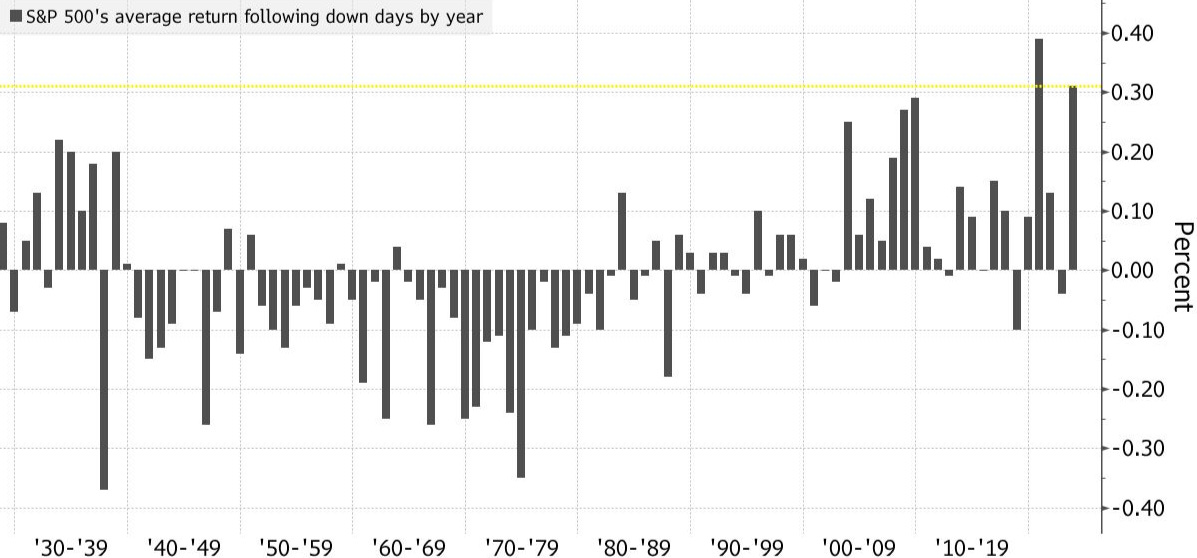
Source: Bloomberg Global equity capital raisings by quarter ($US)
Source: WSJ, dealogic Australasia equity capital raisings by quarter ($US)
Source: WSJ, dealogic US VC deal activity in aerospace and defence technology 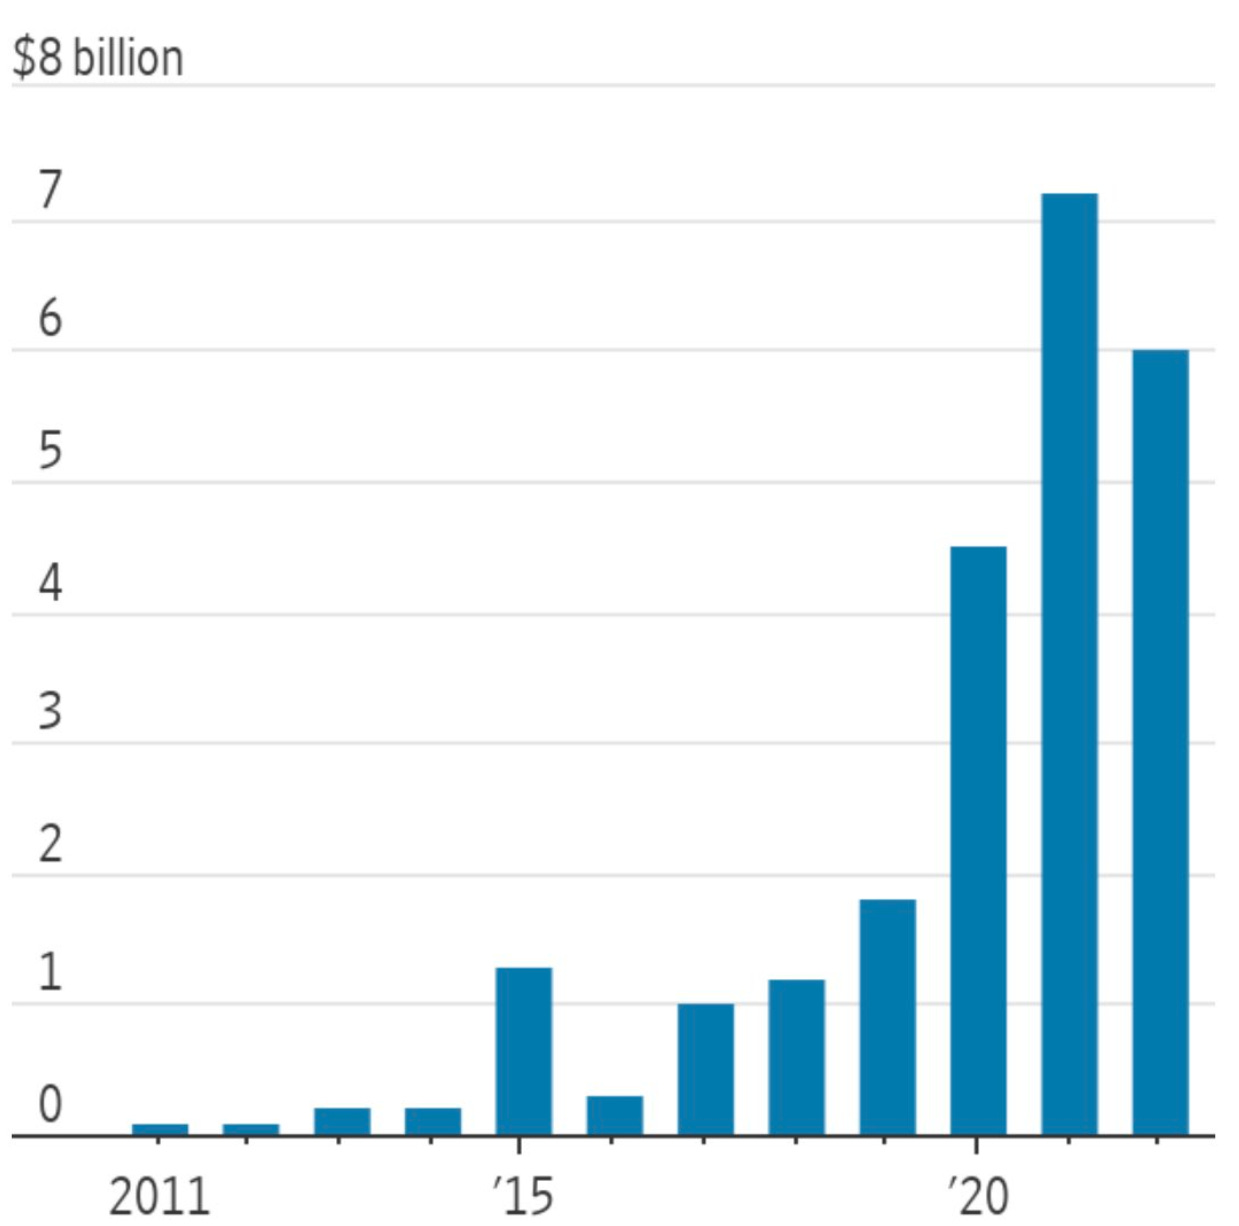
Source: WSJ, PitchBook US bank deposits 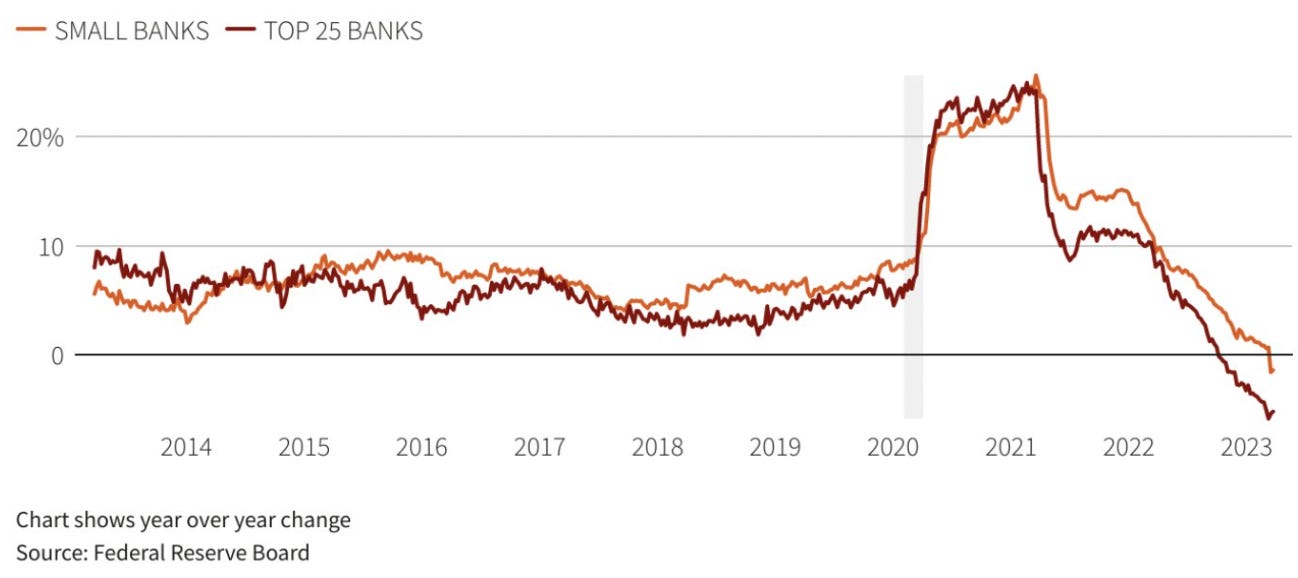
Source: Reuters Trading Margins on ASX Listed Debt and Hybrid Sectors (27 Mar) 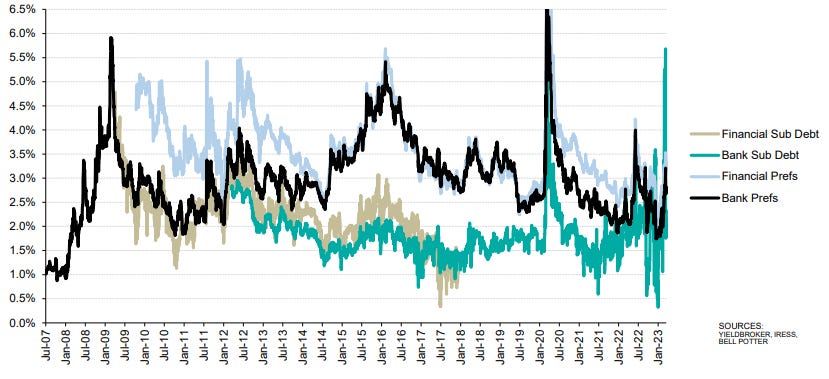
Source: Bell Potter Research US Two-Year Bond Yield - Four Week Average Daily Move 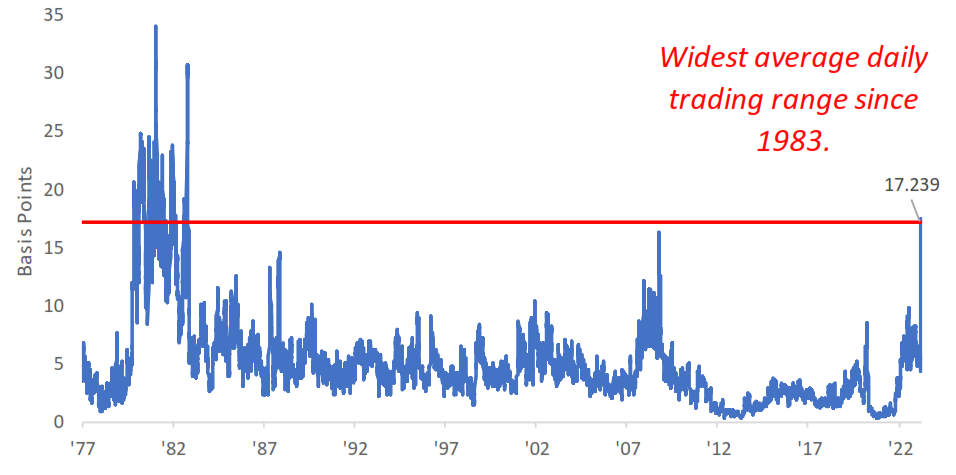
Source: Bespoke Investment Group ICE BofAML MOVE Index (US bond market implied volatility) 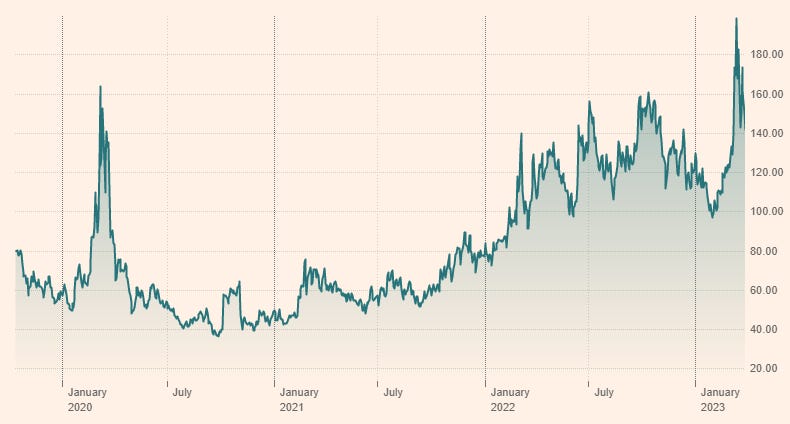
Source: FT, Refinitiv Top 10 Nasdaq 100 components = 55% weighting Source: Equitable Investors, SlickCharts Top 10 S&P 500 components = 27% weighting
Source: Equitable Investors, SlickCharts Top 10 iShares Core S&P/ASX 200 ETF components = 46% weighting
Source: Equitable Investors, Iress S&P 500 performance without "big tech" 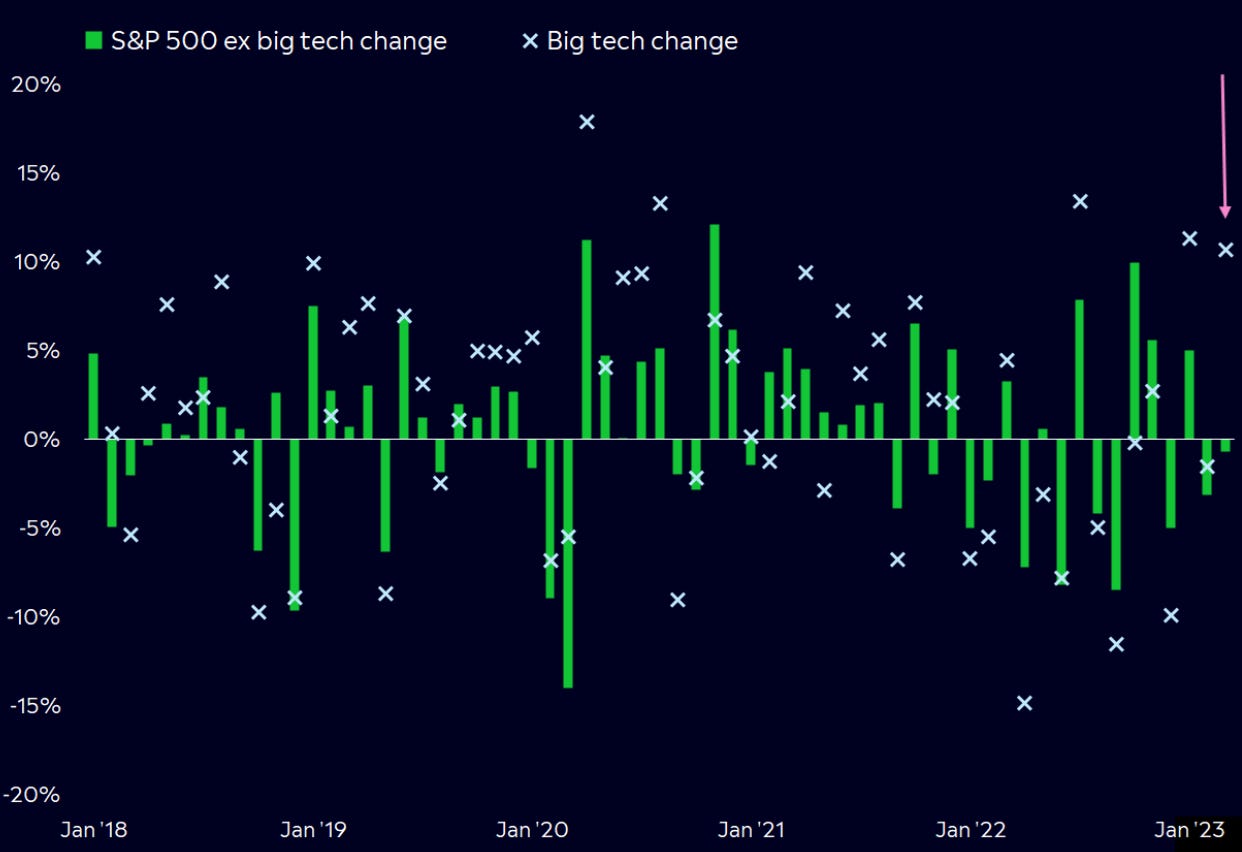
Source: eToro, Bloomberg April Edition Funds operated by this manager: Equitable Investors Dragonfly Fund Disclaimer Nothing in this blog constitutes investment advice - or advice in any other field. Neither the information, commentary or any opinion contained in this blog constitutes a solicitation or offer by Equitable Investors Pty Ltd (Equitable Investors) or its affiliates to buy or sell any securities or other financial instruments. Nor shall any such security be offered or sold to any person in any jurisdiction in which such offer, solicitation, purchase, or sale would be unlawful under the securities laws of such jurisdiction. The content of this blog should not be relied upon in making investment decisions. Any decisions based on information contained on this blog are the sole responsibility of the visitor. In exchange for using this blog, the visitor agree to indemnify Equitable Investors and hold Equitable Investors, its officers, directors, employees, affiliates, agents, licensors and suppliers harmless against any and all claims, losses, liability, costs and expenses (including but not limited to legal fees) arising from your use of this blog, from your violation of these Terms or from any decisions that the visitor makes based on such information. This blog is for information purposes only and is not intended to be relied upon as a forecast, research or investment advice. The information on this blog does not constitute a recommendation, offer or solicitation to buy or sell any securities or to adopt any investment strategy. Although this material is based upon information that Equitable Investors considers reliable and endeavours to keep current, Equitable Investors does not assure that this material is accurate, current or complete, and it should not be relied upon as such. Any opinions expressed on this blog may change as subsequent conditions vary. Equitable Investors does not warrant, either expressly or implied, the accuracy or completeness of the information, text, graphics, links or other items contained on this blog and does not warrant that the functions contained in this blog will be uninterrupted or error-free, that defects will be corrected, or that the blog will be free of viruses or other harmful components. Equitable Investors expressly disclaims all liability for errors and omissions in the materials on this blog and for the use or interpretation by others of information contained on the blog |

28 Apr 2023 - Australian Secure Capital Fund - Market Update March
|
Australian Secure Capital Fund - Market Update March Australian Secure Capital Fund April 2023 Property Values as at 31st of March 2023
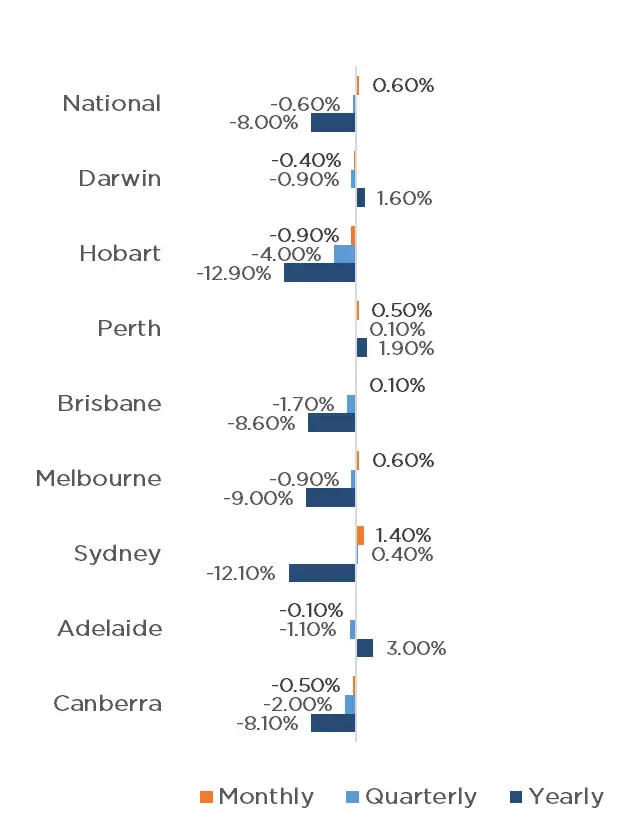
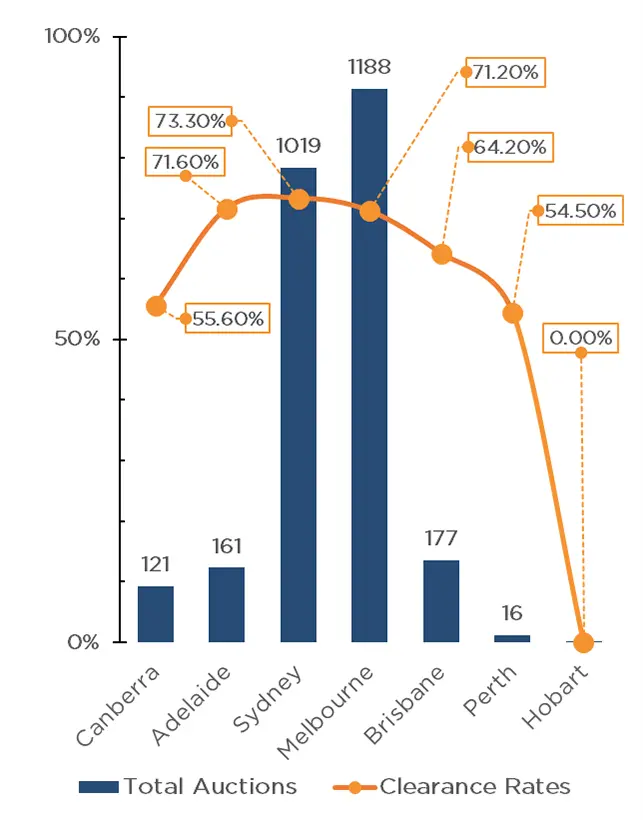
The property market continues to show signs of recovery, with CoreLogic's National Home Value Index posting the first month-on-month increase since April 2022, with values up 0.60% for the month of March. This monthly growth was driven by strong results in Sydney, with values increasing 1.40% for the month. This figure has been impacted heavily by housing values in the most expensive quarter of Sydney's market up 2.00% and unit values also up 1.40%. Results across Melbourne, Perth and Brisbane were also positive, with the capital cities recording growth of 0.60%, 0.50% and 0.10% respectively. Adelaide (-0.10%), Darwin (-0.40%), Canberra (-0.50%) and Tasmania (-0.90%) however all recorded reductions in value. Clearance Rates & Auctions 20th - 26th of February 2023 The week before Easter brought the busiest auction week of 2023 thus far, with 2,685 properties going to auction, up 16.60% on the previous week, however still 16.30% below that of last year (3,209). Melbourne led the way with 1,188 auctions taking place, followed closely by Sydney with 1,019. Brisbane, Adelaide and Canberra which all saw significantly fewer auctions, with 177, 161 and 121 respectively. In addition to strong auction volumes, clearance rates have continued to improve, with Sydney, Adelaide and Melbourne all receiving above 70.00% clearance rates with 73.3% (63.8% last year), 71.6% (79.1% last year) and 71.2% (67% last year) respectively, contributing to a 70.7% weighted average, up from 66.8% last year. Brisbane also recorded a clearance rate of 64.2% (65.9% last year), however results across Canberra and Perth were well down on last years values, with 55.6% (73.3% last year) and 54.5% (64.7% last year) respectively. With the RBA opting to leave the cash rate unchanged in their April meeting after 10 consecutive increases, some relief is now given to existing mortgage holders, whilst also providing some comfort for those looking to enter the market. In line with previous forecasts, we believe buyer demand is likely to continue to increase throughout the year and into 2024. Median Dwelling Values as at 31st of March 2023 Quick Insights Australia faces huge housing shortfall as new home sales slump A dramatic slump in new home sales will exacerbate the national rental and affordability crisis and put further pressure on the ability of new housing supply to meet future demand, the Urban Development Institute has warned in its latest State of the Land report. According to the benchmark report, over the 2022 calendar year, greenfield lot sales almost halved and settled apartment sales fell to their lowest level since the global financial crisis as buyer demand plummeted, all due to higher interest rates, surging construction work, and fears about builder failures. Source: Australian Financial Review Walk-in buyer interrupts auction, takes house sight unseen A four-bedroom house with a pool located in Floreat, Western Australia, sold at auction for $1.7 million. There were a lot of interested parties - 10 registered bidders but only three were active bidders. Right at the tail end of bidding, as things were starting to simmer down, someone walked in and asked if they could quickly register. She'd never seen the home. She walked straight into the backyard and said "I like this house." and within minutes she purchased the property. Source: Australian Financial Review Infrastructure Victoria urges Andrews to scrap stamp duty Stamp duty should be scrapped and replaced with a broad-based land tax according to Infrastructure Victoria In a landmark report it also warned that transport and amenities are struggling to keep pace with suburban sprawl and density needs to increase in existing suburbs. The report calls for the government to fast-track planning approval for more high-quality, three or four-bedroom townhouses and better standards for family-friendly low-rise apartments, to reverse the trend of families continuing to move to bigger blocks in newly created outer suburbs. Source: Australian Financial Review Author: Filippo Sciacca, Director - Investor Relations, Asset Management and Compliance Funds operated by this manager: ASCF High Yield Fund, ASCF Premium Capital Fund, ASCF Select Income Fund |

28 Apr 2023 - Regnan: Investors are still not getting the ESG disclosures they need
|
Regnan: Investors are still not getting the ESG disclosures they need Pendal March 2023 |
|
Companies are increasingly disclosing their exposure to climate risks. But those disclosures often do not give the investors the full picture. Regnan's ALISON EWINGS explains
IT'S been five years since the Task Force on Climate-related Financial Disclosures began trialling voluntary, consistent climate-related financial risk disclosures for use by companies. While take-up has been good, investors still need to see a lot of improvement in ESG-related disclosures, says Alison Ewings, who engages with ASX-listed companies for sustainable leader Regnan. About 80 per cent of big global companies now disclosed in line with at least one of the taskforce's 11 recommendations. But most companies are still taking too narrow a view of climate risks and failing to consider the underlying, system-wide interdependencies and economics risks of climate change that will impact their operations, says Ewings. A Regnan assessment of disclosures shows they are often narrow in scope and place climate transition risks ahead of considering system-wide interdependencies and different potential economic scenarios. Regnan is a leader in sustainable investing and an affiliate of Pendal. Regnan's Head "Look at what's happened in Australia lately -- fire, fire, flood, flood, flood -- everyone who's dependent on the Australian economy has been affected by those things," says Ewings. "But when you look at an individual company you see 'well we're fine'. But you're not fine. You're not an island. You're part of the broader economy. "We think about this as an additional risk that climate change is going to add for every business. "Some businesses are more leveraged to economic activity than others, so they're more exposed, but they're all exposed to some extent. "So instead of saying there's no climate risk, internally we talk about it as there being a background level of risk that is not nil. "This is something that's not being explicitly considered by companies in their TCFD disclosures and we're not sure that it's really being explicitly considered by investors, insurers and banks." Five underlying climate risks for investors Ewings says underlying climate risk can take five main forms. First, general consumer behaviour will likely change as temperatures rise and extreme weather events become more common. This could include changing preferences for food, clothing and holiday destinations, to the need to rebuild after natural disasters or even relocate for more favourable climatic conditions. Second, businesses are all reliant in some way on the underlying infrastructure around them, from roads, telecommunications and power to access to water. Changes to the availability of infrastructure can have profound implications for a business's operations. Third, disruptions in supply chains due to extreme weather, shifting demand or interrupted transportation. Fourth, businesses rely on the resilience of the communities they operate in to maintain their workforce and customer base. Assessing the health of the community should form part of a business's risk assessment. And finally, with extreme weather no longer an infrequent, temporary phenomenon, overall economic growth is likely to be lower. Businesses should reflect this base level reduction in demand in their planning. "The key thing is the interdependency," says Ewings. "Once you get outside of your organisational boundary, that's where things start to fall apart. "For instance, companies do a good job of site-by-site analysis of the impacts of climate change to physical locations. "But it is very rare to see consideration of the infrastructure on which they also rely on like the transport networks that move things to and from those sites. "It's rare to see anything about the resilience of the communities in which their employees work -- it might well be that your factory is fine, but nobody can get there or nobody's feeling like coming to work. "All of these factors should be considered." Author: Alison Ewings, Head of Engagement |
|
Funds operated by this manager: Pendal Focus Australian Share Fund, Pendal Global Select Fund - Class R, Pendal Horizon Sustainable Australian Share Fund, Pendal MicroCap Opportunities Fund, Pendal Sustainable Australian Fixed Interest Fund - Class R, Regnan Global Equity Impact Solutions Fund - Class R, Regnan Credit Impact Trust Fund |
|
This information has been prepared by Pendal Fund Services Limited (PFSL) ABN 13 161 249 332, AFSL No 431426 and is current as at December 8, 2021. PFSL is the responsible entity and issuer of units in the Pendal Multi-Asset Target Return Fund (Fund) ARSN: 623 987 968. A product disclosure statement (PDS) is available for the Fund and can be obtained by calling 1300 346 821 or visiting www.pendalgroup.com. The Target Market Determination (TMD) for the Fund is available at www.pendalgroup.com/ddo. You should obtain and consider the PDS and the TMD before deciding whether to acquire, continue to hold or dispose of units in the Fund. An investment in the Fund or any of the funds referred to in this web page is subject to investment risk, including possible delays in repayment of withdrawal proceeds and loss of income and principal invested. This information is for general purposes only, should not be considered as a comprehensive statement on any matter and should not be relied upon as such. It has been prepared without taking into account any recipient's personal objectives, financial situation or needs. Because of this, recipients should, before acting on this information, consider its appropriateness having regard to their individual objectives, financial situation and needs. This information is not to be regarded as a securities recommendation. The information may contain material provided by third parties, is given in good faith and has been derived from sources believed to be accurate as at its issue date. While such material is published with necessary permission, and while all reasonable care has been taken to ensure that the information is complete and correct, to the maximum extent permitted by law neither PFSL nor any company in the Pendal group accepts any responsibility or liability for the accuracy or completeness of this information. Performance figures are calculated in accordance with the Financial Services Council (FSC) standards. Performance data (post-fee) assumes reinvestment of distributions and is calculated using exit prices, net of management costs. Performance data (pre-fee) is calculated by adding back management costs to the post-fee performance. Past performance is not a reliable indicator of future performance. Any projections are predictive only and should not be relied upon when making an investment decision or recommendation. Whilst we have used every effort to ensure that the assumptions on which the projections are based are reasonable, the projections may be based on incorrect assumptions or may not take into account known or unknown risks and uncertainties. The actual results may differ materially from these projections. For more information, please call Customer Relations on 1300 346 821 8am to 6pm (Sydney time) or visit our website www.pendalgroup.com |

27 Apr 2023 - Investment Perspectives: Banks, balance sheets and bailouts

26 Apr 2023 - Tim Toohey: Banking crisis far from over
|
Tim Toohey: Banking crisis far from over Yarra Capital Management March 2023 Tim Toohey, Head of Macro and Strategy, looks at the the key factors behind the collapse of Silicon Valley Bank (SVB) ($209bn of assets) and Signature Bank ($110bn in assets), and notes that there is one thing we know for certain amid a banking crisis: the cost of credit will rise and the availability of credit will fall sharply. Tim details the likely implications for Australia and concludes that despite the coming headwinds, Australian banks will remain resilient. Jay Powell declared to the US House Financial Service Committee on 9 March 2023 that there was no evidence that suggests the US Fed has overtightened policy. Instead he declared that "the ultimate level of interest rates is likely to be higher than previously anticipated. Within 24 hours the 2nd largest retail bank failure had commenced. Collectively the collapse of Silicon Valley Bank (SVB) ($209bn of assets) and Signature Bank ($110bn in assets) exceeds the biggest bank collapse in 2008 (Washington Mutual, $307bn). We are rapidly closing in on the 2008 collective peak of $374bn. Should First Republic Bank, whose share price has fallen 90% from mid-February 2023, also fail then a further $213bn of assets can be added to the total. Despite the size of these collapses, it is important not to confuse the collapse of several regional US banks as a harbinger of the next Global Financial Crisis (GFC). It was the excessive leverage, excessive risk taking and poor regulation of the investment banks that led to the GFC, not a collapse of regional and retail banks. The US does have a long history of bank crises. Most of these crises were a function of excessive speculation in real estate and financial markets and occasionally the cause could be traced to a collapse in commodity markets:
It is the savings and loans (S&L) failures of the 1980s and early 1990s that have the most similarity to today's failures. Simply put, long-dated housing loans written at low interest rates rapidly become uneconomic if funding is short dated and interest rates are rising sharply. The small and fractured natured of most US retail and commercial banks means there is no ability to turn to the equity market to raise capital which makes for fertile ground for bank runs. What has marked the failure of SVB and Signature was that instead of lending recklessly for the purposes of commodity, equity market, or housing market speculation that had brought down banks in the past, it was large falls in the value of 'long duration' crypto and tech start-up assets that proved the source of the failure. The railway bonds and Florida swamp land that had brought down banks decades earlier had merely been replaced by some equally dubiously long duration tech assets. The other relatively interesting aspect about SVB was that it seemingly forgot to do what banks normally do. Instead of making loans to purchase homes and to finance business expansions, it seems to have feasted on cheap money and start-up capital for tech entrepreneurs and purchased Mortgage-Backed Securities and Treasuries at relatively low yields and financed venture capital investments at expensive multiples. As the Fed jacked up rates, tech values fell, investors became nervous and deposits declined slowly. And then they moved very quickly. Being forced to liquidate MBS and Treasury securities at a large loss merely helped expedite the decline. Social media did the rest. Indeed, SVB is likely to be the first bank run played out almost exclusively in digital space. To be clear, this is not likely to be reflective of the average bank in the US banking system. It is not evidence of a systemic threat to the system. And importantly, depositor insurance and the preparedness of the US Treasury to provide selective guarantees for bank deposits for non-systemically important banks does make these type of banking collapses less economically painful. Nevertheless, the failures are incredibly important events for financial markets. Chart 1: US Retail and Commercial Bank Leverage & 'Greed'
To gain an insight on the vulnerability of other regional US banks, the above Chart 1 provides a broad measure of bank leverage plotted against how fast banks have attempted to expand their balance sheets. The banks that have failed or are under immediate stress are highlighted in red. What should be clear is that although the commonality of lending to tech and crypto assets may have been the source of the initial phase of the crisis, it is unlikely that the names with higher leverage and just as rapid balance sheet growth will all prove to have sufficient loan quality and the asset and liability mismatches that have created bank stresses in the past. The unique feature of the current crisis is the speed at which deposits have been shifted from the smaller regional banks to the large US banks. Electronic transfers make a bank run far more immediate, and social media has been an amplifier of fear and contagion. The other unique feature of this crisis is that the proximity to the GFC has seen major banks and policy makers act far quicker and aggressively than in the GFC. For instance, short term loans made by the Fed to the major banks in exchange for cash has surged well past the peak of 2008, a time where banks were afraid of the stigma of being seen tapping the Fed's emergency liquidity facilities. No such stigma this time around! Meanwhile, commitments from policy makers that they stand ready to do whatever is necessary to support the banking system have come much faster than during 2008, which was marked with successive failures to secure the legislature authority to make emergency funding available. In short, it is unlikely that the US banking crisis is complete and a raft of consolidation of regional banks is feasible, but it is also unlikely to be marked by the same level of confusion, inaction and liquidity shortfalls that prevailed in 2008. Of course, the banking crisis becomes more global in nature if it spreads to the 'globally systemic' banks. In the Chart 2 below, the same analysis is repeated for international listed banks. The gleeful adoption of Quantitative Easing (QE) which fuelled the surge in global money supply and bank lending has helped create plenty of other potential sources of contagion. Chart 2: Global Banking System Leverage & 'Greed'
For a central bank task with controlling inflation and economic stability, these failures and the build-up of excessive leverage are embarrassing. But they are no accident: central banks are at least partly complicit. Why?
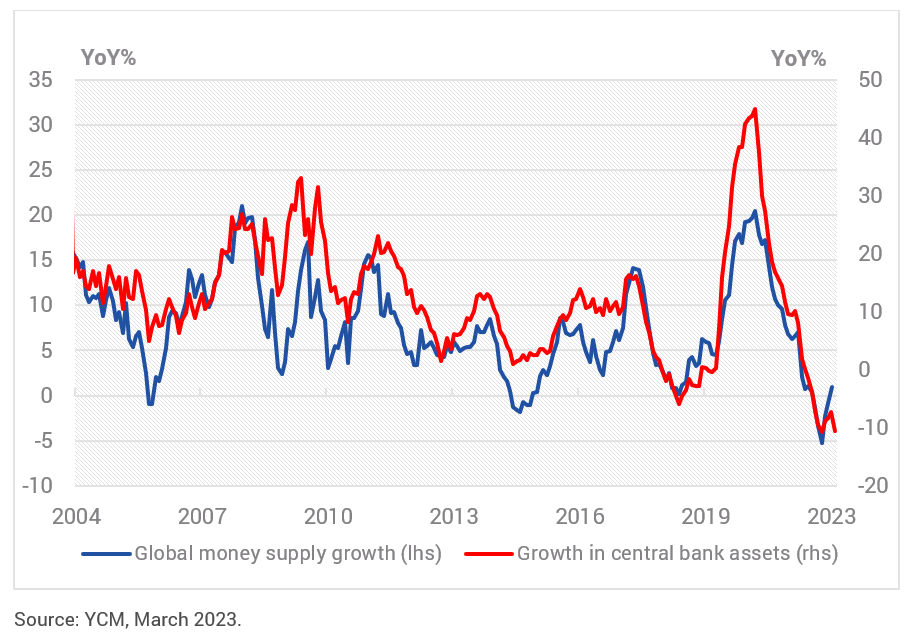
Chart 3: Central Bank Asset Growth and Global Money Supply'
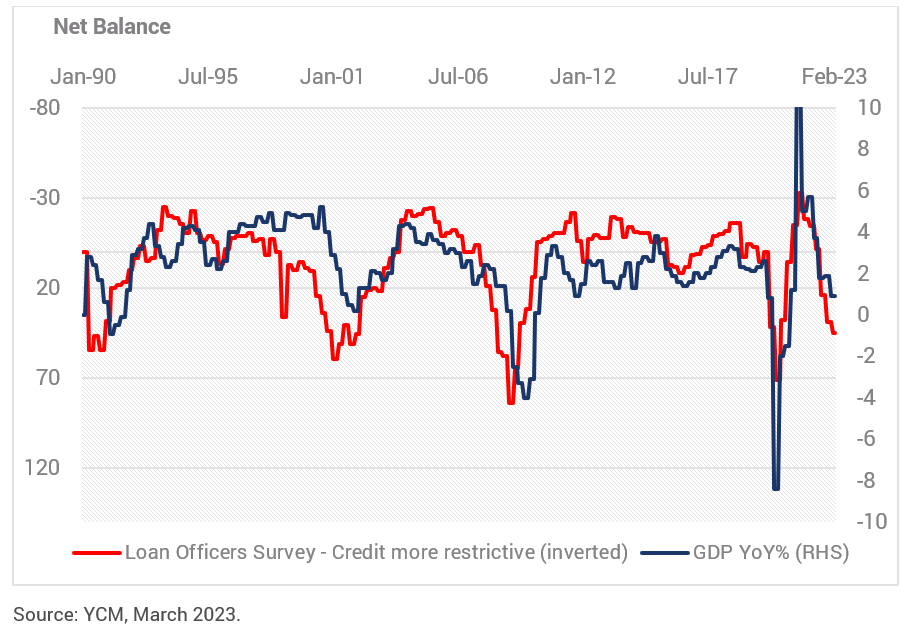
The recent rapid movement in interest rates has been sufficient to unveil some spectacular asset and liability mismatches in some US regional banks and has cast doubts on whether other banks are also sitting on large unrealised losses. Suffice to say, 'good' policy is typically marked by hiking early and in large increments at the start of the cycle and then slowing and spreading out the hikes towards the end of the cycle as incoming information is accessed for signs of a turning point. That is not what central banks have done this cycle. They did the exact opposite. Given central banks know they are already in the restrictive zone for monetary policy, given economic growth is well below trend, given inflation peaked months ago and given long dated inflation expectations are falling, then continuing to hike at this point of the economic cycle risks breaking more than just a few US retail and commercial banks. It continues to risk recession. In this respect, there is one thing we know for certain amid a banking crisis: it is that the cost of credit will rise and the availability of credit will fall sharply. The next several surveys from the US Fed's Loan Officers Survey will show a marked tightening in the availability of credit, and this has always been a rather accurate precursor to US recession (refer Chart 4). So much for the "no-landing" optimists of January and February. Chart 4: Central Bank Asset Growth and Global Money Supply'
To be clear, after its latest 25bps hike, we believe the Fed and the RBA have now completed this hiking cycle. It had been our position since mid-2022 that the economic data would not allow the Fed nor the RBA to persist with their stated interest rate intentions into mid-2023. The fractures in the banking system are by themselves sufficient to guarantee a pause in the hiking cycle, but the reality is the data is telling the central banks that the monetary tightening task is complete even if the central banks have yet to fully acknowledge it. In the case of the Australian banks, most would agree that they have some natural advantages. Capital ratios are higher - and that is a good thing - but by itself this is not a necessary or sufficient reason to avoid contagion. The real security of the big four Australian banks is fivefold: 1. The Australian banks have transformed to be primarily home loan lenders The days of the banks taking on large single loan exposures to big corporates or taking proprietary risk positions on the balance sheet are long gone. Australia's banks are boring by international banking standards, and in times of crisis that is a good thing. In the context of our chart on leverage and asset growth, the Australian banks are in the zone shown by the oval shape. The leverage is only slightly higher than it has been over the past five years and balance sheet growth has been between 11% to 29% since 2019. That's significantly below the offshore banks that experienced difficulties so far. 2. Australia's banks are homogenous To create a genuine bank run, a link with poor asset quality, poor risk controls and poor governance typically becomes the catalyst for a crisis. While Australian banks are not perfect, they do manage asset and liability risk religiously and in the post-Royal Commission period governance has been given a higher priority. But more importantly, the banks are all pretty much the same. Smaller banks were absorbed into the big banks around the GFC, and the lack of competition and underlying profitability of the back book of mortgages makes it difficult to propose a sufficient shock to the system that would see depositors flee any of the major banks. 3. The banks co invest in each other One of the underappreciated aspects of the Australian banks is that they hold large amounts of each other's paper on balance sheet. This creates an additional level of security to the oligopoly. In some ways it is a form of insurance whereby any stresses in the paper of one of the majors is diluted by the ability of the remaining banks to ensure sufficient liquidity and functioning of bank paper. 4. Government backing is clearer in Australia There is a difference between depositors having a formal government guarantee (that exists in Australia) and industry-provided depositor insurance (that exists in the US). In Australia, depositors are protected by a government guarantee up to $250,000 for each deposit holder at each bank, building society or credit union. There is very little risk to the vast majority of household deposit holders given the mean level of deposits at Australian financial institutions inclusive of offset accounts is $82,000. 5. Australian banks have stable funding sources Bank funding is overwhelming sourced from deposits. Almost two-thirds of all bank funding needs are currently met from deposits, up from 52% in 2011. Whilst it is common to think of deposits as merely household deposits, the deposits by corporate Australia, Government, Superannuation funds and other financial institutions holding deposits in banks easily exceed the level of deposits held by households. In other words, to destabilise the deposit base of Australian banks it would take more than fear amongst households. Moreover, the share of bank funding reliant on offshore issuance has declined in recent years, in part due to the cheap access to the government's term funding facility (TFF). Should stresses in international funding markets again become acute, we have the blueprint of the 2008-15 Australian Government Guarantee Scheme where the Government's AAA rating was lent to the banks to issue bonds. Australia is one of only nine countries to be rated AAA by all three major credit rating agencies, and the scheme proved highly successful in mitigating offshore funding difficulties during 2008 and 2009. In addition the Australian banks retain easy access to equity markets to maintain equity buffers. Equity remains less than 10% of bank funding requirements, however, in times of crisis the combination of offering discounted equity placements with fully franked dividends tends to find very ready recipients from both retail and institutional investors. It is worth noting that the big four banks currently offer yields of between 6.1% and 9.0% before franking benefits. Typically, US regional banks offer dividend yields of less than 2%. The combination of large, sticky deposits and ready access to capital markets with attractive yields for Australian banks provides a stark contrast to smaller US banks who are subject to deposit flight and poor access to alternative funding sources. Although Tier 1 bonds will likely remain under some pressure whilst overseas concerns are highest, we see this as more of an opportunity to selectively buy some securities at opportunistic prices. While we expect the Australian banks will underperform the broader equity market as credit growth slows, funding costs rise and P/E ratios de-rate on global concerns, we are not fearful of anything that approximates a banking run amongst the major banks. |
|
Funds operated by this manager: Yarra Australian Equities Fund, Yarra Emerging Leaders Fund, Yarra Enhanced Income Fund, Yarra Income Plus Fund |

24 Apr 2023 - Altor AltFi Income Fund - Quarterly Webinar Update
|
Altor AltFi Income Fund - Quarterly Webinar Update Altor Capital As the Altor AltFi Income Fund has achieved a five-year track record, we are pleased to invite you to the March 2023 quarterly performance update on Wednesday, 26 April at 11:00am AEST. The webinar will be led by Altor Capital's Chief Investment Officer and Portfolio Manager Benjamin Harrison and there will be an opportunity for investors to ask questions. Register Now Speakers BENJAMIN HARRISON Ben has extensive experience in advising and investing in companies. He began his career as a project manager for a large international engineering consulting firm and later moved into investment banking then investment management. Ben is a founder and the Chief Investment Officer of Altor Capital. He is also portfolio manager for Altor's private credit fund, the Altor AltFi Income Fund. TOM COCHRANE Tom is an Associate Portfolio Manager within the Altor team and has diverse experience across corporate advisory, private credit, private equity and public equities. His role at Altor encompasses deal flow, investment analysis, investment structuring and corporate advisory within all of Altor's funds with a focus on private equity and private credit. Funds operated by this manager: |

24 Apr 2023 - Altor Emerging PIPE Fund - Quarterly Webinar Update
|
Altor Emerging PIPE Fund - Quarterly Webinar Update Altor Capital
Altor Capital is pleased to invite you to the Altor Emerging PIPE Fund's March 2023 quarterly performance update on Wednesday, 26 April at 12:00pm AEST. The webinar will be led by Altor Capital's Chief Investment Officer and Portfolio Manager Benjamin Harrison and there will be an opportunity for investors to ask questions. Date: Wednesday, 26 April 2023 Speakers BENJAMIN HARRISON Ben has extensive experience in advising and investing in companies. He began his career as a project manager for a large international engineering consulting firm and later moved into investment banking then investment management. Ben is a founder and the Chief Investment Officer of Altor Capital. He is also portfolio manager for Altor's private credit fund, the Altor AltFi Income Fund. Funds operated by this manager: |

21 Apr 2023 - Innovative companies can conserve and protect our precious water resource
|
Innovative companies can conserve and protect our precious water resource abrdn March 2023 Water is a precious, finite resource and essential to life on earth. However, progress on establishing universal access to basic sanitation, and encouraging the protection and responsible use of ocean resources is woefully lagging. Every year, International Water Day is marked on 22 March to draw attention to these issues and agitate for change. Efforts to ensure universal access to clean drinking water and basic sanitation are faltering. An estimated two billion people across the globe don't have safe drinking water, and a further 3.6 billion lack safely managed sanitation. We are also degrading the world's water ecosystems at an alarming rate. Over the past 300 years, over 85% of the planet's wetlands have been lost. Increasing acidification threatens marine life, while plastic pollution is choking the ocean. In 2022, we saw multiple extreme weather events across every continent, with severe and devastating storms, droughts and floods. Heavy monsoon rainfall in Pakistan caused flash flooding and landslides, destroying 1.7 million homes, displacing 32 million people, killing 1,700 people and pushing nearly nine million into poverty. Meanwhile, the Horn of Africa experienced the longest and most severe drought on record. Across Somalia, Kenya and Ethiopia, 21 million people now have food insecurity. This includes over three million people at 'emergency' levels or higher, meaning they will go days without eating and have been forced to sell belongings to buy food. With a growing global population, solutions that enable more efficient use and management of water, as well as promote better care of our oceans, are essential to help meet the increasing demand and reliance on our water resources. Within our sustainable funds, but also more broadly in core funds, we look for companies with strong runways for growth. Given the unmet need, companies whose products and services improve access to clean water and sanitation, and improve efficiencies in existing infrastructure, are tapping into significant revenue opportunities. There are also opportunities in companies showing water leadership by minimising water use, or reusing water as much as possible, which should also lower costs. Companies whose products and services improve access to clean water and sanitation are tapping into significant revenue opportunities. So where do we think there are opportunities?One example of a business improving water usage is Tetra Tech, a leading resource management consultant specialising in water services. It helps clients across a range of water-related projects, from water reuse work in Mongolia and addressing water loss in Jordan, to groundwater replenishment and reuse in California. Tetra Tech supports 70,000 projects across 100 countries around water reuse and conservation. These include flood prevention projects, stormwater management, wastewater treatment and managing water supplies. Where possible, the company uses natural solutions, such as the creation of a 'living breakwater' to stabilise the marsh shoreline and support biodiversity in Alabama. It also uses green stormwater infrastructure to transform the way stormwater is managed in Raleigh, North Carolina. Last year, Tetra Tech helped treat, save or reuse 328,000 megalitres of water, while protecting, managing or restoring 178 million hectares of land and water. The company's projects also avoided 20.6 million metric tonnes of CO2e. Another company is DSM, a Dutch business specialising in health and nutritional products. These include food supplements and ingredients containing plant-based fish alternatives. The company offers vegan fish flavouring, as well as algae omega-3 alternatives and natural algal oil for fish feed. Just one tonne of DSM's Veramaris natural algal oil saves catching 60 tonnes of wild fish to produce salmon feed, protecting marine biodiversity in our oceans. Companies whose main business is not water-related can still improve their water management and consumption. Azure Power is just one example. A leading solar power company in India, Azure Power builds and operates some of the largest solar power projects in the country. However, India is a water-stressed nation and solar panels, which attract dirt and dust, require regular washing to work effectively. The company has introduced robotic solar panel brushes to keep water use to a minimum and it also recycles 50% of the groundwater it uses. The company is aiming for net water neutrality this year. Final thoughts…These are just a few examples of businesses taking action. As we see increasing demand and need for solutions, we believe corporates can offer innovative ways to tackle our water needs. In the years ahead, this will be increasingly essential as we work to ensure that life on earth can access clean, safe and plentiful supplies of water and that life in the oceans is protected. Companies are selected for illustrative purposes only to demonstrate the investment management style described herein and not as an investment recommendation or indication of future performance. Past performance is not a guide to future results. Author: Sarah Norris, Investment Director |
|
Funds operated by this manager: Aberdeen Standard Actively Hedged International Equities Fund, Aberdeen Standard Asian Opportunities Fund, Aberdeen Standard Australian Small Companies Fund, Aberdeen Standard Emerging Opportunities Fund, Aberdeen Standard Ex-20 Australian Equities Fund (Class A), Aberdeen Standard Focused Sustainable Australian Equity Fund, Aberdeen Standard Fully Hedged International Equities Fund, Aberdeen Standard Global Absolute Return Strategies Fund, Aberdeen Standard Global Corporate Bond Fund, Aberdeen Standard International Equity Fund, Aberdeen Standard Multi Asset Real Return Fund, Aberdeen Standard Multi-Asset Income Fund |

20 Apr 2023 - Inflation Reduction Act paves way for renewable supercycle
|
Inflation Reduction Act paves way for renewable supercycle Tyndall Asset Management February 2022 The recently passed Inflation Reduction Act (IRA) is poised to have a significant impact on the US economy, especially in the renewable energy sector. The Act includes provisions that incentivise the growth of the renewables sector, creating a "supercycle" of investment and development. Australia is well placed given our close relationship with the US and our resources of critical minerals vital for decarbonisation. So, what is the Inflation Reduction Act?The Inflation Reduction Act of 2022 (IRA), was enacted into law in August of the same year. It is one of three pieces of legislation that has been passed since 2021 with the goal of enhancing economic competitiveness, innovation, and industrial productivity. The IRA aligns with the priorities of the Bipartisan Infrastructure Law (BIL) and the CHIPS and Science Act, resulting in the introduction of US$2 trillion in new federal spending over the next decade. The IRA encourages investment in renewable energy, enhances energy efficiencies, and helps companies tackle climate change via tax credits, incentives, and various additional provisions. The pathway to decarbonisation is expected to be enhanced since the IRA will increase demand for electric vehicles (EVs), clean technologies, and low carbon materials/construction. The IRA allocates approximately US$394 billion in federal funding towards clean energy, with the primary objective of reducing the nation's carbon emissions by the end of the decade. This is primarily accomplished through a combination of tax incentives, grants, and loan guarantees (see Figure 1). Figure 1: Funding the Inflation Reduction Act (US$b) Source: McKinsey & Company The majority of the $394b in energy and climate funding is dispensed in the form of tax credits. Corporations are the largest beneficiary, receiving an estimated $216b worth of tax credits. This funding mechanism is aimed at increasing investment in clean energy, transport, and manufacturing in the US. Consumers can take advantage of roughly $43b of these tax credits by investing in EVs, energy-efficient appliances, rooftop solar panels, geothermal heating, and home batteries (see Figure 2). Figure 2: Selected tax credit modifications in the IRA Source: McKinsey & Company Many of the tax incentives offered by the IRA come with conditions related to domestic production or procurement. For instance, to receive the full EV consumer credit, a certain percentage of the critical minerals in the vehicle's battery must either be recycled in the US or sourced from a country with a free-trade agreement with the US. The battery must also have been manufactured or assembled in the US. Europe powers up in response to IRA clean energy push The European Green Deal established in December 2019 was set up to make Europe the first climate-neutral continent by 2050. The goal of reducing net greenhouse emissions by at least 55% by 2030, compared to 1990 levels, is a bold target. The REPowerEU Plan was launched in response to the Russian invasion of Ukraine, with the purpose of hastening the transition away from fossil fuels and mitigating the economic effects of rising natural gas and electricity prices. As anticipated, the European Union (EU) has raised concerns that the US IRA will lure investment in crucial green economy manufacturing away from EU-based companies. In response, the European Commission (EC) has introduced a new "Green Deal Industrial Plan" aimed at fostering an environment that attracts net-zero investments by supporting EU manufacturing of green technologies and products. This plan explicitly mentions photovoltaic cells, heat pumps, wind turbines, hydrogen electrolysers, batteries, and carbon capture. Despite its grand ambitions, the Green Deal Industrial Plan has yet to be fully fleshed out, as very limited additional funding has been proposed at this stage and the plan has not yet been discussed by the member states. The plan is built around four key elements: (i) a simplified regulatory framework, (ii) better access to funding, (iii) upskilling, and (iv) open trade to strengthen supply chains. At present, the EC's primary proposal is to loosen its stringent state aid constraints until 2025, allowing member states to match incentives from other countries (eg. USA). The expectation is that further incentives and improvements to the plan will emerge with negotiations and discussions with the member states. Supply chains will shift Car makers in the US will need to eventually eliminate China from their supply chains. POSCO Chemicals and Samsung SDI recently signed a 10-year cathode supply deal, showcasing the shift towards supply chain re-organisation. Value chains will migrate toward the US or nations with trade agreements in place (e.g. Australia and South Korea). Since the passage of the IRA, several clean ammonia projects have been announced, nearly all located on the US Gulf Coast. The attractive IRA tax credits for hydrogen are driving the growth in ammonia production. For example, Linde has committed US$1.8b to supply clean hydrogen to OCI NV's greenfield blue ammonia project in Texas. This is an example of two non-US companies taking advantage of the IRA by developing projects in the US. Ford will invest US$3.5b in an EV battery plant in Michigan with technology support from CATL, the world's largest EV battery manufacturer. The factory is due to open in 2026 and will produce enough batteries for 400,000 EV's a year. Low carbon technology is mineral intensive Low carbon technologies and enabling infrastructure are significantly more mineral intensive compared to traditional fossil fuel technologies. For instance, an onshore wind plant requires nine times more mineral resources than a gas fired power plant (see Figure 3), while an EV requires six times the mineral inputs of a conventional car (see Figure 4) according to the International Energy Agency (IEA). Both the IEA and World Bank warn that current mineral supplies and investment plans fall far short of what is required for these technologies to reach their full potential. Figure 3: The mineral intensity of low carbon energy (kg). Source: IEA, Credit Suisse Figure 4: The mineral intensity of low carbon transport (kg) Source: IEA, Credit Suisse Implications for Australia The current trend sees nations competing to secure supplies of critical minerals required for global decarbonisation. In many ways, it is starting to resemble a global renewables trade war that will be fought both in technology and supplies of critical minerals. It is obvious that China will react to the IRA and Europe's Green Deal. China has been strategically acquiring supplies of critical minerals through investments in Australia and Africa, as they are the largest manufacturer of wind, solar, and batteries. As we mentioned in a recent article, an instance of a nation's efforts to secure the development of critical minerals can be seen in the Australian Federal government granting a non-recourse loan of $1,250m to Iluka Resources to develop the Eneabba Rare Earths Refinery in West Australia. The funding is from the Commonwealth Government's $2b critical minerals facility. Additionally, lithium-boron develop Ioneer has been one of the early beneficiaries of the IRA, with the US Dept of Energy (DOE) offering a conditional US$700m loan for approximately 10 years to develop its Rhyolite Ridge project in Nevada. Australia is in a pivotal position given it has a free trade agreement with the USA and is also rich in resources of critical minerals. The IRA - and perhaps eventually the new Green Deal in Europe - support our view that we are entering into a renewables supercycle that will keep the prices of critical minerals elevated for many years to come. Author: Brad Potter, Head of Australian Equities Funds operated by this manager: Tyndall Australian Share Concentrated Fund, Tyndall Australian Share Income Fund, Tyndall Australian Share Wholesale Fund Important information: This material was prepared and is issued by Yarra Capital Management Limited (formerly Nikko AM Limited) ABN 99 003 376 252 AFSL No: 237563 (YCML). The information contained in this material is of a general nature only and does not constitute personal advice, nor does it constitute an offer of any financial product. It does not take into account the objectives, financial situation or needs of any individual. For this reason, you should, before acting on this material, consider the appropriateness of the material, having regard to your objectives, financial situation, and needs. The information in this material has been prepared from what is considered to be reliable information, but the accuracy and integrity of the information is not guaranteed. Figures, charts, opinions and other data, including statistics, in this material are current as at the date of publication, unless stated otherwise. The graphs and figures contained in this material include either past or backdated data, and make no promise of future investment returns. Past performance is not an indicator of future performance. Any economic or market forecasts are not guaranteed. Any references to particular securities or sectors are for illustrative purposes only and are as at the date of publication of this material. This is not a recommendation in relation to any named securities or sectors and no warranty or guarantee is provided. |
.png)
 Source: CoreLogic, Report, Article
 Some familiar 2008 players are back again - i.e. Lloyds, Barclays and Credit Agricole - it is the emergence of a new batch of banks ranging from Japan, the Nordics, Canada and the Middle East that could be new sources of contagion. Nevertheless, few of these banks have attempted the same sort of balance sheet growth as the US banks that have already failed.