
News

Hedge Clippings |29 August 2025
The Reserve Bank of Australia has long insisted that monetary policy is about patience and judgement. Yet when it cut interest rates earlier this month, patience was nowhere to be seen.
Read more...

Performance Report: TAMIM Fund: Global High Conviction Unit Class
The TAMIM Fund: Global High Conviction Unit Class rose by +4.89% in July, outperforming the All Countries World (AUD) benchmark by +1.33%. Since inception in July 2011, the fund has returned +14.03% per annum, an outperformance of +0.59%...
Read more...

Performance Report: ASCF High Yield Fund
The ASCF High Yield Fund rose by +0.67% in July, outperforming the Bloomberg AusBond Composite 0+ Yr benchmark by +0.71% Since inception in March 2017, the fund has returned +8.12% per annum, an outperformance of +6.06% relative to the...
Read more...

Are you sure about that? The folly of forecasting
Two recent events have inspired Ian Lance to write (yet again) about the folly of forecasting when it comes to investment. The first was when the Danish healthcare company Novo Nordisk lowered their profit forecast for 2025, and the share...
Read more...

Performance Report: Insync Global Quality Equity Fund
The Insync Global Quality Equity Fund has returned +12.60% per annum since inception in October 2009, an outperformance of +0.62% relative to the benchmark which has returned +11.98% on an annualised basis over the same period.
Read more...

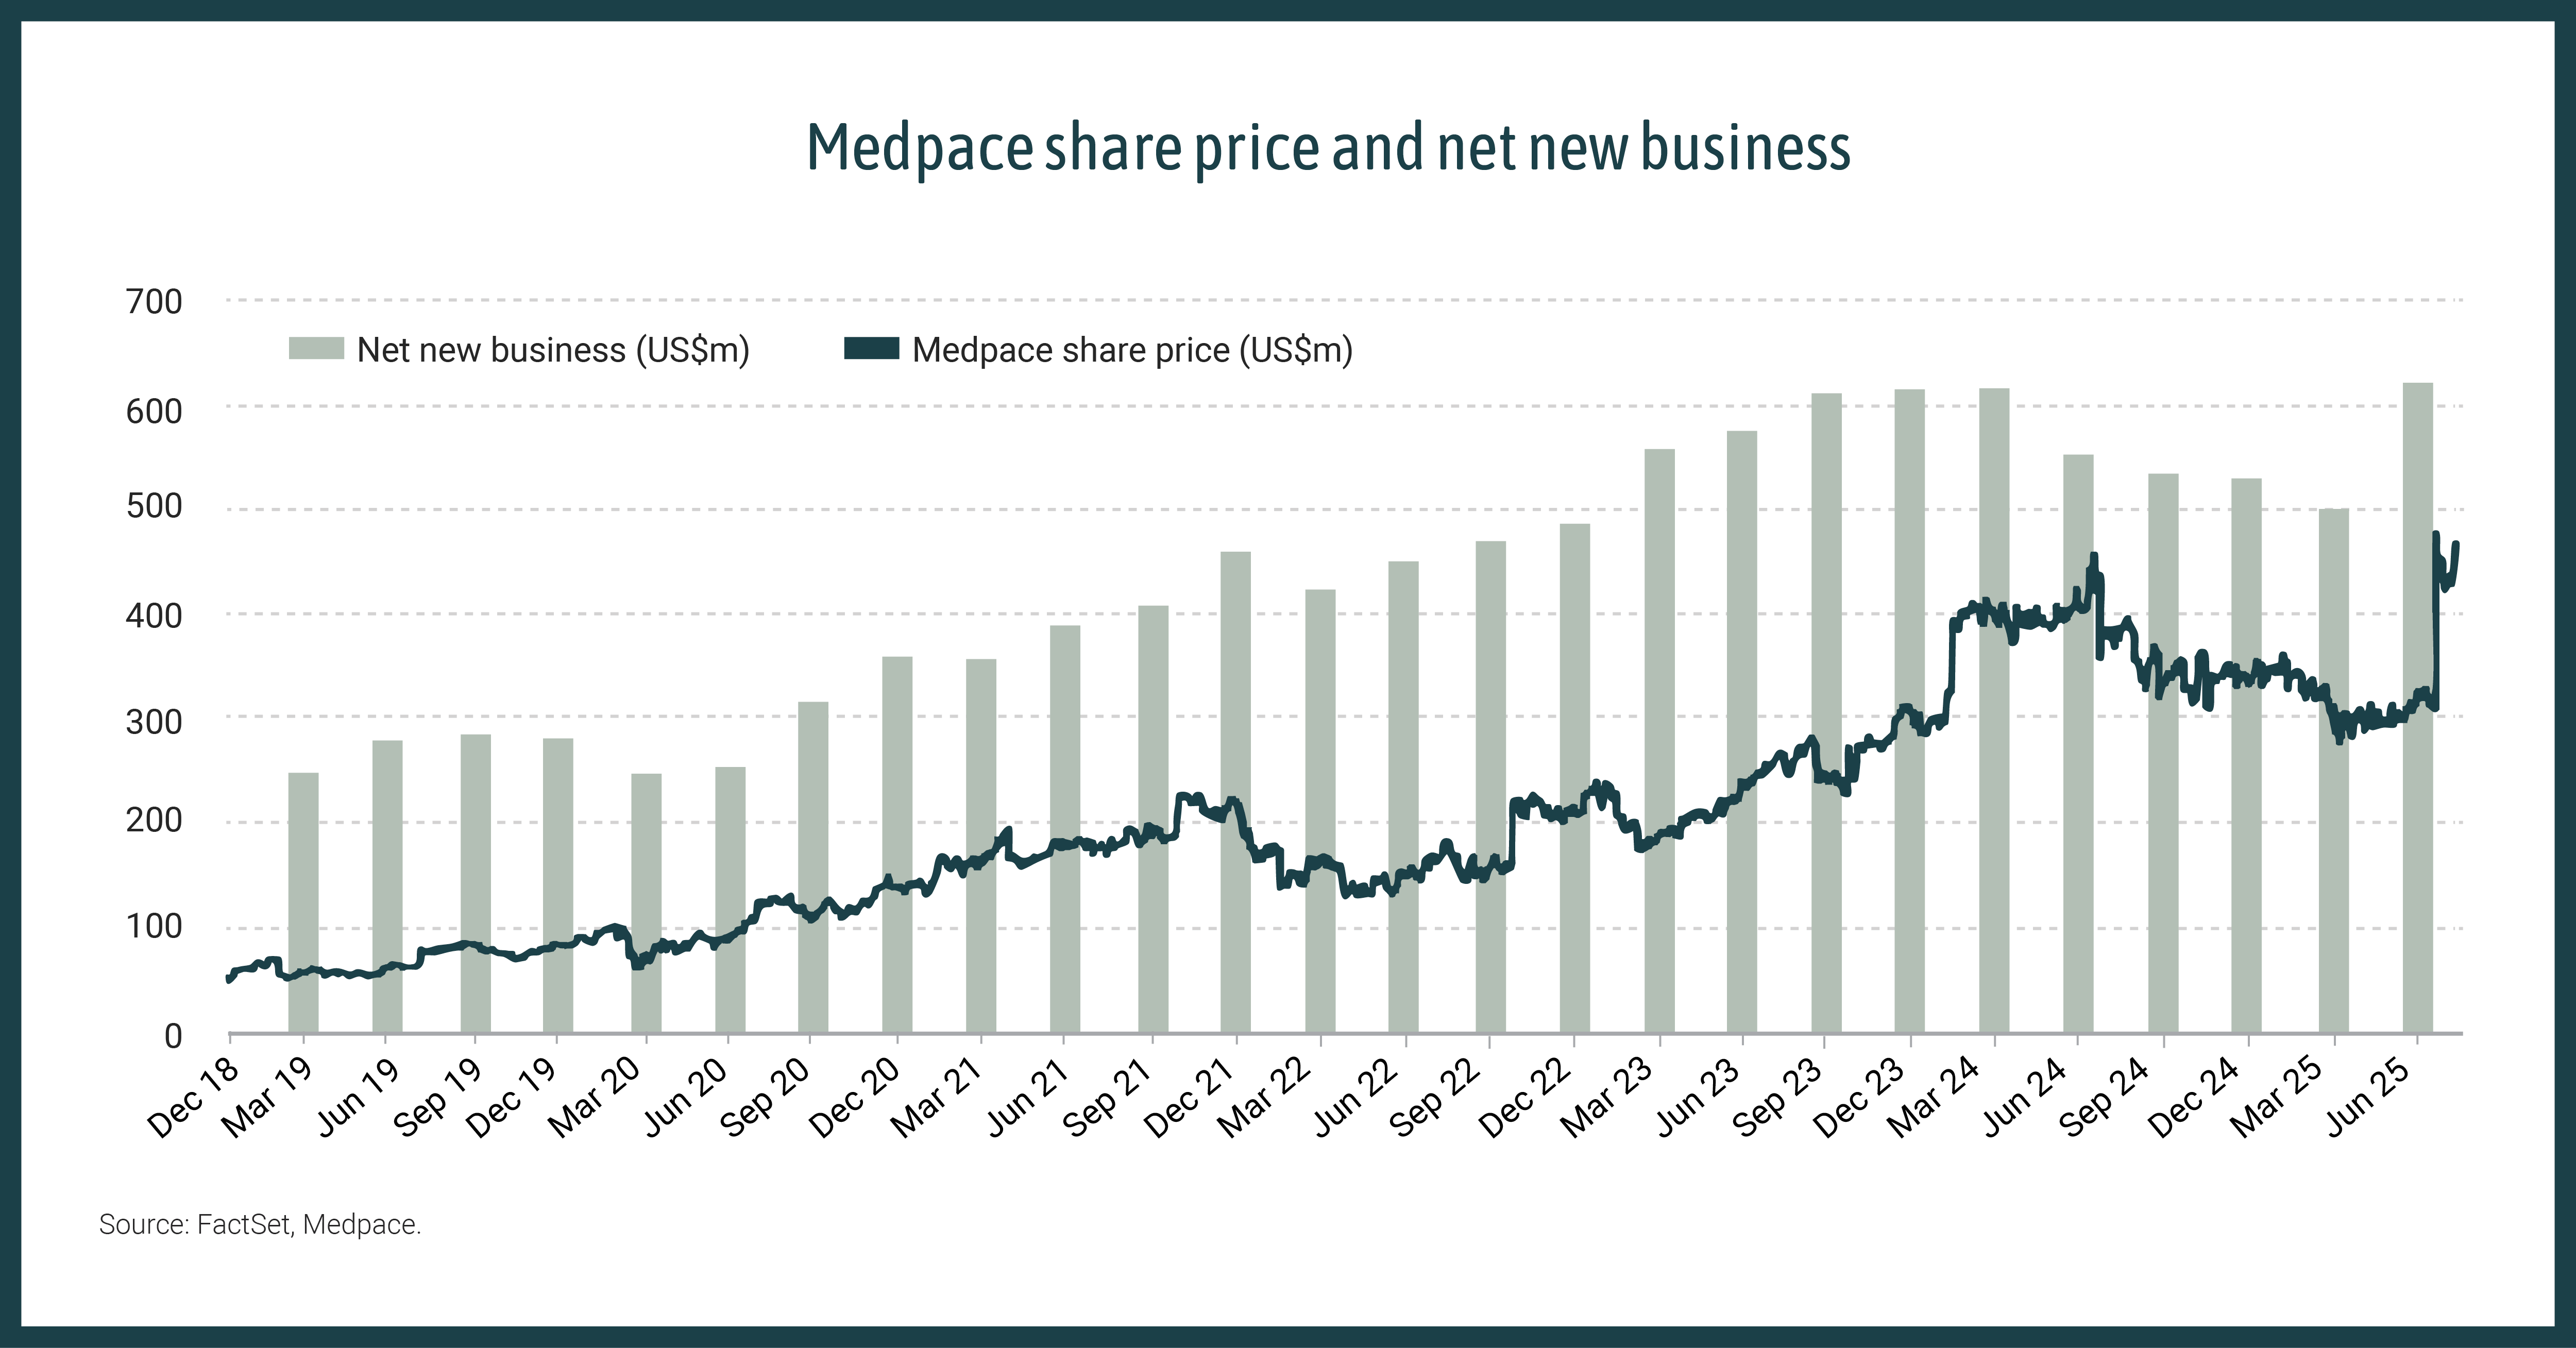
Recognising a stumble from a fall
Quality companies typically trade at premium valuations, but when cyclical headwinds are conflated with secular falls, even the best businesses can be dismissed by the market. When heroes stumble excessive negativity can present...
Read more...

Performance Report: DAFM Digital Income Fund (Digital Income Class)
The DAFM Digital Income Fund (Digital Income Class) rose by +1.66% in July, outperforming the RBA Cash Rate + 3% benchmark by +1.11%. Since inception in May 2021, the fund has returned +22.72% per annum, an outperformance of +16.93%...
Read more...

The art of the comeback
The investment world often prizes consistency and upward momentum--but some of the most compelling returns come from companies that have temporarily lost their way.
Read more...

Performance Report: Argonaut Global Gold Fund
The Argonaut Global Gold Fund has returned +22.56% per annum since inception in November 2022, an outperformance of +18.10% relative to the S&P Global Natural Resources AUD (TR) benchmark which has returned +4.46% on an annualised basis...
Read more...

Performance Report: Equitable Investors Dragonfly Fund
The Equitable Investors Dragonfly Fund rose by +9.56% in July, outperforming the ASX 200 Total Return benchmark by +7.20%. Performance was driven by Mad Paws and Spectur, while Archtis and DXN detracted, and Equitable expects continued...
Read more...