News

reaching new highs during April. (2-minute read)
19 May 2026 - Glenmore Asset Management - Market Commentary
|
Market Commentary - April Glenmore Asset Management May 2026 (2-minute read) The US market appeared to shrug off the ongoing war in Iran, reaching new highs during April. This was primarily driven by the tech sector, resulting in the NASDAQ rising +15.3%, representing its strongest monthly gain since April 2020. Whilst not being as tech-heavy, the S&P 500 was boosted by similar factors, rising +10.4%. US markets easily outpaced their international peers, with the Euro Stoxx 50 and FTSE 100 rising +5.6% and +2.0% during the month, respectively. Similarly, domestic markets lagged the US, with the ASX All Ordinaries Accumulation Index rising +2.4%. The gains were led by the Tech (+12.3%) and Real Estate (+8.0%) sectors, whilst Healthcare was the key detractor (-8.4%), dragged down by Cochlear (COH), which fell -44% following an earnings downgrade. In bond markets, the US 10-year bond yield rose +5 basis points (bp) to 4.37%, whilst its Australian counterpart rose +9bp to 5.1%. The Australian dollar rebounded during the month, rising +4.3% to US$0.72, implying an increase of 3.0 cents. Funds operated by this manager: |

18 May 2026 - Performance Report: ECCM Systematic Trend Fund
[Current Manager Report if available]

18 May 2026 - China's Luxury Reset: What we're seeing on the ground and why it matters

15 May 2026 - Hedge Clippings |15 May 2026
|
|
|
|
Hedge Clippings | 15 May 2026 Last week, Hedge Clippings focused on the RBA's decision to raise rates, and the concerns raised by Nick Chaplin from Seed Funds Management and Renny Ellis from Arculus Funds Management that the Bank may have moved too soon when cutting rates last year, and now, thanks to inflation and energy prices, they're heaping further stress on households by returning them to their previous levels. Now we have the Budget. There is plenty in it for tax advisers, accountants and political commentators, but that is not AFM's lane. For managed fund investors, the issue is not tax detail, but the assumptions underneath the Budget, and the general thrust of the government, which is to target those with assets, or income, to find extra revenue. Our real concern is the emphasis and increased reliance on personal income tax as the major source of government revenue. Currently, this accounts for around 48-50% of total government revenue, but the AFR estimates it will rise to 54.5% by FY29-30. And you can forget the Treasurer's handout of $250 to each wage earner; this doesn't kick in until FY 2027-8, by which time the 68 cents per day will have been fully eroded by a combination of inflation and/or bracket creep. Thanks, Jim! Budgets are full of forecasts. Markets are full of people discovering which forecasts were wrong. Treasury expects headline inflation to reach 5.0% through the year to the June quarter 2026, with most of the increase attributed to higher fuel prices. It then expects inflation to decline to 2.5% by the June quarter 2027, helped by an assumed fall in global oil prices from mid-2026. Growth is forecast to slow from 2.25% in 2025-26 to 1.75% in 2026-27, before recovering to 2.25% in 2027-28. That is the soft-landing version: inflation eases, growth slows but does not break, unemployment rises gradually, and households absorb more pressure. It may prove right. It may also prove optimistic. The Budget acknowledges the outlook is highly uncertain, particularly around the Middle East conflict, supply chain disruption, and persistently high inflation. For managed fund investors, the question is not whether Treasury's forecasts are right or wrong. The better question is whether portfolios are being built as though those forecasts are guaranteed. That is where fund selection matters. If rates stay higher for longer, long-duration growth assets, listed property, infrastructure and parts of fixed income remain exposed to valuation pressure. If growth slows more sharply than expected, credit risk becomes more important, particularly in lower-rated or less liquid strategies. If inflation remains sticky, cash and floating-rate income may continue to look attractive, but investors still need to understand what risk is being taken to generate yield. Private credit is a useful example. It has become popular for good reason: investors want income, floating-rate exposure, and lower correlation to listed equities. But ASIC has identified poor private credit practices as one of its 2026 enforcement priorities, and has flagged increased retail exposure to private credit markets as a key issue. However, not all private credit is the same, depending on the way the fund is managed, spread of risk, and the underlying asset type in the fund. The Budget also points to more scrutiny of managed investment schemes, including ASIC's use of data and consultation on new data collection powers. That is no bad thing. In a tougher market, investors need more than a good headline return. They need to understand liquidity, leverage, valuation policies, concentration, volatility, drawdowns and how a fund may behave if the assumptions do not hold. The Budget's real message for investors is not hidden in the tax act which now exceeds 14,000 pages. It is in the forecasts. If inflation falls, oil prices ease, and growth holds up, the path is manageable. If not, the next twelve months may test which funds are resilient and which were priced for a forecast that was too neat. News | Insights
Prediction Markets: The next big disruption in investing? | Magellan Investment Partners April 2026 Performance News Seed Funds Management Financial Income Fund Insync Global Capital Aware Fund |
|
|
If you'd like to receive Hedge Clippings direct to your inbox each Friday |

15 May 2026 - Performance Report: Bennelong Long Short Equity Fund
[Current Manager Report if available]

Datt Capital.
15 May 2026 - Manager Insights | Datt Capital
|
Chris Gosselin, CEO of FundMonitors.com, speaks with Emanuel Datt, founder and Chief Investment Officer at Datt Capital. Emanuel discussed recent market volatility, the divergence between large and small caps, and the opportunities emerging in the small companies space. He also discussed Datt Capital's approach to sector analysis, including technology, AI adoption, and energy, as well as the Fund's cash position and ability to act on market dislocations. Disclaimer: This conversation with FundMonitors was recorded prior to the release of the federal budget. |
|
|
Funds operated by this manager: Datt Capital Absolute Return Fund , Datt Capital Small Companies Fund |
|
|
|

14 May 2026 - Performance Report: DS Capital Growth Fund
[Current Manager Report if available]

14 May 2026 - It's the end of the world as we know it... and We Feel Fine.
|
It's the end of the world as we know it... and We Feel Fine. Revolution Asset Management April 2026 5-minute read |
|
Seeing the recent media headlines, one could be forgiven for thinking private credit is facing its end-of-the-world moment. The current media commentary has been dominated by rising default fears, valuation and redemption pressures, and warnings that the asset class is being tested for the first time in its modern form. The tone is urgent and unmistakably negative. This brings to mind the popular band, R.E.M.'s, 1987 release It's the End of the World as We Know It - a rapid fire sequence of alarming imagery that sounds like chaos unfolding in real time. However, as Michael Stipe (lead singer of R.E.M.) reminds us in the chorus... "I feel fine". The contrast reflects what Revolution Asset Management (Revolution) is experiencing in today's private credit market. While the noise and volatility are real and persistent, so too are disciplined deployment, conservative underwriting, a deliberate focus on non cyclical sectors, a refusal to chase yield (and risk), and experience driven portfolio construction which continues to underpin resilience. Why US Centric Developments Are Shaping Global Private Credit SentimentThere is no denying that parts of the global private credit market are under pressure. Much of the negative press is driven by developments in the U.S., where the asset class has grown rapidly over the past decade and where stress is now emerging in specific segments. This includes the so-called "SaaSpocalypse", redemption and liquidity pressures or rising default fears. In the U.S., private credit has had significant exposure to software and technology borrowers, alongside the widespread adoption of covenant lite structures that emerged during a prolonged period of strong inflows into the private credit segment. Additionally, general lending terms continued to weaken, and lenders were extending higher leverage, simultaneously. Over time, vulnerabilities that were already embedded in parts of the U.S. private credit market, such as higher opening leverage, aggressive EBITDA adjustments, covenant-lite structures and focusing on growth rather than cash flow generation were exposed, and some of those structures have now come under strain. Selective defaults, payment in kind interest, and amendments to loan terms have naturally attracted attention. As Mike Tyson once said: "Everybody has a plan until they get punched in the face". In the current environment, rapid deployment and relaxed processes work - until they don't. In this credit cycle, the consequences could be more severe, with recoveries potentially lower due to higher opening leverage and weaker underwriting standards. This narrative has been amplified by publicly traded vehicles. Share price volatility, widening discounts to net asset value, and a handful of high profile credit events have made for compelling headlines. But these headlines, by their nature, compress nuance and often extrapolate localised issues into broad conclusions about an entire asset class. The Reality: Dispersion, Not DeteriorationBeneath the surface, the private credit landscape is showing dispersion rather than systemic weakness. Performance outcomes are diverging based on underwriting standards, sector exposures, portfolio construction, and manager experience. Portfolios built with aggressive leverage assumptions, heavy exposure to smaller companies and cyclical earnings, or generally poor underwriting standards are more exposed to investor sentiment and market ructions. By contrast, private lenders that prioritised downside protection, with conservative structures, and focused on borrower cash flow stability are experiencing more stable outcomes. This is not unusual. Credit cycles have always been periods where discipline is revealed and rewarded. What about the "SaaSpocalypse"?SaaS (Software as a Service) companies that were previously considered market darlings, have also come under pressure as investors fear the potential impacts of AI disrupting traditional SaaS business models. For context, U.S. private credit portfolios and Business Development Companies typically contain quite material software and technology exposures (generally in the order of 20-30%). This compares to the single-digit-percentage of the Australian private credit market being in the software segment, with literally a handful of names, which are commonly referred to as "mission critical". Additionally, the concept of Annual Recurring Revenue, while foreign in Australia, is commonplace in the U.S., where private lenders provide funding based not on EBITDA and cash flow, but how fast their revenue is growing. As was recently outlined in the article: AI, Software, and Private Credit: Separating Credit Risk from Market Noise , not all software companies are created equally. This emphasised that the more well-known Australian mission-critical software providers have significant moats around their business in terms of the degree of embeddedness in their customer operations as well as already incorporating AI within their platforms to enhance their offering. Additionally, the Australian software companies in the private credit space are also considered platforms rather than applications, further adding to their embedded and more defensive nature. Set against Australia's more conservative lending framework and historically strong equity buffers, this means that while enterprise values may be lower than they were even a few months ago, a substantial layer of equity protection remains in place for senior lenders. In this structure, equity absorbs valuation pressure first, with credit impacts only emerging after a significant erosion of equity value. Why Private Credit Looks Different in Australia and New ZealandImportantly, Australia does not map neatly into the U.S. private credit narrative. Australian private credit has developed along a very different path, shaped by market structure, regulation, and borrower behaviour, with Australian private credit focusing more on conservative structures, asset backed strategies, and businesses with tangible cash flows.
For these reasons, applying U.S centric conclusions to Australian portfolios risks missing what matters on the ground. Stability through volatility, not dependent on optimismAgainst this backdrop, Revolution's portfolio positioning has been deliberate. Capital deployment has consistently prioritised credit discipline, with a focus on structure, security and borrower quality. Revolution has concentrated on non cyclical industries with stable demand drivers and resilient cash flows, diversified across the Australian and New Zealand private credit landscape, allowing the investment team to be selective and find the best relative value in markets they know well. Patient capital has also been a defining advantage through this period of volatility. By structuring funds with long�'dated capital and conservative liquidity settings, Revolution does not become a forced seller when markets dislocate. Instead, Revolution acts deliberately at moments when others cannot. As market volatility has increased, pockets of the private credit market have experienced liquidity�'driven selling, particularly from vehicles managing redemptions or facing near�'term funding constraints. These situations are rarely driven by a deterioration in underlying asset quality, but by the need to raise liquidity. For private credit managers with patient capital, this creates opportunity. The ability to acquire high�'quality loans, often at discounts, creates opportunities to deploy capital at more compelling risk�'adjusted returns. This dynamic reinforces why stability through volatility matters, not just defensively, but as a source of long�'term return generation. Revolution has encountered cycles like this before. Periods of rising interest rates, tightening liquidity, and heightened scrutiny are not new. What changes from cycle to cycle is who is prepared for them. Rather than viewing volatility as a signal to retreat, Revolution sees this as a natural phase of the credit cycle, one that reinforces the value of conservative underwriting, patience, and manager experience. Amid the market noise, discipline and resilience prevailsWhen R.E.M. sang It's the End of the World as We Know It, they weren't singing about ignoring risk or pretending chaos does not exist. It is about perspective. Amid the noise, there is a calm recognition that not everything unfolding is unexpected and not everything is catastrophic. The private credit landscape today is undergoing a healthy process of differentiation. Strong portfolios are distinguishing themselves from weaker ones. Structural discipline will be rewarded. And markets are once again reminding participants that credit is, ultimately, about risk management rather than return maximisation. While headlines may stay dramatic and volatility may persist, private credit lenders with resilient portfolios especially in markets like Australia and New Zealand, with materially different fundamentals to the U.S., remain well positioned. The world may sound like it is ending, but from where we sit, we feel fine. |
|
Funds operated by this manager: Revolution Private Debt Fund II , Revolution Wholesale Private Debt Fund II - Class B Important Information This information is for wholesale and professional investors only and has been prepared by Revolution Asset Management Pty Ltd ACN 623 140 607 AFSL 507353 ('Revolution'). Channel Investment Management Limited ACN 163 234 240 AFSL 439007 ('CIML') is the trustee and issuer of units for the Revolution Private Debt Fund II, Revolution Wholesale Private Debt Fund II (collectively 'the Funds'). Channel Capital Pty Ltd ACN 162 591 568 AR No. 001274413 ('Channel') provides investment infrastructure and distribution services for Revolution and is the holding company of CIML. FundRock NZ Limited is the issuer of units in the Revolution Private Debt PIE Fund (NZD) (the 'NZ Fund'). Public Trust is the independent trustee of the Scheme of the NZ Fund. Revolution is the appointed Investment Manager for the NZ Fund. Refer to fundrock.com/fundrock-new-zealand for more information. The NZ Fund is intended for the exclusive use of wholesale investors, as defined by the Financial Markets Conduct Act 2013. This information is supplied on the following conditions which are expressly accepted and agreed to by each interested party ('Recipient'). This information contains general financial product advice only and has been prepared without taking into account the objectives, financial situation or needs of any particular person. It is intended solely for wholesale clients (including sophisticated investors) as defined under sections 761G and 761GA of the Corporations Act 2001 (Cth). Revolution is not licensed in Australia to provide financial product advice or other financial services to retail investors. The information provided should not be considered personal advice, a recommendation, or an offer to invest in the Funds. Recipients should not rely on this information in making investment decisions. A Recipient should, before making any investment decisions, consider the appropriateness of the information, and seek professional advice. Neither Revolution, Channel, CIML, FundRock NZ Limited or their representatives and respective employees or officers (collectively, 'the Beneficiaries') make any representation or warranty, express or implied, as to accuracy, reliability or completeness of this information or subsequently provided to the Recipient or its advisers by any of the Beneficiaries, including, without limitation, any historical financial information, the estimates and projections and any other financial information derived there from, and nothing contained in this information is, or shall be relied upon, as a promise or representation, whether as to the past or the future. All investments contain risk. Past performance is not a reliable indicator of future performance. For further information and before investing, please read the Information Memorandum available on request. |
13 May 2026 - Performance Report: Glenmore Australian Equities Fund
[Current Manager Report if available]

Markets don't wait for certainty. They reprice the expectation. (4-minute read)
13 May 2026 - When the Map Changes Mid-Journey
|
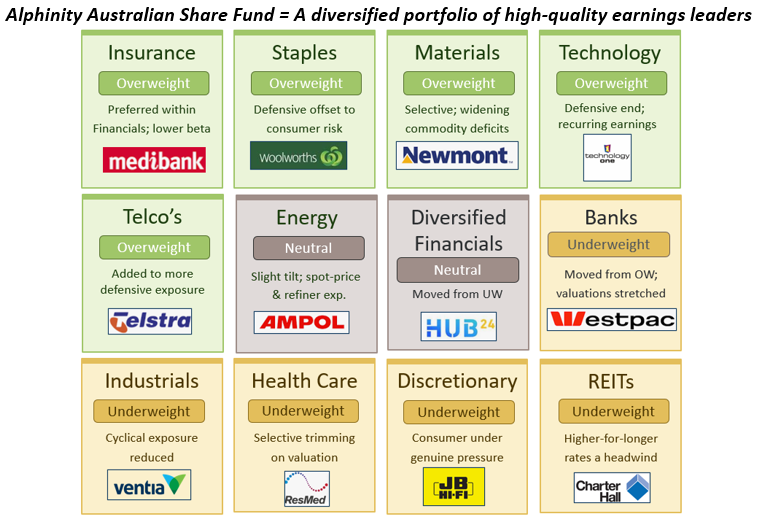
When the Map Changes Mid-Journey Alphinity Investment Management April 2026 4-minute read |
|
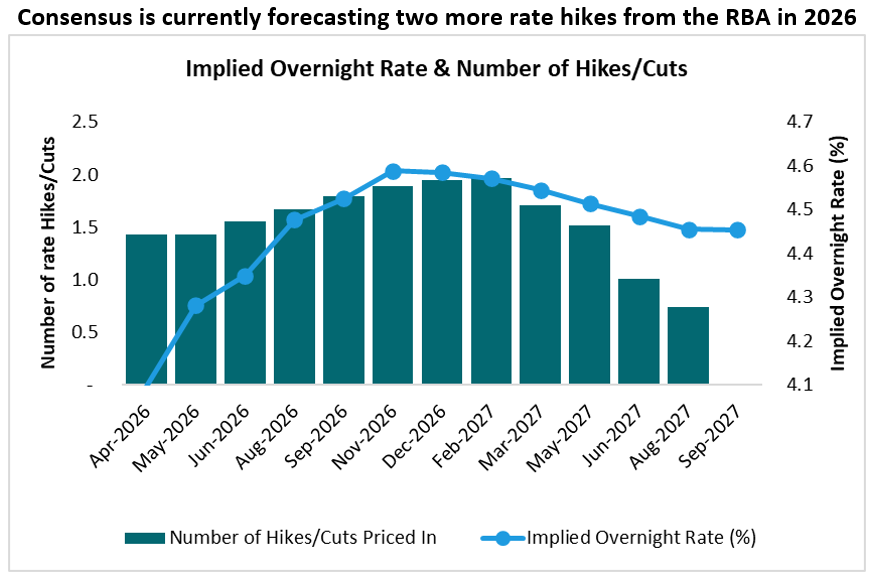
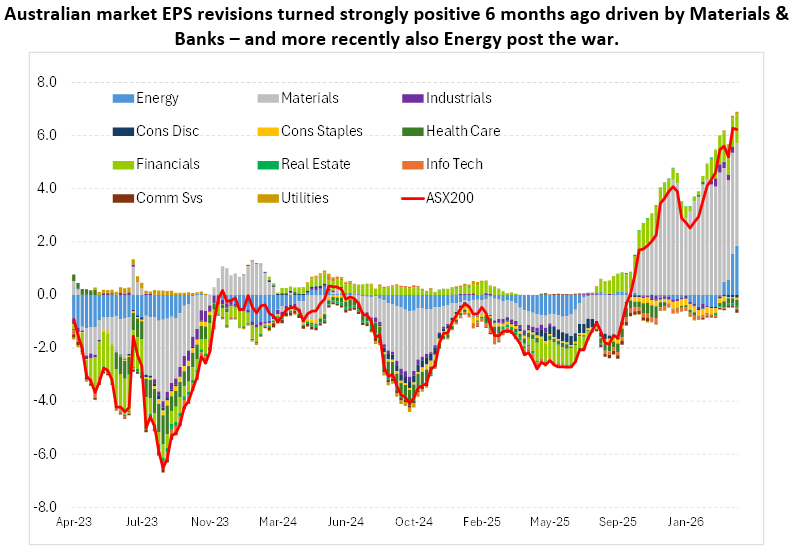
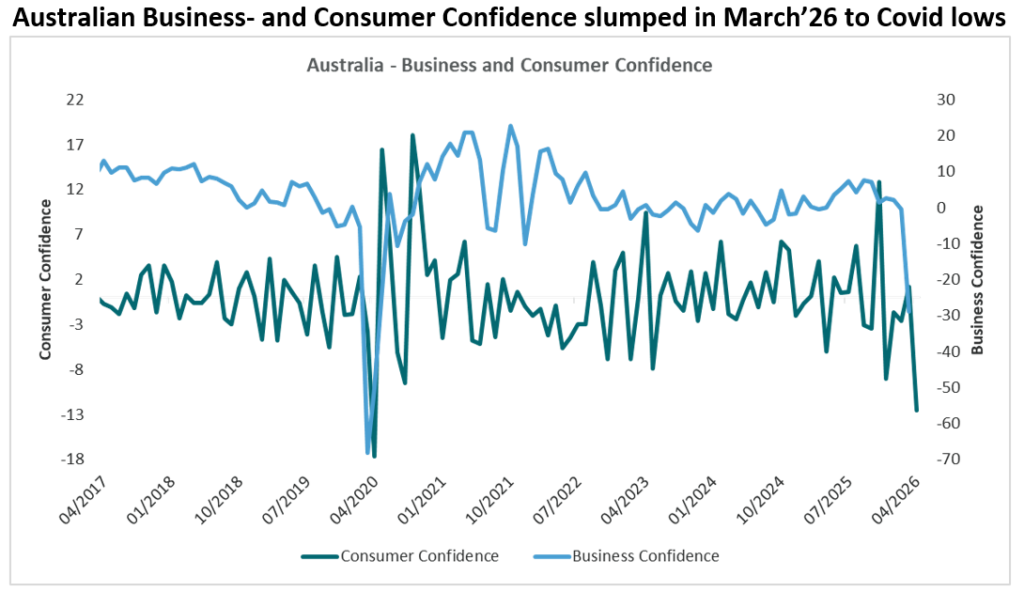
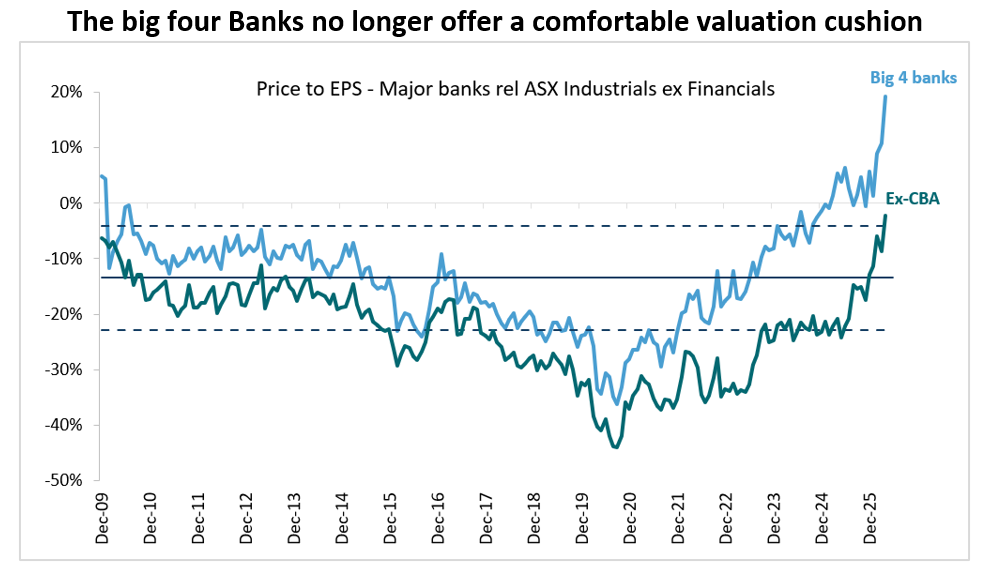
The macro has taken over. Here's how we're navigating it Markets don't wait for certainty. They reprice the expectation. After a strong run into February 2026, led by Materials and Banks, two of the most economically sensitive corners of the Australian market, the landscape has shifted quickly. The Middle East conflict has moved markets from micro to macro almost overnight, raising a familiar and uncomfortable question: what happens to growth from here? The Australian backdrop is more complicated than most Australia entered this period with a problem most markets didn't have to the same extent: a persistent lift in underlying inflation that had already forced the RBA's hand. Two rate rises into a new cycle, and central bank credibility was already being tested. Consumer confidence had begun to wobble, and spending was pulling back even before the uncertainty and inflation caused by the war was a risk.
Source: Bloomberg, 21 April 2026 What we're watching Earnings. Full stop.
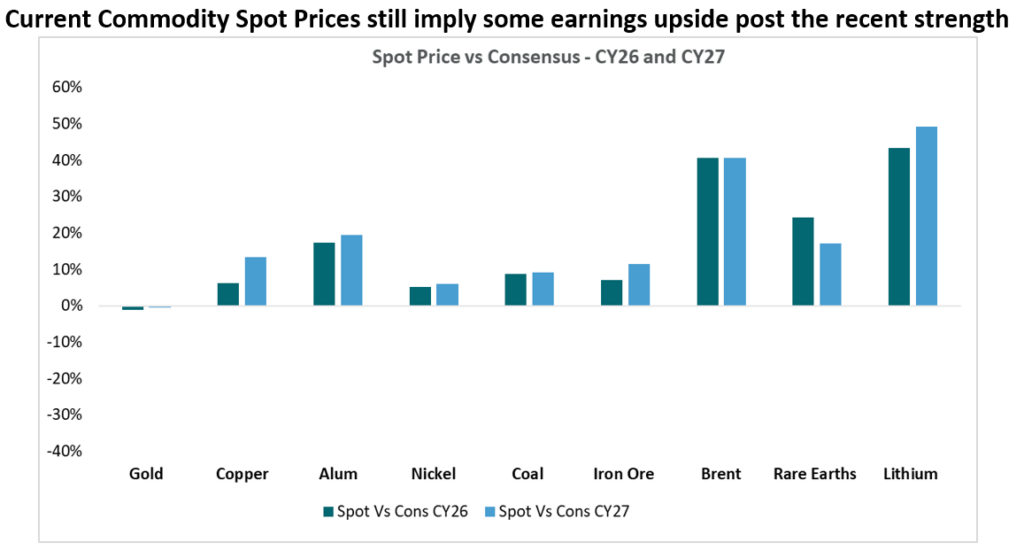
Source: UBS, 31 March 2026 How the portfolio is positioned With genuine uncertainty elevated, this is not the environment for bold, concentrated bets. Instead, we've been making deliberate, measured tilts -- reducing exposure to emerging risks and adding to areas with more resilient earnings
Source: Alphinity, Bloomberg, 21 April 2026
Source: Bloomberg, 21 April 2026
Source: Barrenjoey, Alphinity, 31 March 2026 The bottom line This is an autumn for patience. The macro uncertainty is real, and we won't pretend otherwise. But uncertainty is not the same as paralysis -- it's an invitation to think carefully about where earnings are genuinely supported and where they are not.
Source: Alphinity, 20 April 2026 |
|
Funds operated by this manager: Alphinity Australian Share Fund , Alphinity Concentrated Australian Share Fund , Alphinity Sustainable Share Fund , Alphinity Global Equity Fund , Alphinity Global Sustainable Equity Fund This material has been prepared by Alphinity Investment Management ABN 12 140 833 709 AFSL 356 895 (Alphinity). It is general information only and is not intended to provide you with financial advice or take into account your objectives, financial situation or needs. To the extent permitted by law, no liability is accepted for any loss or damage as a result of any reliance on this information. Any projections are based on assumptions which we believe are reasonable but are subject to change and should not be relied upon. Past performance is not a reliable indicator of future performance. Neither any particular rate of return nor capital invested are guaranteed. |