News
26 Oct 2023 - Why Cash Is (Still) Not King
Why Cash Is (Still) Not King Redwheel October 2023 |
||||||||||||
Cash is finally worth talking about. Almost two decades of considerable accommodative policy have handed cash a woeful reputation, but despite inflation being still too high for comfort, cash in various parts of the world is managing to offer a real return - but is this really the return of the king?
Source: Bloomberg, 3-month government bond yields and CPI as at 29/09/23 and 31/08/23, respectively. The information shown above is for illustrative purposes. After an era of relatively unassuming inflation, investors are now largely keen for it to lose steam - but not without weighing up the cost, with the higher for longer narrative still fuelling speculation of a hard landing. Both cash and equities are influenced by, and at times arguably at the mercy of, central banks getting these decisions right, with current efforts to 'land' inflation proving a good example. Thankfully, equities have much more to their story through owning a piece of a company and capturing its potential; cash lacks the possibilities that equities can offer over the longer term. The outcomes of these possibilities are, undoubtedly, not always favourable; being an equity investor can certainly be painful at times. But we mustn't forget what being an investor means and requires: long-term thinking, and crucially, patience. "The stock market is a device for transferring money from the impatient to the patient." - Warren Buffett And patience often pays off. Whilst cash can seem like an idyllic cocoon for investors in choppier markets, investors run the risk of being left behind in the longer term. Without a doubt, cash has often provided better returns in challenging market backdrops, but over longer periods of time, other asset classes have flourished - particularly equities. On top of this, typically when cash yields are trending higher, the economy is heating up - and a burgeoning economy is usually supportive of equities. When cash yields are high and this constrains economic activity, then not only should equities struggle, but yields will likely have to fall to encourage a recovery. Whilst these scenarios are not exhaustive, both highlight how equities still will often, ultimately, have the upper hand.
Source: Redwheel, Bloomberg, total annualised returns in USD as at 29/09/23 . Past performance is not a guide to future results. No investment strategy or risk management technique can guarantee returns or eliminate risks in any market environment. Equities may have reigned, but these returns mask the sizeable downturns equity markets experienced during these periods. This points to another key drawback to allocating to cash: timing. Once you are out of the market, there is the notoriously difficult - and practically impossible to consistently get right - call of when to get back in. This daunting job is one of the best kept secrets in the world of investing; even when removing human emotion and behavioural biases, algorithmic approaches have been inconsistent in finding ways to time the market, though with AI in relative infancy, it could hold some promise if it can evolve to be able to keep up with markets. The recent uncertainty has seen cash continue to attract flows, but with an equity market that ultimately seems to be evergreen - no matter what you throw at it - investors could easily find themselves holding onto cash balances for longer than anticipated. Let's not forget that the longest US stock market bull run lasted nearly 11 years, or 131 months, following the fallout of the 2007/08 global financial crisis that created a much shorter, 17-month bear market. It was only stopped in its tracks by the Covid pandemic, but a new bull run was subsequently born, albeit narrower and shorter. Further, the bear market prompted by the outbreak of Covid only lasted a mere 33 days and may have wiped over c.30% off the market, but the market rebounded c.70% for the rest of the year, which meant the S&P 500 delivered a total return just shy of 20% for 2020 - considerably higher and a real return compared to 0.7% from US T-Bills. Although these are extreme examples, over the years, some of the most sizeable stock market gains have taken place during, or just after, bear markets. Clearly, based on this, cash is not king - unless you (miraculously!) have impeccable timing. Time in the market often proves a lot more fruitful than market timing. You have to be in it to win it; granted, this mantra is an oversimplification - reaping the benefits of equities' outperformance does not come without experiencing some shorter-term volatility; investing isn't about a quick and easy win but comes down to wins outweighing losses and incrementally building on those wins over time when it comes to achieving longer term gains.
Source: Redwheel, Bloomberg. MSCI World Index, total returns in USD as at 29/09/23. Past performance is not a guide to future results. We have always believed that it is better to stay engaged with equities, but we don't just mean any equities. When it comes to investors thinking about taking risk off the table, we believe balancing the equity mix needs more of the spotlight than turning to cash. Stocks offering higher income than the market are often put head-to-head with cash given their dividend payments. Income stocks may not offer the prospect of sizzling returns in the shorter term compared to other areas of the equity market, but those with quality characteristics, particularly, can compound (growing) dividends as well as offer capital appreciation when it comes to longer return horizons, where equity volatility tends to even out. Compared to cash, dividend payments come with greater uncertainty, but we have found that focusing on quality companies cushions the risk to dividend payments. Further, dividends have often experienced softer contractions and recessions compared to earnings and market returns. We have also found that being disciplined in sticking to stocks that compound income that is higher than the broader market helps evade temptation to time the market, due to the focus on compounding dividends given its significant contribution to returns over the longer term. Even though this century has so far seen dividends often take more of a backseat in US markets, they have firmly outpaced inflation, whilst the same cannot be said for US T-Bills.
Source: Redwheel, Bloomberg. Total returns (monthly) in USD, EPS (earnings per share) and DPS (dividend per share) of the MSCI World Index, rebased indices, as at 29/09/23. Past performance is not a guide to future results.
Source: Redwheel, Bloomberg. DPS of the S&P 500, US CPI and Bloomberg US Treasury Bill Index, rebased indices, as at 29/09/23. Past performance is not a guide to future results. We believe that for cash to truly serve more of a strategic purpose, it ultimately comes down to timing to ensure to not miss out on equity markets' ability to soar. After all, when was the last time investors were inspired by a bull market in cash? We recognise that market timing is not our forte; as investors we are in it for the longer term - but we don't believe cash is when it comes to helping our strategy and investors achieve longer term returns. |
||||||||||||
Funds operated by this manager: Redwheel China Equity Fund, Redwheel Global Emerging Markets Fund |
||||||||||||
Sources: [1] Indices: Developed Market Equities (DM) - MSCI World Index; Developed Market Value Equities (DM Value) - MSCI World Value Index; Developed Market Growth Equities (DM Growth) - MSCI World Growth Index; Emerging Market Equities (EM) - MSCI Emerging Markets Index; Global Bonds - Bloomberg Global Aggregate Bond Index; Commodities - Bloomberg Commodities Index; US T-Bills (Cash) - Bloomberg US Treasury Bill Index. Key Information |
25 Oct 2023 - The Fall and Rise of Uranium
The Fall and Rise of Uranium Eiger Capital October 2023 The nuclear industry is undergoing something of a renaissance. For anyone with an interest in the industry, even a passing one, it's been a painfully long wait, but the uranium worm certainly seems to have turned. Over the past 12-18 months, we have added positions in Boss Energy (BOE.ASX) and Paladin Energy (PDN.ASX), two uranium miners. At the time of writing, the uranium spot price had topped US$70/lb, a 13-year, pre-Fukushima high and contracted volumes are on the up. In that time there has been more than one surge in the commodities sector, but uranium has missed out every time. So how did we get here?
Langer Heinrich Stage 3 construction circa 2011 (about a month prior to Fukushima) - uranium was looking up The FallNot much moves quickly in the nuclear industry. The last time we experienced this level of positivity, one of our team was on site at Paladin's Langer Heinrich (LH) uranium mine in Namibia. That was in early 2011 during the Stage 3 expansion (see above). The mood then had turned bullish even though the uranium price had peaked three years earlier at over US$130/lb . Uranium price, US$/lb (Source: Cameco) Most commodities overshoot and that was certainly the case with uranium in 2007 as phenomenal Chinese growth erased a decades long malaise in uranium. However, over the next three years, the price did not dip below US$40/lb and exceeded US$70/lb around the time of that LH site visit - about where we find ourselves now. Prices were high, the mine was expanding, and uranium was being hailed as a natural alternative to coal for reliable baseload, driven by a "green energy" tailwind. What could go wrong? An earthquake. And an unusually big and complex one at that. It struck the east coast of Japan in March 2011, just a handful of months after that LH site visit. At magnitude 9, the so-called Great East Japan Earthquake was the largest in Japan's history and the fourth largest recorded since the advent of modern seismology, 110 years earlier. In other words, this was a very rare event. The earthquake and resulting tsunami disabled the cooling systems of the coastal Fukushima Daiichi Nuclear Power Plant, resulting in core meltdown in three reactors. While the Daiichi plant, which first began operating in 1971, was able to withstand the ground movement produced by the quake, it was not designed to cope with the 15m tsunami that followed. Unfortunately, the engineers had used a 1960 Chilean earthquake and its resultant 3m tsunami to design some of the safety systems at Daiichi. The plant's 10m elevation should have allowed plenty of room for a "regular" tsunami but proved to be inadequate on this occasion as no-one anticipated the magnitude of this event. In short, Japan's nuclear industry, which accounted for ~30% of the country's electricity generation, shutdown in a nationwide safety review, whilst a pall was cast over the global industry that would last a decade. A long, dark winterFukushima's impact on the global nuclear industry cannot be underestimated. For example, following the accident, Germany immediately shutdown eight of its 17 reactors and committed to close the remainder of its fleet, the last of which occurred in April 2023. Prior to the disaster, nuclear energy accounted for one-quarter of Germany's electricity production. Overall, global electricity production from nuclear dropped 11%. Justifiably, fear of further accidents at older reactors and the increased cost of upgrading/replacing to newer, safer designs, impeded growth of the industry. Furthermore, sentiment was greatly impacted by the potential of renewables - would nuclear even be needed as baseload if windmills and solar panels could deliver zero-carbon power? On the supply demand side, Kazakhstan, the world's biggest producer of uranium, was ramping up production at the time of Fukushima, and continued to do so beyond the shutdown of the Japanese industry. To compound the problem, Canada's Cameco commenced full-scale commercial production at the underground Cigar Lake in May 2015. The eventual commissioning was complex and protracted. Development had started a decade earlier, but a series of water inflows flooded the mine (it's not called Cigar Lake for nothing). At the bottom in October 2016, the spot price of uranium dipped to US$18/lb and it would be another four to five years before market would stir. The SpringWe can probably trace the start of the current "boom" to mid-2021 when Canada's Sprott Asset Management founded its Sprott Physical Uranium Trust (SPUT), a physically backed financial product. Its purchases helped soak up excess market supply within a gently improving backdrop for nuclear energy. This enthusiasm was shortly followed up at the COP26 meeting in Glasgow, Scotland, later that same year, where nuclear energy again featured as a low-carbon alternative to coal baseload power but arguably with more urgency. It is increasingly apparent that net-zero by 2050 solely from renewables is extremely challenging and nuclear power represents one low-carbon way to fill the gap. In terms of power generation, nuclear energy offers several advantages over traditional baseload. Nuclear utilities are very long-life assets, land use is 30-100x less than other low CO2 options, CO2 emissions/kWh are lower than all other power sources except for wind, and life extensions of nuclear power plants represents the lowest cost low-CO2 energy. Other factors have combined to add upward pressure to the uranium price. For example, in the US, the Inflation Reduction Act (Aug 22) provides tax credits and development incentives for existing reactors and uranium resources, while the DoE commenced purchases for its Federal Strategic Uranium Reserve (Sept 22). Elsewhere, nuclear energy has been included in the green energy taxonomies of the EU, UK and South Korea. In geopolitical terms, there is clear uranium (and gas) supply risk around Russia following the invasion of Ukraine and the coup in Niger, the world's sixth largest supplier, has caused consumers like France some concern. From a capital point of view, we are seeing increased investment in nuclear power from Asia in particular (see above). On the supply side, uranium exploration and development has plummeted and remains at multi-year lows. While the uranium market is a closed and esoteric one that can be difficult to decipher, there is incremental benefit in the short-term from this supply-demand dynamic. Where to from here?While the outlook for the uranium market is better than it has been for more than a decade, challenges remain. Nuclear energy is still a divisive issue due to ever-lingering safety concerns, and it could be argued that countries like Australia may never see its use. Other factors that impede acceptance include the upfront cost of construction, strict regulation and the time to build a new plant, where the median time is currently around 80-90 months. On the flip side, nuclear facilities are amongst the most rigorously engineered structures on Earth and provide very long life, consistent output. While upfront capex is very high, the levelized cost over the life of a nuclear asset is extremely competitive especially if life extensions to existing plants is considered. Moreover, new technologies, such as Small Modular Reactors (SMR) offer potential advantages in cost and safety. Finally, recent geopolitical developments such as the Russia/Ukraine conflict highlight the need for secure, reliable sources of power. In a world focused on low carbon electricity, it is not surprising that many nations are considering a nuclear future. Author: David Haddad, Principal and Portfolio Manager Funds operated by this manager: |
24 Oct 2023 - Australian Secure Capital Fund - Market Update
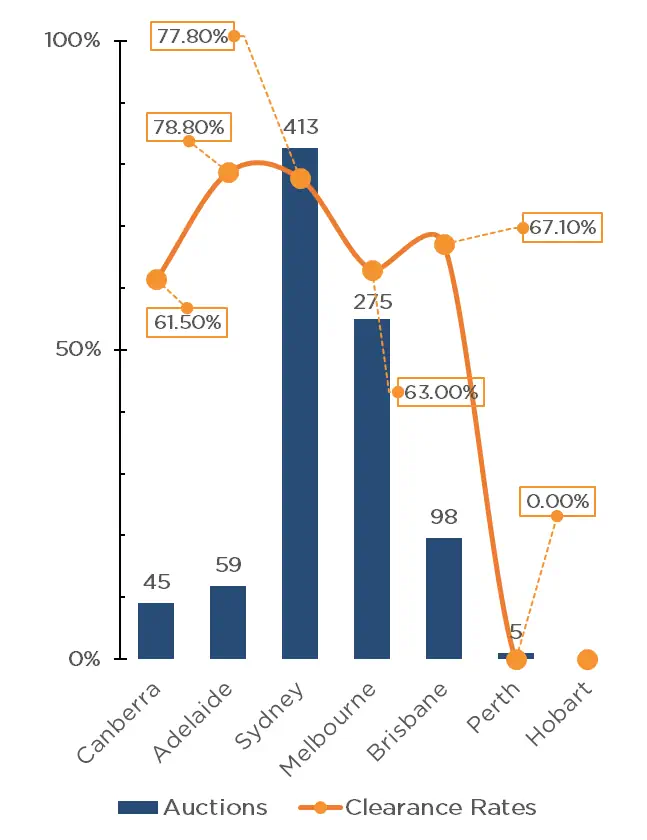
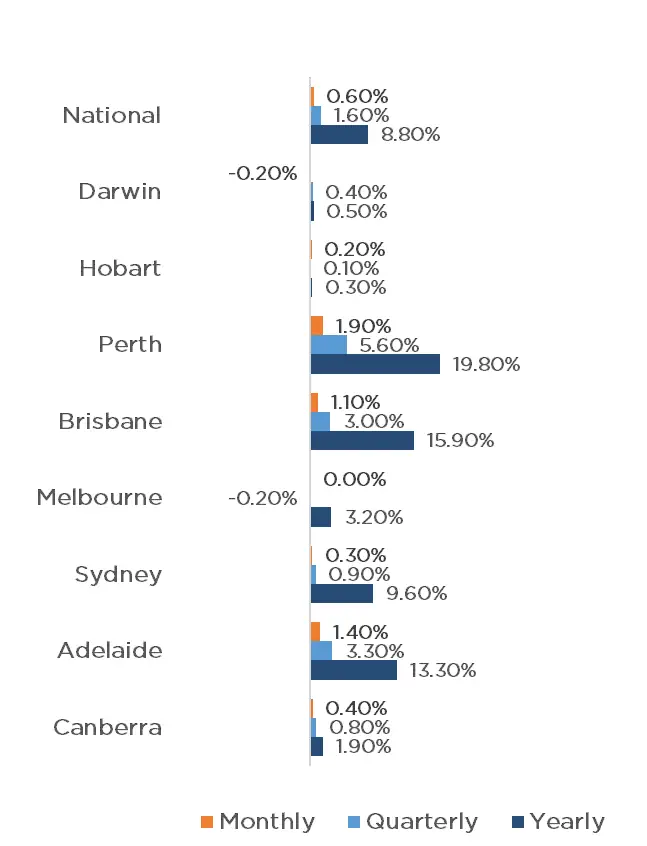
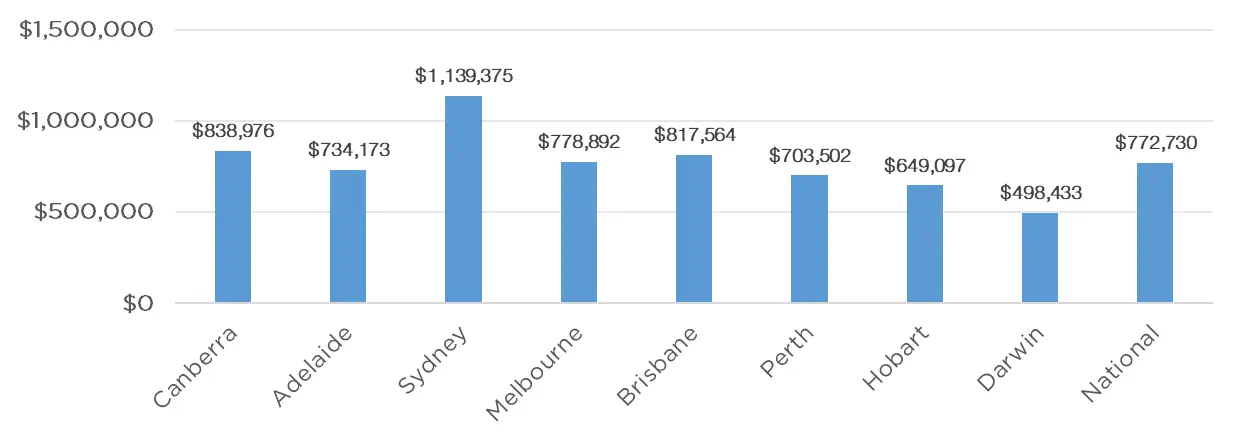
Australian Secure Capital Fund - Market Update Australian Secure Capital Fund October 2023 The first weekend of October saw the number of auctions decline significantly on the previous week (1215, down from 2,648), as is common on long weekends, caused by the AFL Public Holiday and the King's Birthday. Sydney recorded the most auctions of the capital cities, with 730 taking place, followed by Melbourne and Brisbane with 203 and 110 respectively. Adelaide and Canberra just missed out on triple digit figures, with 83 and 74 respectively, whilst just 13 and 2 auctions occurred in Perth and Tasmania respectively. Whilst the number of auctions declined for the week, clearance rates remained strong at 70.3% across the combined capitals (up from 59.7% last year). This was driven by Adelaide, Sydney and Brisbane all recording above 70% clearance rates with 79.3%, 71.7% and 70.7% respectively. Melbourne and Canberra also had moderate clearance rates of 66.0% and 62.5% respectively. The property market continued to grow yet again with a 0.8% rise for the month of September, taking quarterly growth to 2.2%. Adelaide experienced the largest monthly growth of 1.7%, followed by Brisbane and Perth with 1.3% each. Sydney, Melbourne, Canberra and Darwin all experienced growth with 1%, 0.3%, 0.2% and 0.1% respectively, whilst Hobart was the only capital city to fall in September with -0.6%. Quarterly data is similar, again with Adelaide leading the way (4.3%), closely followed by Brisbane (3.9%), Perth (3.6%) and Sydney (2.5%). Melbourne and Darwin both increased 1.3% for the quarter, with Canberra at 0.4%. Again, Hobart is the only capital to not experience growth, falling by 0.2% for the quarter. Whilst many economists predicted a softening in property prices in the later stages of 2023, dwelling values have remained strong. As we head into the spring and summer selling season, we may see supply increase slightly but the market remains extremely tight. Clearance Rates & Auctions Week of the 3rd of October 2023
Property Values as of 2nd of October 2023
Median Dwelling Values as of 2nd of October 2023
Quick InsightsHigher Blocks Means Lower CostsIn defiance of its own planning rules and legislation a local council in Melbourne has intervened to approve another two extra storeys on an apartment building development. The move was done under pressure to triple the proportion of affordable housing the development might offer. As the urgency of a tight rental and housing market continues to grow we may very well be seeing similar occurrences throughout the capitals as local councils realise they have a role to play. Source: Australian Financial Review Vacancy LatencyVacancy rates have once again dipped below the threshold and rents are likely to rise once more in the next quarter. Without more supply from inner city developers and less demand from migration and those who cannot afford to buy, the situation will only continue. A suburb of particular has been Ryde, in New South Wales which has recorded a year-to-date rise of 17% in rents. Source: Australian Financial Review Develop or SellDan Andrews stepped down as Victorian Premier last month and his replacement is keen to make a name for herself. Jacinta Allan's government has now widened the vacant land tax to include areas outside Melbourne and long-abandoned plots in the inner city. The tax now applies to residential properties which are unoccupied for more than six months a year in the hope that homeowners will either develop the land or sell to someone who will. Source: Australian Financial Review Author: Filippo Sciacca, Director - Investor Relations, Asset Management and Compliance Funds operated by this manager: ASCF High Yield Fund, ASCF Premium Capital Fund, ASCF Select Income Fund |
23 Oct 2023 - Investment Perspectives: The housing fate from interest rates
19 Oct 2023 - Australian Corporate Performance in Indigenous reconciliation.
Australian Corporate Performance in Indigenous reconciliation. Tyndall Asset Management October 2022 With the upcoming Voice referendum in Australia, the nation stands on the cusp of a significant constitutional change, emphasising the acknowledgment of Aboriginal and Torres Strait Islanders as the original inhabitants and the establishment of an Aboriginal and Torres Strait Islander Voice to Parliament. Here we aim to assess Australian corporate performance in the context of the indigenous reconciliation journey, particularly focusing on Reconciliation Action Plans and their varying stages. Reconciliation Action PlansReconciliation Action Plans (RAPs) seek to enable organisations to take meaningful action to advance reconciliation. Based around the core pillars of relationships, respect and opportunities, RAPs aim to provide tangible and substantive benefits for Aboriginal and Torres Strait Islander peoples, increase economic equity and supporting First Nations self-determination. The four stages of a RAP are as follows:
Corporate Performance and RAPsThere are presently 43 companies in the S&P/ASX 100 with RAPs in place. These companies are distributed across the Reflect, Innovate, Stretch, and Elevate stages. Notably, 57 companies in the ASX 100 do not have RAPs, suggesting that there is room for growth in corporate engagement in indigenous reconciliation. The breakdown of companies by RAP stage and their associated values in the ASX 100 is as follows:
Figure 1: S&P/ASX 100 RAP Breakdown (number) Source: IRESS, Reconciliation Australia, Tyndall AM, Oct 2023. Figure 2: S&P/ASX 100 RAP breakdown (total market cap) Source: IRESS, Reconciliation Australia, Tyndall AM, Oct 2023. Additionally, sector-wise analysis demonstrates varying levels of engagement with RAPs:
Figure 3: S&P/ASX 100 RAP breakdown by industry Source: IRESS, Reconciliation Australia, Tyndall AM, Oct 2023. Specifically relating to the Voice referendum, it is interesting to note that 14 of the top 20 listed companies in Australia have expressed public support for the Voice. Somewhat surprisingly, of these 14 companies only 11 currently have RAPs. Less surprisingly, none of those 11 companies are at the Reflect stage and the majority are at the Elevate stage or beyond - essentially companies that are more progressed in their own reconciliation journey. Figure 4: S&P/ASX 20 Voice Support Source: IRESS, Reconciliation Australia, Tyndall AM, Oct 2023. Incorporating Reconciliation into our ESG approachESG has always been a critical part of the Tyndall investment process. More recently we have added structure to the process via the development of an ESG scorecard amongst other longstanding initiatives including active ESG engagement and independent thought on ESG related matters. While social issues and diversity and inclusion performance have always been considered, we have recently updated our scorecard to specifically reflect where companies are at in their RAP journey. Conclusion Regardless of the outcome of the Voice referendum, it is clear that corporate Australia will play an increasingly significant role in progressing indigenous reconciliation efforts. This includes fostering genuine relationships, creating inclusive workplaces, and supporting initiatives that empower Aboriginal and Torres Strait Islander peoples. The pre-Voice referendum assessment of Australian corporate performance in the indigenous reconciliation journey through RAPs reveals both progress and areas for improvement. While a notable number of companies have embraced reconciliation through the RAP framework, a significant proportion is yet to make a commitment. Encouragingly, there appears a growing understanding and acknowledgment of the need to meaningfully engage with indigenous communities. Author: Michael Ward, Senior Research Analyst Funds operated by this manager: Tyndall Australian Share Concentrated Fund, Tyndall Australian Share Income Fund, Tyndall Australian Share Wholesale Fund |
18 Oct 2023 - European student accommodation: testing the theory
European student accommodation: testing the theory abrdn October 2023 As the new academic year kicks off, students in Europe are confronted with a shortage of good-quality student accommodation. Relative to the UK, the purpose-built student accommodation (PBSA) market in Europe is at a much earlier stage in its evolution. The demand for higher education in Europe is rising, driven by a steady increase in domestic and international students. In 2002, only 22.5% of adults living in the EU were educated to degree level. By 2021, that figure had risen to 40% - the European Commission's long-term target [1]. Momentum remains strong, with access to tertiary education still under the spotlight. In 2022, student enrollments increased or remained stable in 87% of European cities. Rising international student populations are further exacerbating the demand in Europe, too. With limited supply, these fundamental drivers are creating a compelling opportunity for investors to source long-term stable cashflows from the sector. Investment in European PBSA hit €15.4 billion in 2022. This was 47% higher than 2021, 37% higher than 2019 (pre-Covid levels), and 39% higher than the five-year average. Our research on more mature PBSA markets, like the UK, demonstrates how this opportunity can evolve.
Examining the provision rateIn 2022, PBSA occupancy rates averaged 98% in Europe's major cities [2], a level that far exceeds commercial real estate sectors. The demand has also been counter-cyclical to gross domestic product. When there's a downturn in the economy, the demand for student beds rises as more people either enter tertiary education or extend their studies beyond undergraduate degrees. Even during the pandemic and strict lockdowns, university admissions remained resilient and even grew in some cases. However, the provision rates tell the true story. The average provision rate (defined as the student-to-bed ratio) in Europe is 25%. This ranges from 4% in Italy to 33% in the UK. At a city level, London is 31%, Amsterdam is 29%, Copenhagen is 21% and Munich is 15% [3]. With high inflation, debt and construction costs, development activity is insufficient to absorb current and future demand from both domestic and overseas students. Even if all planned developments go ahead, the European provision rate will remain less than 15%. This leaves students at the mercy of individual landlords in the private rental market, which can mean they end up living further away from university campuses. Private accommodation is often more costly because of open-market rents, non-inclusive energy bills, travel, and extra costs for entertainment and facilities. Importantly, a lesser 'student experience' means institutions risk falling behind the current expectations of domestic and international students in an increasingly competitive environment. 'Internationalisation' in higher education'Internationalisation' is the process of integrating cross-border students into European institutions [4]. The top 10 universities in Europe are in the UK and Germany, of which international students account for between 19% and 73% (London School of Economics 73%, University of Oxford 42%, ETH Zurich 41%, and LMU Munich 19%) [5]. This proportion has grown considerably in recent years, owing to a rise in English Taught Bachelors (ETBs), which accommodate a broader range of students. The UK, Germany, the Netherlands and Italy comprise the largest population of English-taught students. International students tend to want higher standards of accommodation in bespoke premises, with higher security than domestic students. A shortage of suitable PBSA stock is a limiting factor for institutions that want to attract this important source of revenue. For investors, this type of PBSA can provide scope for specialisation, with higher premium units and longer-term lets available for overseas students. Chart: Countries accounting for highest past enrolments Source: Studyportals, abrdn, June 2023 Diversifying the student baseFor European PBSA assets, it is less common for investors to have a lease with a university or a business operator. It is more typical to have exposure to individual tenants and turnover. This is critical as the risk of higher void rates can have a more direct impact on performance in European PBSA. Schemes that are backed by a diverse range of international students tend to support more resilient cashflows. Where there is a strong dependency on one source of international student, there is a risk that the source slows or is diverted. Brexit is a good example of a structural shift that can happen almost overnight. The number of EU students coming to the UK plummeted by 50% in 2022, after Brexit-related changes meant they lost their discount on tuition fees. Non-EU international students have filled these places, but this has changed the dynamic in the UK market. In addition, student visa reforms and anti-immigration laws hinder future enrollment rates from Europe, in particular. In the UK, the highest number of international students are from China, India and the US. European student flows are more fragmented, though, driven by a shared colonial history, languages, politics and geographical relationships. In France, most students are from Africa, given the shared colonial ties; Portugal has the most Brazilian students because of their colonial and economic links; and Austria and Germany receive students from each other as they share a common language and are neighbouring countries. The chart shows the differences in student flows and the implied opportunities and risks within the international student mix. The diverse range of international students is a distinct advantage for European PBSA. With the UK government introducing stricter policies, EU institutions are an emerging alternative for international students. This trend could allow the EU to close the gap on the UK. It's not a one-way ticket, though. The Netherlands is another maturing PBSA market that is home to many top universities and international students. But it could cap international student enrollment and recruitment in the future. The tight housing market in major Dutch cities is a major political issue and there are simply not enough beds to supply all students with good-quality accommodation. It's all about distinctionGiven the demand and supply fundamentals, we believe there will be strong potential opportunities for investors to grow meaningful allocations in good-quality and well-located European PBSA. The deglobalisation trend that has been fuelled by geopolitics, means investors cannot simply 'wing it' when it comes to European PBSA. It is important to focus on the best university towns and cities, backed by the most diverse range of student flows, and a strong and growing domestic student population.
Author: Hong Bui, Real Estate Investment Analyst, Europe, abrdn |
Funds operated by this manager: Aberdeen Standard Actively Hedged International Equities Fund, Aberdeen Standard Asian Opportunities Fund, Aberdeen Standard Australian Small Companies Fund, Aberdeen Standard Emerging Opportunities Fund, Aberdeen Standard Ex-20 Australian Equities Fund (Class A), Aberdeen Standard Focused Sustainable Australian Equity Fund, Aberdeen Standard Fully Hedged International Equities Fund, Aberdeen Standard Global Absolute Return Strategies Fund, Aberdeen Standard Global Corporate Bond Fund, Aberdeen Standard International Equity Fund, Aberdeen Standard Multi Asset Real Return Fund, Aberdeen Standard Multi-Asset Income Fund |
17 Oct 2023 - Glenmore Asset Management - Market Commentary
Market Commentary - September Glenmore Asset Management October 2023 Globally equity markets in September declined materially driven by rising bond yields. In the US, the S&P 500 fell -4.9%, whilst the Nasdaq declined -5.8%. In the UK, the FTSE 100 outperformed, rising +2.3%, due to its heavy resources and lower technology weightings. In Australia, the All-Ordinaries Accumulation Index fell -2.8%. Energy was the best performing sector (brent crude oil rose +9.8%), whilst real estate and technology were the worst performing sectors, both impacted by rising bond yields. Small caps underperformed as investor risk appetite weakened, with the ASX Small Ords Accumulation Index falling -4.0%. In bond markets, the US 10-year bond yield climbed +43bp to close at 4.54%. Its Australian counterpart saw the yield increase +46bp to 4.49%. The increase in bond yields was the main story for financial markets in the month and was driven by expectations that high inflation will be more persistent and hence require more rate hikes from central banks over the next 6-12 months. The Australian dollar was flat, closing at US$0.64. Funds operated by this manager: |
16 Oct 2023 - 10k Words | October 2023
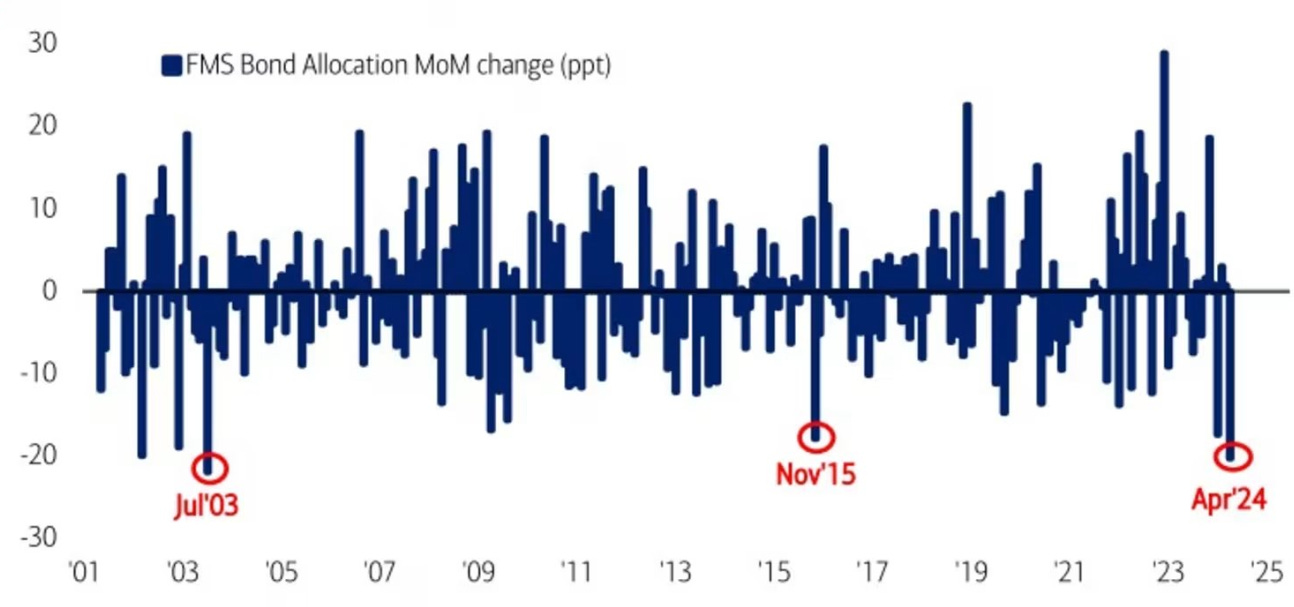
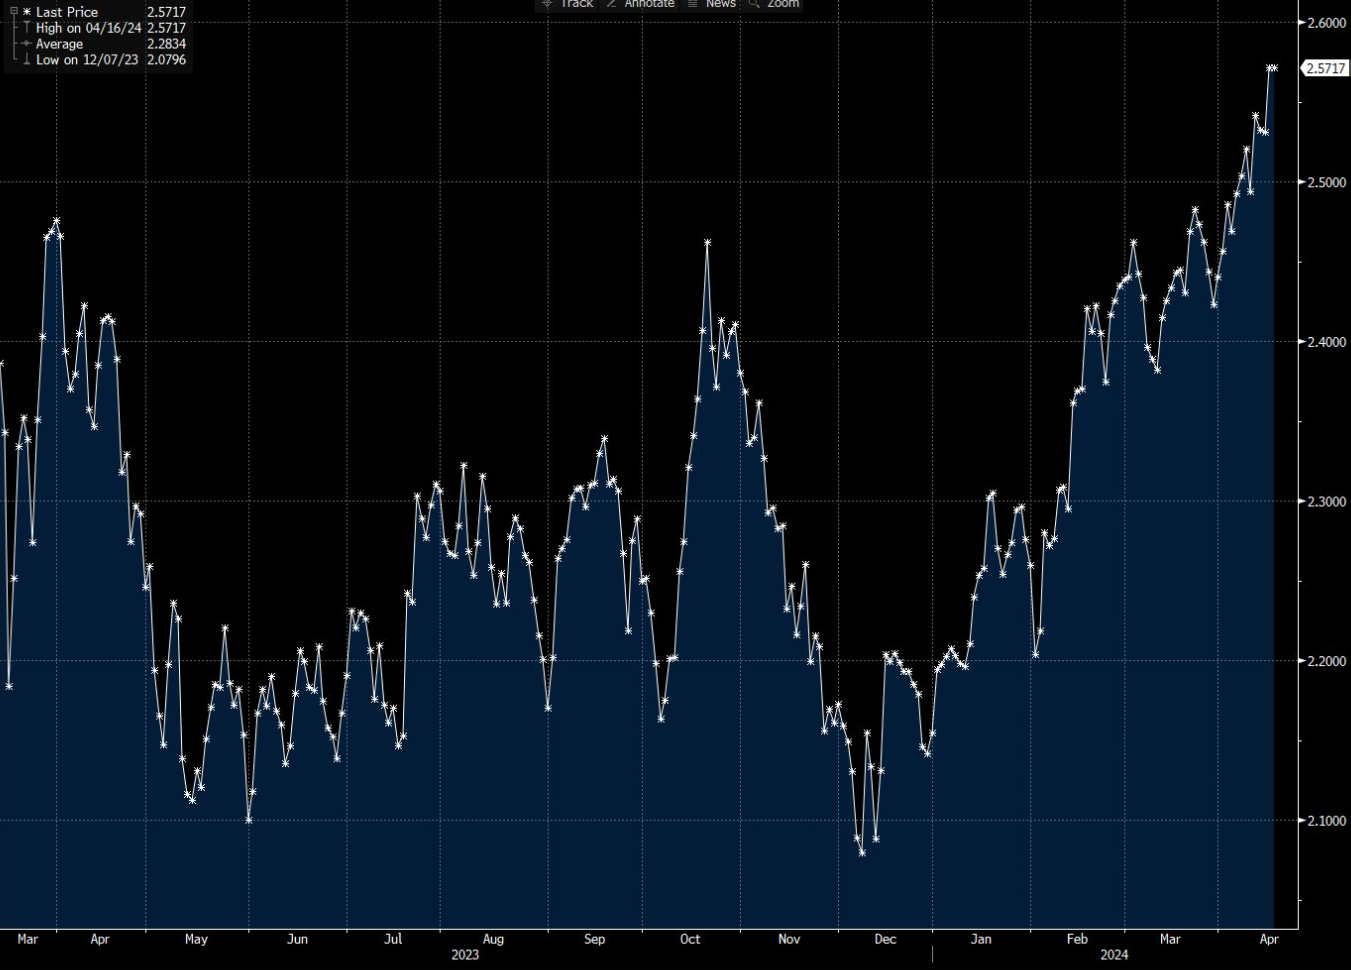
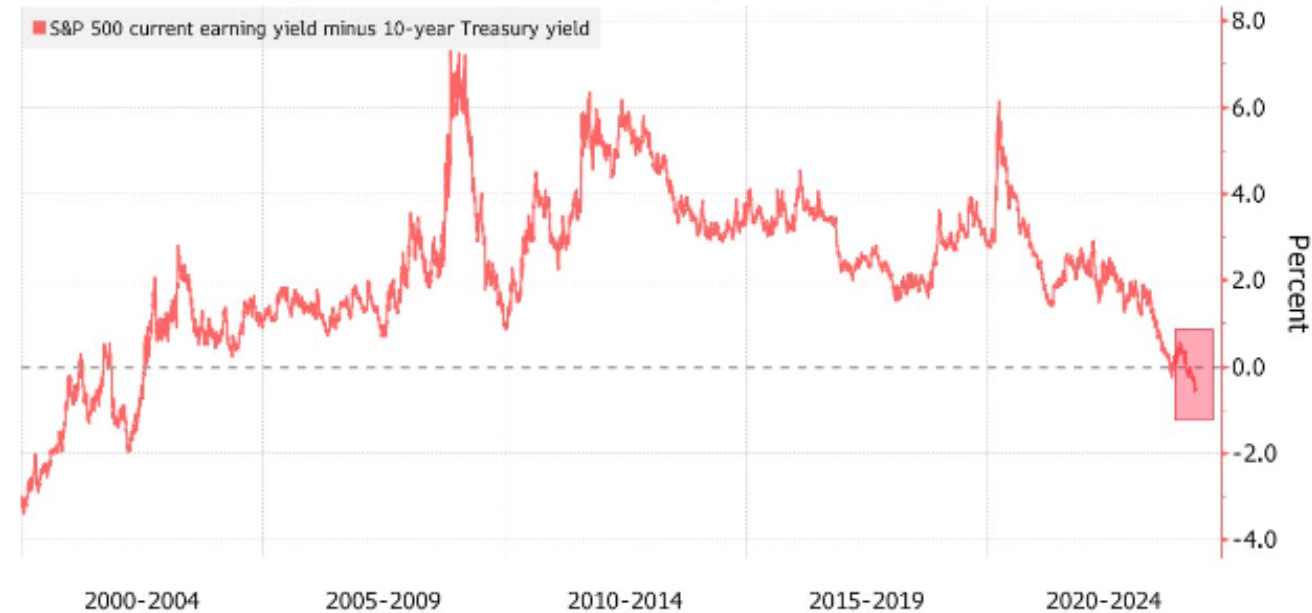
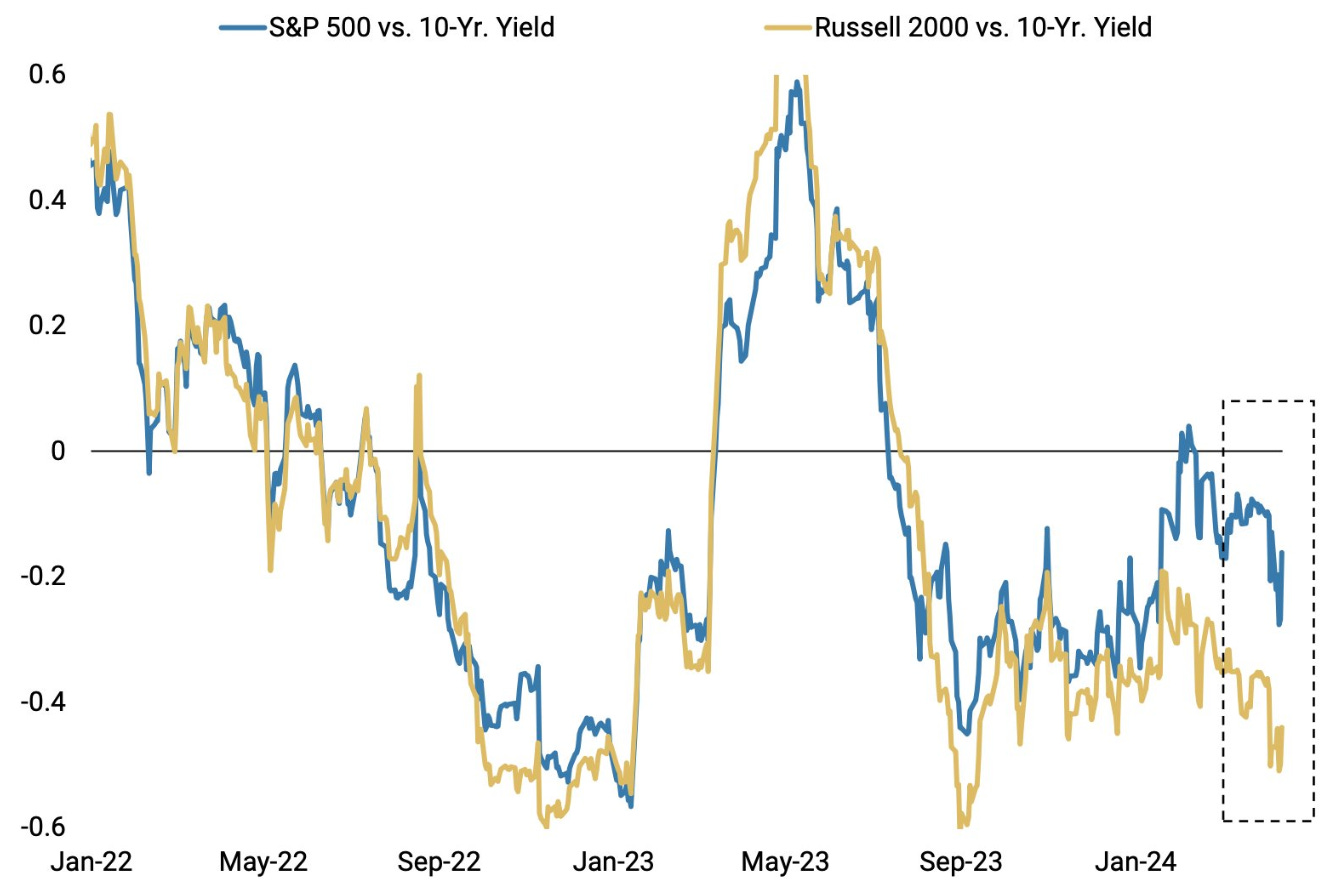
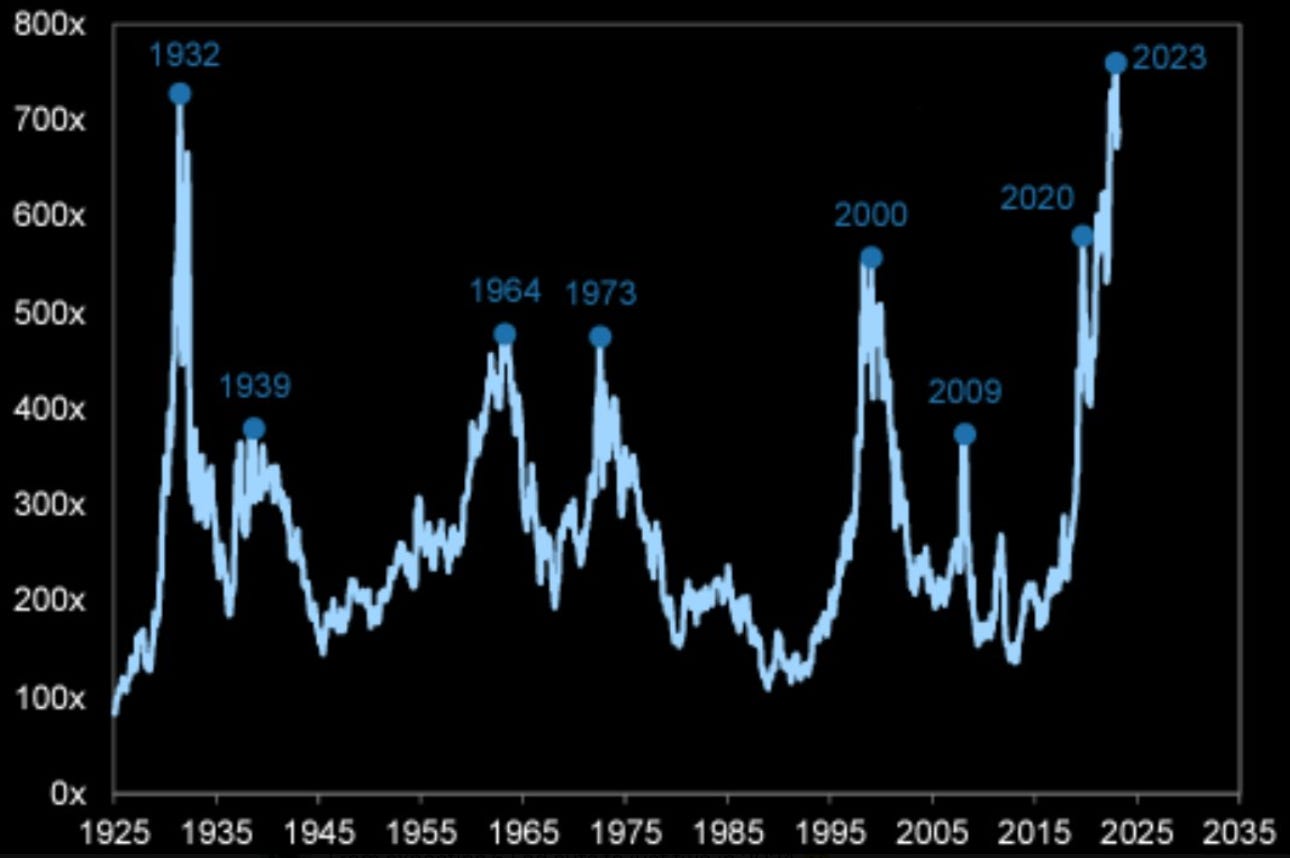
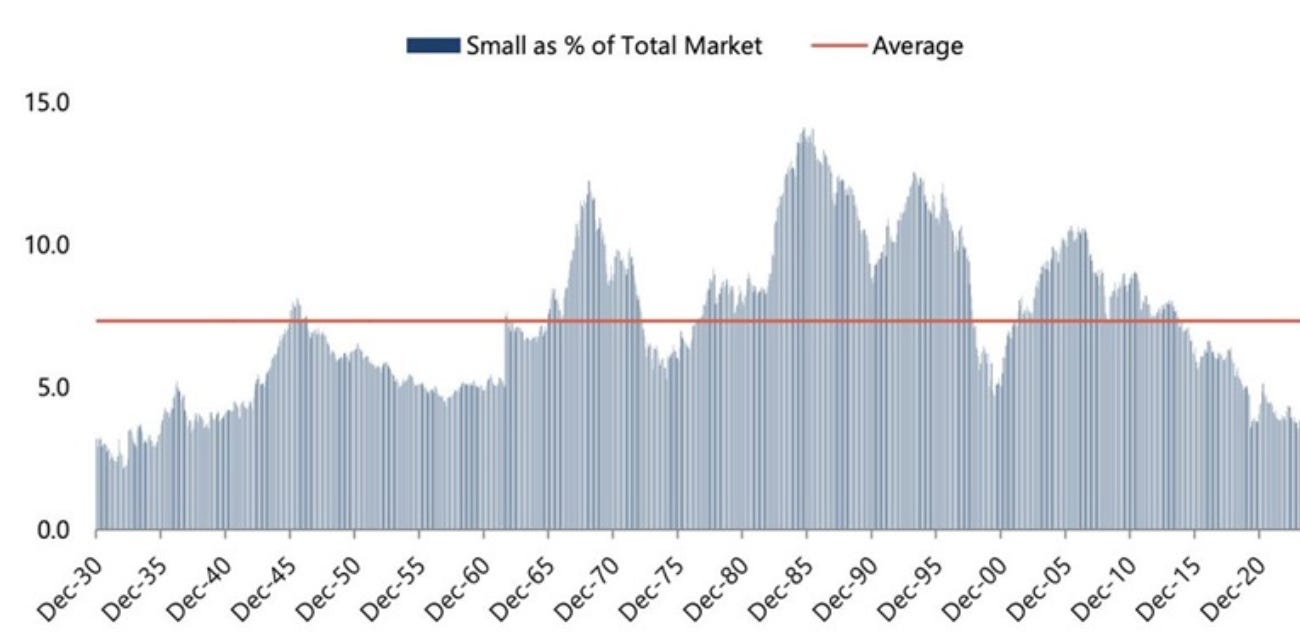
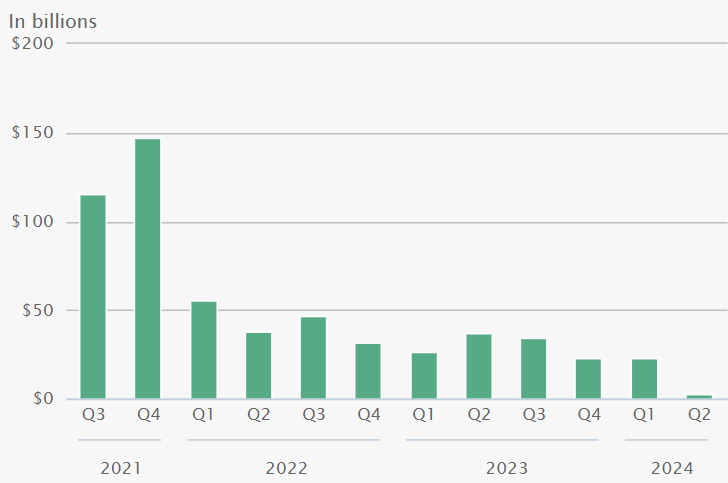
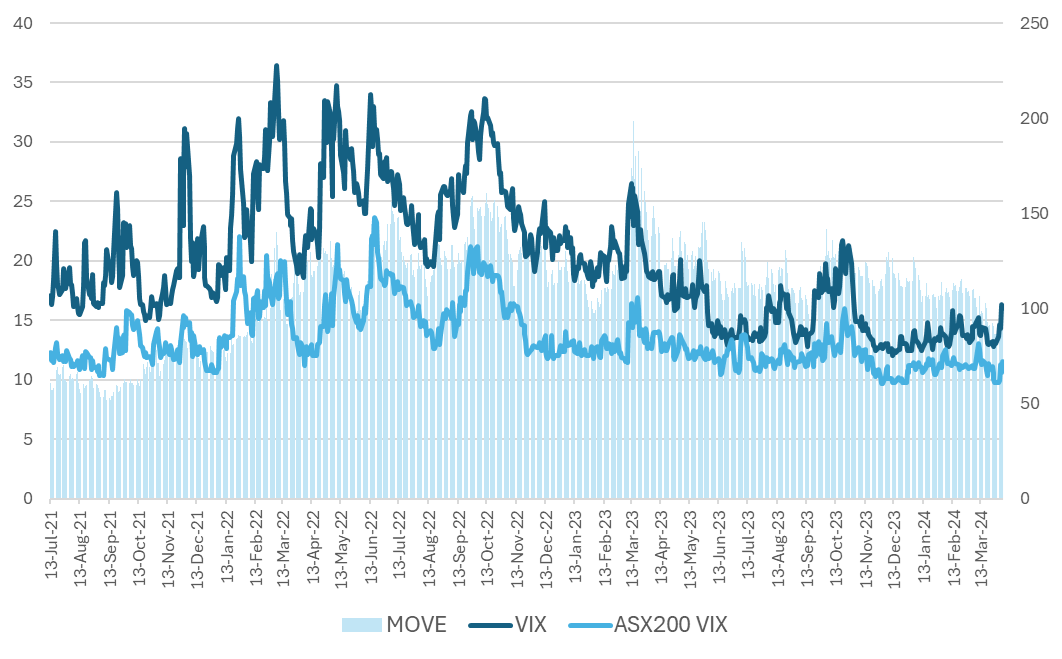
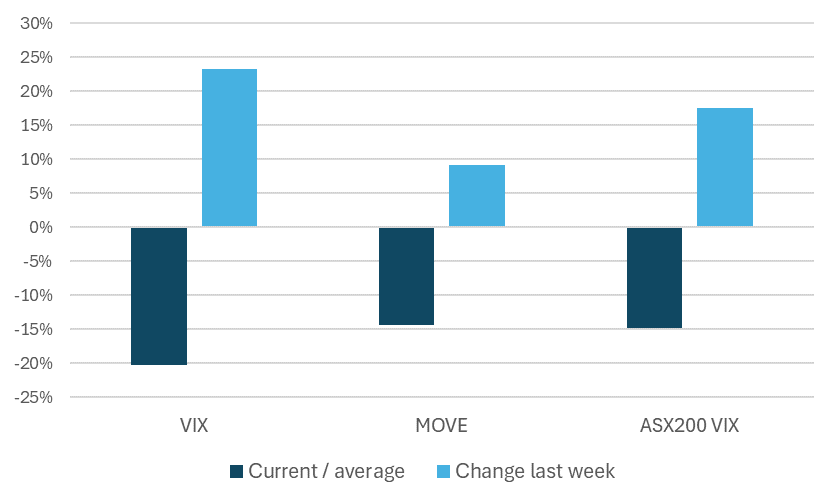
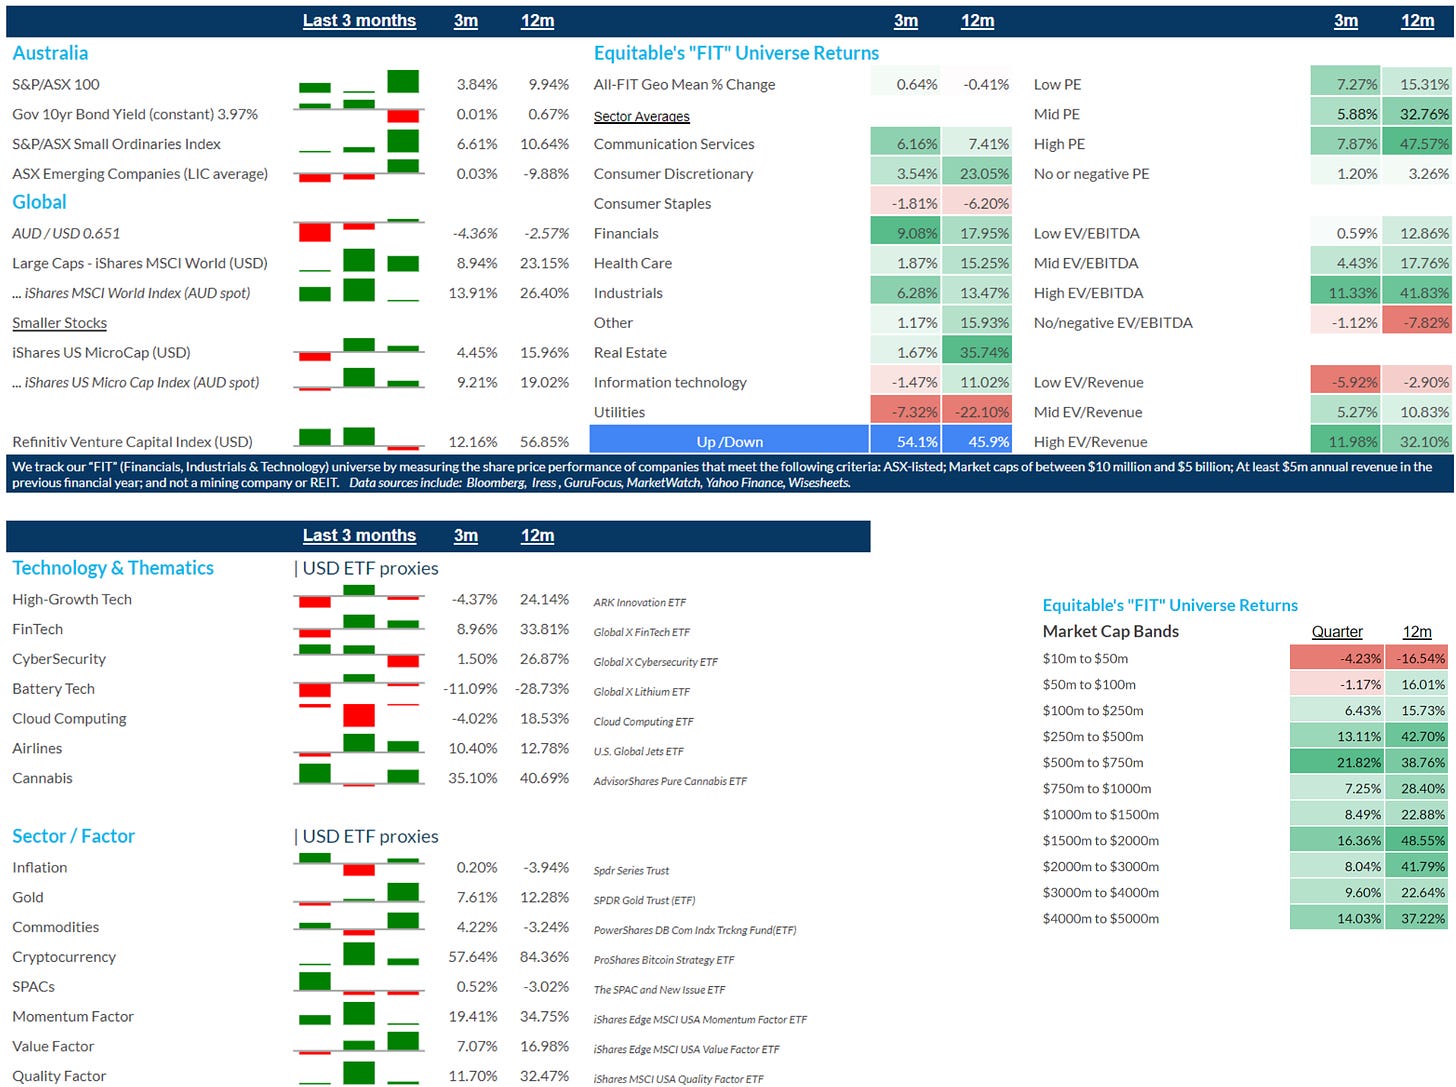
10k Words Equitable Investors October 2023 "Small caps have gone through scotched earth in the US & here," Bell Potter highlights, with JP Morgan showing small caps to be the most volatile and lowest returning asset in the past ten years. JP Morgan also shows us inflation still running above trend in developed markets, leading to a "relentless" rise in bond yields according to SentimenTrader - the flipside of which is a massive equity-like drawdown in bonds charted by @leadlagreport. Mortgage repayments, @cullenroche notes, have rocketed up. But P/E multiples haven't really responded to the shift in rates yet - Endeavour Equities charts the gap between the Nasdaq's P/E and real yields - then points out that in 1987 a P/E derating lagged higher real yields. Factset has the S&P 500's forward P/E at 17.7x, just above the 10 year average of 17.5x (calculated over a period of lower interest rates). Equitable Investors looked at Australia's 10-year government bond hitting a high not seen since 2011 as the spread between the bond yield and the ASX 200 dividend yield turned negative. We also looked at the spread between corporate "high yield" debt and the earnings yield in the US. That's as credit ratings agency Fitch sees corproate interest coverage declining "modestly" as rates stay higher for longer. Finally, Morningstar charts how Australian consumers are spending more of their income and saving less. Weighted harmonic average P/E (excluding non-earners) for the Russell 2000 Source: Bell Potter World equity market returns Source: JP Morgan Asset Management Headline consumer prices year-over-year, quarterly data Source: JP Morgan Asset Management US bond yields rise as news articles label the move "relentless" Source: SentimenTrader, Bloomberg 2020-2023 - 20+ year US treasury drawdown compared to largest stock Source: @leadlagreport Monthly mortgage payment using median existing home pirce in US with a 20% down payment & average 30Y mortgage rate Source: @cullenroche, Bloomberg Nasdaq P/E v inverse of the real yield on 10 year inflation-protected treasuries Source: @EquitOrr / Endeavour Equities In 1987 P/Es derated as a delayed reaction to higher real yields Source: @EquitOrr / Endeavour Equities S&P 500 forward 12 month P/E ratio - 10 years Source: FactSet Australian government 10-year bond yield Source: Iress, Equitable Investors Spread between S&P/ASX 200 dividend yield & 10 year bond yield Source: Iress, Equitable Investors Spread between US BBB corporate bonds and the S&P 500 earnings yield Source: GuruFocus, Equitable Investors US "high yield" corporate bond default rates rising Source: S&P Change in Fitch's forecast for 2023 inveterst coverage (EBITDA / interest) Source: Fitch Real household incomes declining and saving rates low
Source: Morningstar, ABS October Edition Funds operated by this manager: Equitable Investors Dragonfly Fund Disclaimer Nothing in this blog constitutes investment advice - or advice in any other field. Neither the information, commentary or any opinion contained in this blog constitutes a solicitation or offer by Equitable Investors Pty Ltd (Equitable Investors) or its affiliates to buy or sell any securities or other financial instruments. Nor shall any such security be offered or sold to any person in any jurisdiction in which such offer, solicitation, purchase, or sale would be unlawful under the securities laws of such jurisdiction. The content of this blog should not be relied upon in making investment decisions. Any decisions based on information contained on this blog are the sole responsibility of the visitor. In exchange for using this blog, the visitor agree to indemnify Equitable Investors and hold Equitable Investors, its officers, directors, employees, affiliates, agents, licensors and suppliers harmless against any and all claims, losses, liability, costs and expenses (including but not limited to legal fees) arising from your use of this blog, from your violation of these Terms or from any decisions that the visitor makes based on such information. This blog is for information purposes only and is not intended to be relied upon as a forecast, research or investment advice. The information on this blog does not constitute a recommendation, offer or solicitation to buy or sell any securities or to adopt any investment strategy. Although this material is based upon information that Equitable Investors considers reliable and endeavours to keep current, Equitable Investors does not assure that this material is accurate, current or complete, and it should not be relied upon as such. Any opinions expressed on this blog may change as subsequent conditions vary. Equitable Investors does not warrant, either expressly or implied, the accuracy or completeness of the information, text, graphics, links or other items contained on this blog and does not warrant that the functions contained in this blog will be uninterrupted or error-free, that defects will be corrected, or that the blog will be free of viruses or other harmful components. Equitable Investors expressly disclaims all liability for errors and omissions in the materials on this blog and for the use or interpretation by others of information contained on the blog |
12 Oct 2023 - Ferrari: The case for RACE (RACE IM)
Ferrari: The case for RACE (RACE IM) Alphinity Investment Management September 2023 Ferrari is one of the world's most iconic brands. It's also an amazing stock. Ferrari was founded in Italy in the 1940s and was spun off from Stellantis in 2016 under the ticker RACE IM.
The IPO price was EUR43 and Ferrari is currently trading at ~EUR300 for a 600% return since listing. The analysis below outlines the Case for RACE and highlights 4 main reasons to why we love the stock. RACE Stock Price Since Listing in 2016
Reason #1: High margin, high return, high growth business
Point #2: A+ industry structure leads to earnings visibility and upgrades From this perspective, Ferrari is literally the textbook case of an A+ company. They are a heritage brand with incredibly high barriers to entry, they have few competitors, few substitutes, price insensitive customers with very little bargaining power, and a supply chain that is localised and very difficult to replicate. The net result is that Ferrari has an immense level of control over its own earnings and strong earnings visibility. Management upgraded its FY23 revenue guidance, adjusted EBIT margin guidance as well as adjusted EPS and FCF estimates at the last result. More importantly, this upgrade cycle is a consistent pattern shown by RACE management since listing.
Reason #3: Impressive Brand Recognition and Unique Positioning Among Auto Peers Ferrari is refreshingly contrarian on both these fronts. Ferrari management has made a strong commitment NOT to get into autonomous driving (AD). The whole point of buying a Ferrari is to drive it yourself! While Ferrari is a leader in hybrids with approximately 45% of deliveries already in the hybrid space, it's first fully electric car will not be presented until 2025 with the first deliveries the following year. They do not expect pure EVs to be more than 5% of total shipments by 2026. Part of this is strategic positioning that one of the great joys (so I am told) of owning a Ferrari is the vrooooom, sound it makes when you start the ICE engine. EVs don't vroom so Ferrari plans to continue to develop ICE engines into the 2030s. Reason #4: Technological leader Investment Risks Conclusion |
Funds operated by this manager: Alphinity Australian Share Fund, Alphinity Concentrated Australian Share Fund, Alphinity Global Equity Fund, Alphinity Sustainable Share Fund Disclaimer |
11 Oct 2023 - Who will benefit from the energy transition?
Who will benefit from the energy transition? Magellan Asset Management September 2023 |
Net Zero is not a new ambition for governments and companies, with some sectors like utilities focused on this climate risk for quite some time now. David Costello, CFA, Portfolio Manager - Energy Transition Strategy discusses the opportunities we see from the energy transition and companies that may benefit from this transition. |
Funds operated by this manager: Magellan Global Fund (Hedged), Magellan Global Fund (Open Class Units) ASX:MGOC, Magellan High Conviction Fund, Magellan Infrastructure Fund, Magellan Infrastructure Fund (Unhedged), MFG Core Infrastructure Fund Important Information: This material has been delivered to you by Magellan Asset Management Limited ABN 31 120 593 946 AFS Licence No. 304 301 ('Magellan') and has been prepared for general information purposes only and must not be construed as investment advice or as an investment recommendation. This material does not take into account your investment objectives, financial situation or particular needs. This material does not constitute an offer or inducement to engage in an investment activity nor does it form part of any offer documentation, offer or invitation to purchase, sell or subscribe for interests in any type of investment product or service. You should obtain and consider the relevant Product Disclosure Statement ('PDS') and Target Market Determination ('TMD') and consider obtaining professional investment advice tailored to your specific circumstances before making a decision about whether to acquire, or continue to hold, the relevant financial product. A copy of the relevant PDS and TMD relating to a Magellan financial product may be obtained by calling +61 2 9235 4888 or by visiting www.magellangroup.com.au. Past performance is not necessarily indicative of future results and no person guarantees the future performance of any financial product or service, the amount or timing of any return from it, that asset allocations will be met, that it will be able to implement its investment strategy or that its investment objectives will be achieved. This material may contain 'forward-looking statements'. Actual events or results or the actual performance of a Magellan financial product or service may differ materially from those reflected or contemplated in such forward-looking statements. This material may include data, research and other information from third party sources. Magellan makes no guarantee that such information is accurate, complete or timely and does not provide any warranties regarding results obtained from its use. This information is subject to change at any time and no person has any responsibility to update any of the information provided in this material. Statements contained in this material that are not historical facts are based on current expectations, estimates, projections, opinions and beliefs of Magellan. Such statements involve known and unknown risks, uncertainties and other factors, and undue reliance should not be placed thereon. No representation or warranty is made with respect to the accuracy or completeness of any of the information contained in this material. Magellan will not be responsible or liable for any losses arising from your use or reliance upon any part of the information contained in this material. Any third party trademarks contained herein are the property of their respective owners and Magellan claims no ownership in, nor any affiliation with, such trademarks. Any third party trademarks that appear in this material are used for information purposes and only to identify the company names or brands of their respective owners. No affiliation, sponsorship or endorsement should be inferred from the use of these trademarks. This material and the information contained within it may not be reproduced, or disclosed, in whole or in part, without the prior written consent of Magellan. |