News

4 Jun 2024 - Innovations shaping the global healthcare universe
|
Innovations shaping the global healthcare universe Magellan Asset Management May 2024 |
|
The healthcare sector is in a state of constant evolution, and with the COVID-19 pandemic behind us and an upcoming US election, what impacts could we see in the sector? Investment Analyst, Wilson Nghe sheds light on the dynamics that could play out from the US elections, how the healthcare system has transformed since the pandemic and highlights the opportunities and challenges that investors need to watch out for. |
|
Funds operated by this manager: Magellan Global Fund (Hedged), Magellan Global Fund (Open Class Units) ASX:MGOC, Magellan High Conviction Fund, Magellan Infrastructure Fund, Magellan Infrastructure Fund (Unhedged), MFG Core Infrastructure Fund, Magellan Core ESG Fund Important Information: This material has been delivered to you by Magellan Asset Management Limited ABN 31 120 593 946 AFS Licence No. 304 301 ('Magellan') and has been prepared for general information purposes only and must not be construed as investment advice or as an investment recommendation. This material does not take into account your investment objectives, financial situation or particular needs. This material does not constitute an offer or inducement to engage in an investment activity nor does it form part of any offer documentation, offer or invitation to purchase, sell or subscribe for interests in any type of investment product or service. You should obtain and consider the relevant Product Disclosure Statement ('PDS') and Target Market Determination ('TMD') and consider obtaining professional investment advice tailored to your specific circumstances before making a decision about whether to acquire, or continue to hold, the relevant financial product. A copy of the relevant PDS and TMD relating to a Magellan financial product may be obtained by calling +61 2 9235 4888 or by visiting www.magellangroup.com.au. Past performance is not necessarily indicative of future results and no person guarantees the future performance of any financial product or service, the amount or timing of any return from it, that asset allocations will be met, that it will be able to implement its investment strategy or that its investment objectives will be achieved. This material may contain 'forward-looking statements'. Actual events or results or the actual performance of a Magellan financial product or service may differ materially from those reflected or contemplated in such forward-looking statements. This material may include data, research and other information from third party sources. Magellan makes no guarantee that such information is accurate, complete or timely and does not provide any warranties regarding results obtained from its use. This information is subject to change at any time and no person has any responsibility to update any of the information provided in this material. Statements contained in this material that are not historical facts are based on current expectations, estimates, projections, opinions and beliefs of Magellan. Such statements involve known and unknown risks, uncertainties and other factors, and undue reliance should not be placed thereon. No representation or warranty is made with respect to the accuracy or completeness of any of the information contained in this material. Magellan will not be responsible or liable for any losses arising from your use or reliance upon any part of the information contained in this material. Any third party trademarks contained herein are the property of their respective owners and Magellan claims no ownership in, nor any affiliation with, such trademarks. Any third party trademarks that appear in this material are used for information purposes and only to identify the company names or brands of their respective owners. No affiliation, sponsorship or endorsement should be inferred from the use of these trademarks. This material and the information contained within it may not be reproduced, or disclosed, in whole or in part, without the prior written consent of Magellan. |

4 Jun 2024 - Australian Secure Capital Fund - Market Update
|
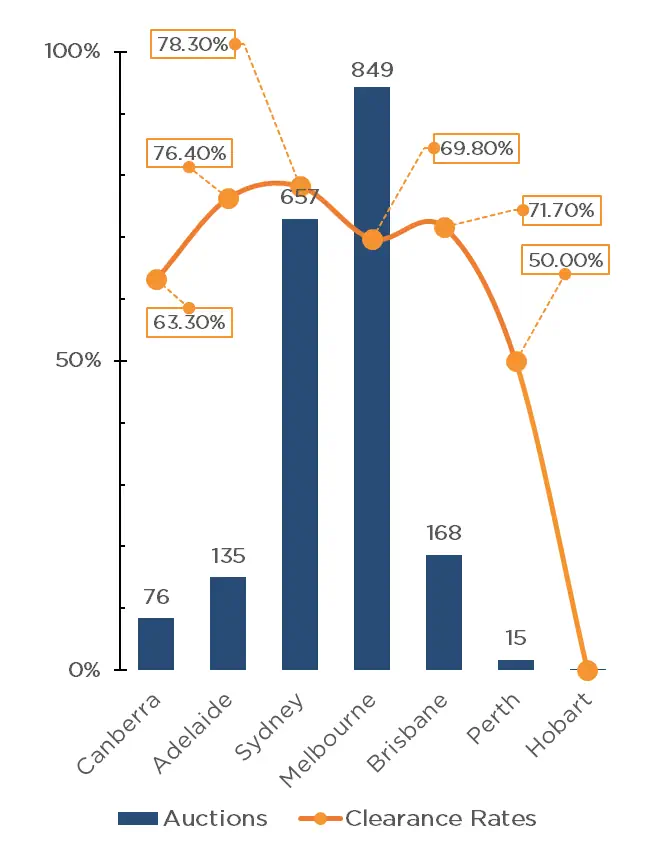
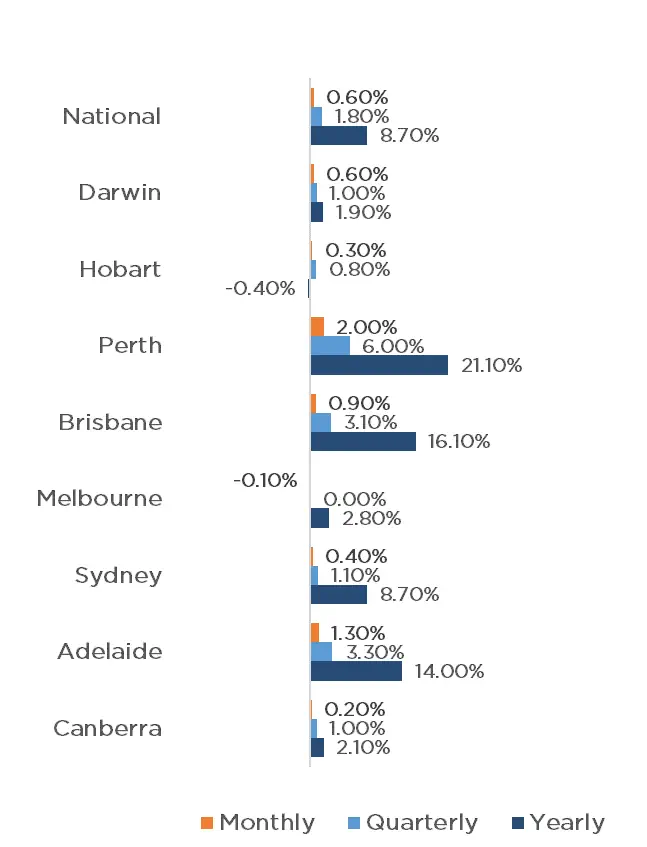
Australian Secure Capital Fund - Market Update Australian Secure Capital Fund May 2024 National property values continue to perform strongly, with CoreLogic's National Home Value Index recording another 0.6% increase in April, the same which was achieved in February and March, resulting in 15 months of continuous monthly growth. Yet again, Perth performed the strongest, increasing by a whopping 2.0% for the month, with Adelaide and Brisbane again achieving the second and third largest growth with 1.3% and 0.9% respectively. Darwin, Sydney, Hobart and Canberra also experienced growth with 0.6%, 0.4%, 0.3% and 0.2% respectively, whilst Melbourne recorded a slight reduction of 0.1%. This raised the quarterly national growth rate to 1.8%, with combined capitals increasing by 1.7% and the combined regions by 2.1%. The RBA meeting on the 7th of May indicated that we may experience higher interest rates for longer than anticipated, and has not ruled out a further increase in rates, however inflation is beginning to fall, albeit at a slightly slower pace than forecasted. However, with the fundamental undersupply of property, we anticipate the property market to remain strong throughout 2024. Clearance Rates & Auctions week of 29th of April 2024
Property Values as at 1st of May 2024
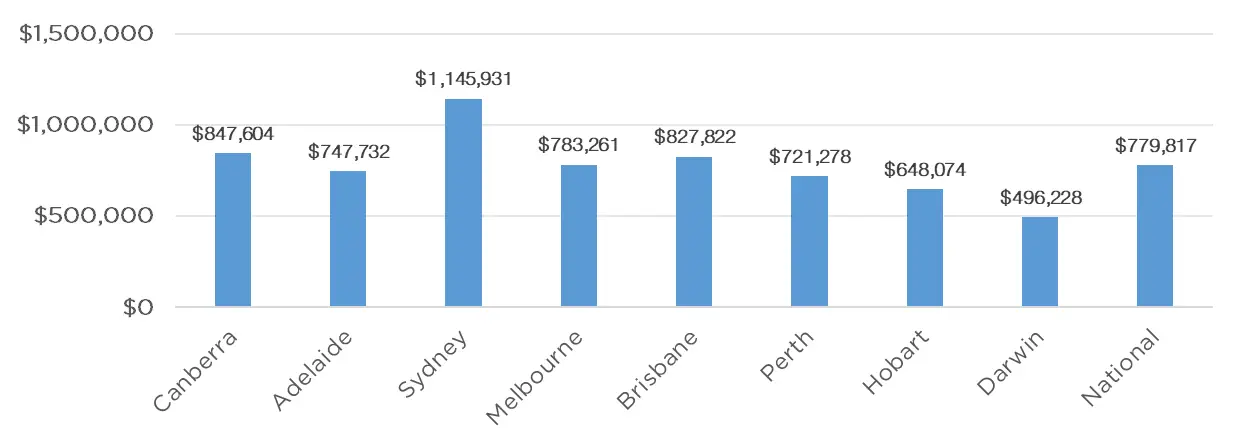
Median Dwelling Values as at 1st of May 2024
Quick InsightsThe Foreign Housing FightIn his budget reply speech, Mr Dutton said he would put a two-year ban on foreign investors and temporary residents purchasing homes in Australia if the Opposition won the next federal election. Ms Tu of "luxury property concierge" firm Black Diamondz, said that, contrary to the perception that foreign buyers were taking housing away from Australians, they injected money into the economy which has helped fund infrastructure and commercial development. We expect this debate to continue until the next election. Source: Australian Financial Review Australia's Race to LoseThere is no doubt that red tape at all levels of government continues to exacerbate the housing shortfall in Australia, with other comparable countries doing a far better job. Victoria and NSW are experiencing the longest average development approval wait times at 144 and 114 days respectively, according to new research by the federal Treasury. Source: Australian Financial Review Author: Filippo Sciacca, Director - Investor Relations, Asset Management and Compliance Funds operated by this manager: ASCF High Yield Fund, ASCF Premium Capital Fund, ASCF Select Income Fund |

3 Jun 2024 - Manager Insights | Skerryvore Asset Management
|
Chris Gosselin, CEO of FundMonitors.com, speaks with Glen Finegan, Lead Portfolio Manager at Skerryvore Asset Management. In this wide ranging interview Glen explains the fund's Emerging Market strategy, and what drives a company's selection in the portfolio.
|

30 May 2024 - The Great Reversals

29 May 2024 - Opportunities emerging from rising demand for AI computing power
|
Opportunities emerging from rising demand for AI computing power Alphinity Investment Management May 2024 |
|
The AI boom is likely to drive a surge in energy consumption after decades of sluggish demand. Powering energy-hungry data centres has become a significant bottleneck within the AI capex cycle. We take a closer look at the implications for global energy and gas markets, but also highlight various potential beneficiaries across different industries.
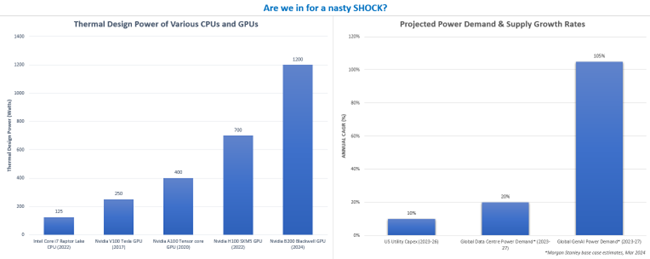
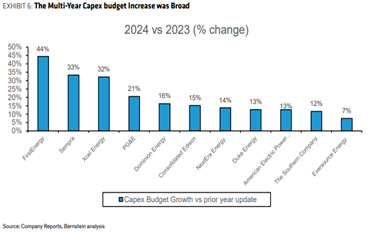
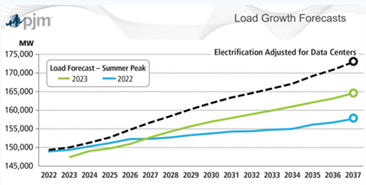
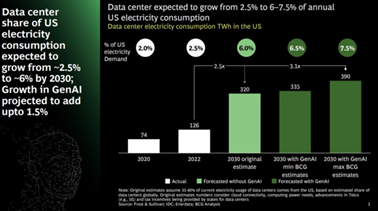
Source: Intel, Nvidia, Morgan Stanley, Company Reports, Alphinity How much energy do data centres consume today and may consume in the future?Generative AI and large language models have sparked strong rallies in some stocks, particularly those directly exposed to data centres. These centres, vital for AI processing, are reigniting electricity demand, challenging the adequacy of power supplies and infrastructure. The energy demand from data centres, already high, is predicted to grow, prompting significant investments in energy infrastructure, including natural gas and power distribution systems. Currently, data centres consume about 2.5% of global electricity, a figure Boston Consulting Group expect to rise to 4% by 2027 and as high as 7.5% by 2030, increasing the U.S. electricity demand at twice the rate of the previous decade. If correct, that will be equivalent to powering ~20% of all homes in the US. This surge underscores the urgent need for expanded power generation to prevent potential blackouts and is driving a meaningful uplift in capital expenditures by utility companies. With the U.S. leading the global data centre market, approximately 40% of global capacity, this trend is likely to be mirrored worldwide, affecting energy consumption and infrastructure development on an international scale.
Did you know?
Estimating how this increased demand translates into actual electricity demandBottom-up analysis: GenAI to add 1% of incremental electricity demand growth per annumPower consumption in data centres is calculated by adding server and storage power use, multiplied by power usage effectiveness (PUE) and operating hours. By estimating GPU growth, chip utilization and power efficiency, one can project potential power needs. AI racks can need up to five times more power than traditional ones. AI data centres using GPU clusters, consume 30-100kW per rack. Taking this fact further, mature LLMs such as ChatGPT in inference mode, consume 400-1300 kWh daily, requiring significantly more power as user queries escalate post-training.
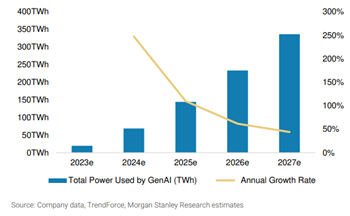
Source: Boston Consulting Group Assuming total GPU volumes rise from ~1.8m in 2023 to ~4m in 2026, custom silicon & GPU utilization rates range between 70-90% and data centre PUEs (a measure of a data centres energy efficiency) decline from 1.5 to 1.3, Morgan Stanley predicts incremental global data centre power usage will rise to 326-460 TWh by 2027, a significant increase from the current 360 TWh, with GenAI contributing about one-third of this demand. Schneider Electric estimates AI will account for a slightly lower 15-20% of the growth. This equates to a 105% compound annual growth rate for GenAI and 20% for overall data centre power, making GenAI's 2027 power demand comparable to Spain's and adding 1ppt of growth to overall electricity demand growth rates.
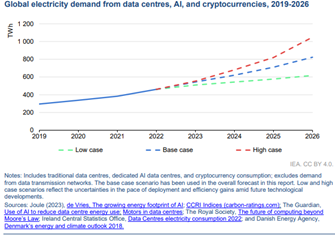
Top-down analysis: AI energy demands to double in 3yrsThe number of data centres are increasing rapidly, exemplified by Microsoft's plan to build up to one new data centre every three days, at the same time as the power intensity increases significantly. As such, BCG predicts U.S. data centre capacity will rise from 2.5% to up to 7.5% of total energy demand by 2030, increasing electricity demand by 260 TWh. McKinsey comes up with similar estimates, foreseeing power needs for U.S. data centres to double from 17GW to 35GW, equivalent to the current combined global capacity of the big 5 tech giants. Globally, institutions like the IEA foresee data centre, AI, and cryptocurrency electricity consumption doubling in the next three years to 1000 TWh, matching Japan's total power use. This surge suggests electricity demand growth could shift from stagnant for the past two decades, to 0.5-2% annually by 2030, raising questions about future supply sources. What source of energy is most likely to meet this demand?Owners of data centres, most of whom have committed to net-zero targets, face a dilemma with surging electricity needs. Renewable energy sources offer intermittent supply with 25-40% capacity factors and when paired with energy storage, higher costs. With the rapid growth in AI demand necessitating immediate and reliable power, gas generation emerges as a logical short-term solution, providing consistent electricity around the clock. Renewables will still grow in importance, especially as the cost of energy storage falls. Nuclear energy & small modular reactors are potential alternatives (see Amazon's DC acquisition), but challenged due to the long lead times to deploy and cost challenges. Recent discussions among CEOs and experts highlight the shifting demand landscape and gas's role in meeting these urgent energy needs.
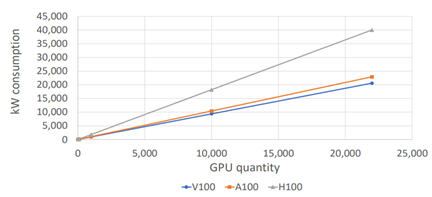
This could drive an incremental 1% to 1.7% pa of unexpected demand for natural gasBernstein projects that with ~25% of the U.S. incremental demand met by gas-fired generation, an additional ~230 TWh would necessitate ~15GW new gas capacity, increasing gas demand by ~1.1 bcf/d or 1% of the total market. Under Morgan Stanley's scenario--70% renewables and 30% fossil fuels with 70% server utilization--gas demand would rise by ~13GW over 5 years. Jefferies, accounting for upcoming renewable installations and existing energy plans, forecasts an annual increase of 1.6-1.8 bcf/d in gas demand. Consequently, AI could boost U.S. gas demand by 1-1.7% annually in the late 2020s, potentially significant against an already planned 10 Bcf/d of incremental LNG exports (or ~1%). Additionally, this growth in data centre energy use could induce market volatility and regional imbalances. You are already seeing examples of crypto miners building server farms in the Permian where they can take advantage of cheap associate gas. Companies that can take advantage of the volatility through globally balanced gas portfolios and/or large trading capabilities will likely benefit. Addressing one key assumption - advancements in chip power efficiency gainsThis analysis contains multiple complex variables, such as diminishing chip power efficiency, the shifting power requirements as AI models transition from training to inference, and regulatory influences on renewable energy development and new gas infrastructure permitting. A critical factor in this context is compute intensity. Notably, while advancements in chip technology, exemplified by Nvidia's B200 Blackwell, yield substantial efficiency improvements per compute unit, the absolute power consumption continues to escalate, with the Blackwell chip (announced a fortnight ago) experiencing a 43% increase in maximum theoretical load compared to its predecessor, the H100.
Source: Schneider Electric White Paper: Challenges and Guidance for Data Centre Design ConclusionThe tech sector's rapid evolution often outpaces slower-moving industries and governments, potentially causing bottlenecks. While technological advancements may offer some relief, they may not suffice to meet the surging demand for power. Consequently, this growing need is expected to spark a renewed interest in gas-fired generation. Companies such as ConocoPhillips are well positioned to benefit from fulfilling this demand and capitalizing on the ensuing market volatility. Additionally, Alphinity has significant positions in the technology companies that are crucial to the rapid growth of AI, as well as exposure to the "picks and shovels" companies further up the value chain. These businesses are actively addressing emerging challenges, including managing heat generation, enhancing, and securing the electrical grid, and overcoming the scarcity of strategically located land. These include technology companies like Nvidia, Cadence Designs, Alphabet and Microsoft, alongside companies such as Trane Technologies, who are the leaders in data centre cooling solutions. Prologis, who are spending ~US$7-8bn over the next 5yrs to build 20 new DCs. ASML who manufacture advanced AI chip equipment, and Ferguson who supply infrastructure essentials such as pipes and fire suppression for DCs. Furthermore, our sustainable strategy owns Schneider Electric with 20% of sales to DCs and Quanta, the top U.S. grid EPC. Author: Chris Willcocks, Portfolio Manager |
|
Funds operated by this manager: Alphinity Australian Share Fund, Alphinity Concentrated Australian Share Fund, Alphinity Global Equity Fund, Alphinity Global Sustainable Equity Fund, Alphinity Sustainable Share Fund |

28 May 2024 - Trip Insights: Asia

24 May 2024 - Tax Loss Selling
|
Tax Loss Selling Marcus Today May 2024 |
|
We are approaching June, and it's a good time to start talking about tax loss selling in stocks. It is something that we should all think about in May rather than June. It works like this:Assuming you pay capital gains tax - many of you don't - on June 30th the tax man will freeze your portfolio, add up all the capital gains you've made this year, all the capital losses, offset the losses against the gains, and come after you for CGT on any net profit.If your accountant hasn't reminded you, then this is a reminder that you can minimise ('defer' really) your capital gains tax (CGT) liability this year by realising some losses as well as gains before the year-end, rather than just holding on. Basically, if you have a net capital gain from stocks sold, or any other capital gain, you should now be looking through your collection of current holdings for any stocks with losses attached (that you could sell now), and in so doing crystallise a loss that can be used to offset any gains made during the year. In so doing you can minimise your need to pay tax this year. Ultimately, it is not about how much tax you pay, that will not change. It is about when you pay it. It's obvious stuff.
Capital losses can offset capital gains.
But of more interest to investors than the tax situation, and what you may not know, is that this process of tax loss selling impacts share prices. In particular:
If you do want to take a loss before the end of June but want to continue holding the stock long-term, it is a good idea to take the loss early (now for instance), and not buy it back immediately, but wait until the other tax loss sellers destroy it. If all goes well, you can buy it back lower down as the liquidity issue bites the share price closer to the financial year-end.Even if you don't have tax issues, thanks to tax loss selling, trading opportunities can arise, especially in the small illiquid stocks that get massacred. Once the tax loss selling fades away, sold-down stocks can bounce significantly as small buy orders rebound the prices. So traders should be looking for the lows in small illiquid sell-offs over June, hoping for a rally into July. But another word to the wise, whilst you might think you should wait until July 1st to buy, experience suggests that many of the stocks impacted by tax loss selling tend to bounce before the year-end, a week or so before. So for a trader, the game is to identify the stocks getting destroyed and watch for the first rally, rather than July 1st, to get stuck in. The rebounds can be just as sharp as the last-minute drops. Hesitate and you'll miss it. Which Stocks Do You Sell for Tax Reasons?I could list the worst performer in the last year, but it's a bit irrelevant. The stocks that you should target are the stocks in your own portfolio. I don't know what they are, you do, and anyway, you may not have a capital gains tax issue. But if you do, it's pretty clear which stocks you need to focus on, it's the stocks are you holding at a loss. The smaller and more illiquid they are, the earlier you need to sell them and, if you still want to continue to hold the stock long term, the closer to June 30th you buy it back, the cheaper you should get it.And I know a lot of you are in denial about those short-term trades that became long-term 'investments', on all those holdings worth $100 that used to be worth $10,000. A common catchcry is that "there's no point selling". But if you have capital gains, there is a point. They too have value now.Legal Note: ATO Wash Sales ProvisionsIf you do decide to take a loss before June 30th but plan to re-adopt one or more of your dogs in the new financial year, be mindful of the ATO's position on wash sales. If you repurchase the shares you sold very shortly after at a similar price, the ATO will look at that transaction unfavourably, and you may be subject to anti-avoidance rules.Taking Advantage of the SellingThe only 'game' you could play here is as a trader buying the stocks that get pummeled running into the last week of June. Stocks that are trading favourites always have a lot of 'stale' holders. They are killed in June and often resurrected in July. There may be a trade in there, capitalising on other people's laziness (leaving their tax loss selling to the last moment) and mistakes (buying small illiquid stocks that fell over).Hints for Taking a LossIt is one of the hardest things to take a loss. So to help with the process, I have developed arguments to persuade you. If you are having trouble taking a loss, are not enjoying your trading, are getting emotional, and the stock is still in your possession... read my reasons for why you should think about letting go of the dogs. You will have put the sell order on before you get to the end:
Hopefully, you hold good long-term stocks and won't have to take a loss, but when you do, read this again and see if you can get to the bottom of the list before you put the sell order on. Author: Marcus Padley |
|
Funds operated by this manager: |

23 May 2024 - The Rate Debate - Navigating Australia's Economic Crossroads
|
The Rate Debate - Navigating Australia's Economic Crossroads JCB Jamieson Coote Bonds May 2024 Without the significant influx of people migrating to Australia over the last 18 months, the country has been in recession since the first quarter of 2023. In fact, when adjusted for population growth, this marks the longest running recession Australia has experienced since the early 1990s. There's mounting evidence that the Australian economy is losing momentum. Not only in economic indicators such as declining retail sales, dwindling consumer confidence, collapsing savings rates, and unemployment ticking higher, amongst other signs. Many readers will likely agree that the hardships facing many people in the community are becoming increasingly evident through personal stories and experiences. The Reserve Bank of Australia (RBA) has acknowledged this trend, stating that "household consumption growth has been particularly weak as high inflation and the earlier rises in interest rates have affected real disposable income. In response, households have been curbing discretionary spending." This raises the question: what would be the cost to the Australian economy if interest rates were to go up from here? There's no doubt that inflation remains high and has exceeded the RBA's target range. However, it's also true that inflation is easing in response to one of the fastest monetary policy tightenings in history. Given these factors, the RBA must carefully consider the potential economic fallout before deciding on additional rate increases. It's both sobering and indeed encouraging to see just how far we have come in the fight against inflation in a relatively short period of time. After reaching a peak of 7.8% in the December quarter of 2022, we've observed a consistent downward trend in the quarterly year-on-year Consumer Price Index (CPI) numbers: 7.0%, 6.0%, 5.4%, 4.1% and most recently, 3.6% in the January quarter. It's easy to forget, but the inflation figure for the final quarter of 2023 surprised on the downside, with a quarter-on-quarter increase of just 0.6% versus the expected 0.8%. It's as if some inflations hawks are pushing for a deep recession just to bring inflation down rapidly. They seem to think that rescuing an economy from a potential deep recession is easy and that slashing interest rates will solve all the problems. However, economic momentum is everything, and a steady return to target inflation, rather than forcing a deep and painful recession, is a much smarter approach to pursue price goals. Thankfully, Michelle Bullock acknowledged as much in her recent press conference. Amazingly, global markets currently predict that only two central banks - the Bank of Japan and the RBA - are expected to hike interest rates over the next two years. Meanwhile, other central banks in the developed world are projected to cut interest rates from here, with some like the European Central Bank, Bank of Canada and the Bank of England, planning fairly aggressive cuts over the coming 12 months. Even the US Federal Reserve (US Fed) is likely to cut rates by the end of the year. In my over 20 years in the bond and money markets, I've never seen such a wide dispersion of views and opinions on interest rates as we currently have in Australia. We are at a pivotal moment in monetary policy. Inflation hawks point out that the RBA cash rate is significantly lower than the US Fed's (4.35% versus 5.375%), but there's a clear reason for this discrepancy. Since the first round of rate hikes, Australian mortgage rates have increased by over 3%, compared to just 0.5% in the United States. This difference illustrates how much more potent the transmission of interest rate hikes is in Australia compared to other jurisdictions. The dominance of 30 year fixed rate mortgages in the US, contrasted with the predominantly floating rate mortgages in Australia, means it's much harder for monetary policy to slow the economy down in the US than it is in Australia - that is, monetary policy has a more immediate impact on the Australian economy. It's evident that the 425 basis points of rate hikes since 2022 are working, and the lags of monetary policy are hitting the economy just enough to slow it down. Given this, raising rates to 5.0% would be seriously detrimental to the Australian economy. It's essential to consider this context when debating the appropriate level for interest rates in the current environment. Whilst first quarter inflation numbers came in above market expectations due to factors that rate hikes can't easily control, the wild predictions of several more rate hikes from here are unfounded. I believe the RBA's next move will be a rate cut later this year as the economy continues to slow down and react to the squeeze of higher rates. The RBA has indicated that the current level of interest rates is sufficient to bring inflation back within target by the end of next year. Meanwhile, in the US, the mortgage market is unlikely to be a source of any turbulence from higher rates. The real risks lie in the corporate credit markets, where tenors of borrowings are much shorter and significant expiries are set to occur from 2025 and onwards. Consider this: $2.5 trillion dollars of corporate bonds expire in 2025, and another $2.8 trillion in 2026, all rolling off very low interest rates. With the US Fed likely projected to cut rates only one or two times this year from six that were priced in at the end of 2023, many chief financial officers will be anxious about whether investors will lend to lower-rated corporates when a 10-year US Treasury bond offers 4.50%. Different countries face different challenges, and it's crucial to understand these nuances when considering monetary policy and its broader effects. Given these complexities, Australians face a unique economic landscape. The current context requires careful consideration of monetary policy's role in stabilising the economy without triggering a deeper downturn. Understanding these dynamics is key to navigating the uncertainty ahead. Funds operated by this manager: CC Jamieson Coote Bonds Active Bond Fund (Class A), CC Jamieson Coote Bonds Dynamic Alpha Fund, CC Jamieson Coote Bonds Global Bond Fund (Class A - Hedged) |

22 May 2024 - Looking beyond the noise at this year's Budget
|
Looking beyond the noise at this year's Budget Pendal May 2024 |
|
WHEN you've watched enough federal Budgets (this was my 35th in markets), you start to see familiar patterns across commentaries. Every vested interest or ideological bent comes out bleating about the Budget being irresponsible or reckless, that there's too much spending or not enough major reform. What worries me more is when people view the government as no more than a large corporation and when they speak of the budget like a profit and loss statement. Looking through the noise and self-interest is what really matters for bond markets in the year ahead. I have narrowed it down to three impacts. InflationThere are a number of direct measures that reduce inflation, one of which is electricity subsidies. Every household gets $300 off their electricity bill, by way of quarterly $75 payments directly off the bill. Businesses receive $325. The average household bill is $2,000 a year, so that's 15% off. Electricity is 2.4% of the CPI basket, so this equates to 0.36% off inflation in direct impact. The government is quoting 0.5% overall impact.

Queensland has already announced a $1,000 subsidy while Western Australia has announced a $400 subsidy, again not means tested. It will be interesting to see what upcoming state budgets keep rolling existing subsidies (no impact to inflation), let them roll off (inflationary) or, like Queensland, increase them (deflationary). If we assume modest subsidies coming up from other states, then the electricity impact on lower CPI could be 0.8% or even higher. Other measures in rental assistance and cheaper medicines are slightly deflationary. Overall, federal Treasury is forecasting inflation of 2.75% in 2024/25, which is below the current Reserve Bank (RBA) forecast of 3.2%. We expect an upcoming downward revision of the RBA forecast of 3.8% CPI for 2024, which looked too high anyway. This could also see its 2024/25 forecast moderated lower, though still near 3%. Tax cuts and spendingAgainst the direct impact of the Budget on lower inflation, markets ask the question of whether the extra money in people's pockets may cause higher inflation if and when it is spent. There is around $20 billion of new spending measures (the Stage 3 tax cuts have been locked in since 2019) in this Budget, with the majority in the next two years. The Budget will return to deficit, with a forecast of $28.3 billion for 2024/25 and $42.8 billion in 2025/26. While still low by international standards, the main question is whether or not deficits are appropriate at this point of the cycle. For example, an iron ore price of US$60 is assumed, despite a current price nearer US$110 and a five-year average of US$120. This opens up potential upside surprises as we have seen in the past few years. This has really excited Budget hawks and has some calling for higher rates as all this money is supposedly spent, stoking inflation. The question I would ask is whether or not this money is being injected into an economy at full capacity. On this, my view is that we are sufficiently past the pandemic that supply chains can handle the modest rise in consumer spending without stoking inflation. Consumers will be spending more in the year ahead. Tax cuts, subsidies and lower inflation should finally see some growth in real incomes - however, this is from a base of real incomes having for the past few years.

Bond issuanceWe will see an update on the 2024/25 program from the AOFM shortly. Given high refinancing (two benchmark maturities totalling $83 billion) the borrowing task is expected to be around $90 billion, as the RBA has borrowed much more than needed this year. It is important to remember that when determining yields, bond demand and supply dynamics are largely outweighed by economics. As a bond manager, I only view supply and demand as a short-term impact around supply events. Ignore the booming debt rhetoric from some commentators and self-styled bond vigilantes - Australian debt will remain AAA for at least the medium term, and with the RBA moving to an "ample liquidity" framework, demand for bonds will remain robust. So, what does this mean for bonds?Well, the market always votes straight away, and has already made a half-hearted attempt to run with the higher spending higher inflation narrative. However, as the dust settles (to quote the cliché), yields are "sharply unchanged". I think the RBA will see the Budget for what it is - a mixed bag of measures that will leave it hopeful of further inflation relief but wary of whether the 2%-3% band can be achieved and then sustained. I would also make the observation that the "Future Made in Australia" spending is an overdue response to the global game-changing US Inflation Reduction Act. By comparison, our government's measures are modest for now, but can be expected to increase in the future. We are in a very different world to the last decade and governments must respond. For now, a more detailed breakdown of the domestic economy is below.
Author: Tim Hext, Pendal portfolio manager and head of government bond strategies |
|
Funds operated by this manager: Pendal Focus Australian Share Fund, Pendal Global Select Fund - Class R, Pendal Horizon Sustainable Australian Share Fund, Pendal MicroCap Opportunities Fund, Pendal Sustainable Australian Fixed Interest Fund - Class R, Regnan Global Equity Impact Solutions Fund - Class R, Regnan Credit Impact Trust Fund |
|
This information has been prepared by Pendal Fund Services Limited (PFSL) ABN 13 161 249 332, AFSL No 431426 and is current as at December 8, 2021. PFSL is the responsible entity and issuer of units in the Pendal Multi-Asset Target Return Fund (Fund) ARSN: 623 987 968. A product disclosure statement (PDS) is available for the Fund and can be obtained by calling 1300 346 821 or visiting www.pendalgroup.com. The Target Market Determination (TMD) for the Fund is available at www.pendalgroup.com/ddo. You should obtain and consider the PDS and the TMD before deciding whether to acquire, continue to hold or dispose of units in the Fund. An investment in the Fund or any of the funds referred to in this web page is subject to investment risk, including possible delays in repayment of withdrawal proceeds and loss of income and principal invested. This information is for general purposes only, should not be considered as a comprehensive statement on any matter and should not be relied upon as such. It has been prepared without taking into account any recipient's personal objectives, financial situation or needs. Because of this, recipients should, before acting on this information, consider its appropriateness having regard to their individual objectives, financial situation and needs. This information is not to be regarded as a securities recommendation. The information may contain material provided by third parties, is given in good faith and has been derived from sources believed to be accurate as at its issue date. While such material is published with necessary permission, and while all reasonable care has been taken to ensure that the information is complete and correct, to the maximum extent permitted by law neither PFSL nor any company in the Pendal group accepts any responsibility or liability for the accuracy or completeness of this information. Performance figures are calculated in accordance with the Financial Services Council (FSC) standards. Performance data (post-fee) assumes reinvestment of distributions and is calculated using exit prices, net of management costs. Performance data (pre-fee) is calculated by adding back management costs to the post-fee performance. Past performance is not a reliable indicator of future performance. Any projections are predictive only and should not be relied upon when making an investment decision or recommendation. Whilst we have used every effort to ensure that the assumptions on which the projections are based are reasonable, the projections may be based on incorrect assumptions or may not take into account known or unknown risks and uncertainties. The actual results may differ materially from these projections. For more information, please call Customer Relations on 1300 346 821 8am to 6pm (Sydney time) or visit our website www.pendalgroup.com |

21 May 2024 - Glenmore Asset Management - Market Commentary
|
Market Commentary - April Glenmore Asset Management May 2024 Equity markets were generally weaker in April. In the US, the S&P 500 fell -4.2%, whilst the Nasdaq was down -4.4%. In the UK, the FTSE rose +2.4%. On the ASX, the All-Ordinaries Accumulation Index fell -2.7%. Gold was the top performing sector for the second month in a row, whilst real estate was the worst performer, which offset its strong performance in March. The main driver of equity markets in the month was a change in thinking by investors around global monetary policy, which shifted from the next move being a rate cut, to in fact potentially another rate increase. This was due to inflation data released in the US on the 10th of April that showed higher than expected inflation. Consumer Price Index (CPI) data for March 2024 rose +0.4%, which was slightly higher than market expectations of +0.3%. Bond markets reacted to this news with higher yields. The US 10-year bond rate rose +42 basis points to 4.63%, whilst its Australian counterpart increased +46bp to 4.42%. The Australian dollar was flat, finishing the month at US$0.647. Funds operated by this manager: |
