News

29 Aug 2024 - The Madness Of Crowds
|
The Madness Of Crowds Marcus Today August 2024 |
|
In the world of investing, market psychology plays a crucial role in shaping market trends and creating opportunities. While much has been written about fundamental analysis--finding growth companies and trying to emulate Warren Buffett--it's essential to recognise the impact of market psychology on stock prices and investor behavior.Investors and analysts often pour over annual reports, build complex spreadsheets, and tweak inputs to determine 'fair value.' Price targets are frequently adjusted to align with market psychology, ensuring they don't stray too far from prevailing market sentiments.Meanwhile, technical analysts focus on market psychology by analyzing trends, moving averages, and pivot points. Understanding history and patterns is paramount in predicting market movements and investor behavior. Understanding the 'Great Rotation' and 'Great Correction' in US MarketsThen along comes a week like last week. The US markets went from the 'Great Rotation' in July to the 'Great Correction' in August. It happened so quickly. In the Australian Market, we fell from record highs to a big sell-off. The stocks that took us up--the banks--came under serious pressure. Every talking head and analyst had been cautious on banks. CBA had become our largest company on the ASX. It's the most expensive retail bank in the world by most metrics. Yet where was the huge growth to justify this valuation? It may be a great franchise, but growth? That looks more irrational in hindsight.Why Crowd Psychology Always Wins Over Fundamental and Technical AnalysisAnd what is driving this correction? Psychology. Crowd psychology. You can build the best spreadsheet and have the best indicators, but the 'madness of crowds' will win every time. Human beings feed on fear and greed. Humans program computers and pass on that fear and greed. In tech speak, that's called 'momentum trading'. Nearly everyone has been on the tech trade in the US. The so-called Magnificent Seven. It's been the most crowded trade for months. The trouble is, when the crowd moves, it's every man/woman for themselves. Logic goes out the window, stops from active traders are triggered, and cascade downwards. One step away from sheer panic. A charge of the flight brigade, with the same consequences. How Smart Investors Can Capitalize on Crowded TradesSmart investors can sometimes sense when the crowded trade is just too crowded. If everyone is long and bullish, who's left to buy? In the game of pass the parcel, who's going to take the stock off your hands at a higher price? Anyone? Bueller?The good news is that these crowded trades unwind fast--fast and painfully for some. For others who've been more circumspect and haven't blindly followed the crowd, it can be a huge opportunity.These times of turmoil can be portfolio-defining. Not always in a bad way.The Importance of Discipline and Strategy During Market VolatilityIt's important for investors to stay disciplined, stick to their investment plan, and use volatility to build long-term positions in quality companies.You have to look at what's worked in the past when rates were rising or at least on hold. These trades are unwinding. The so-called 'carry trade' has been under pressure; this is when borrowing in low-interest-rate environments is used to gear investments in countries with higher rates. Typically, Japan has provided cheap funding options that have allowed hedge funds and aggressive traders to take leveraged bets. That's unwinding.It seems a 0.15% rate rise in Japan was enough to send a shudder through the market with significant repercussions. But we should put this into some perspective, 0%-0.1% to around 0.25%. Maybe more to come. This was designed to curb the slide in the Yen against the US dollar. The Japanese market actually rallied post the announcement. For a day! It's all about relatives. Japan is putting its rates up, and at the same time, the US is now looking at more cuts in the coming months. Relatives.While there are opportunities, there's no point in standing in the way of the cavalry charge when the herd is moving this quickly. Wait for the moment. Have a shopping list ready of stocks that you feel safe buying and the prices you feel comfortable with. There's no rush. A rout like this hits confidence, and that takes time to rebuild.But it's important to remember, this too shall pass. Author: Henry Jennings |
|
Funds operated by this manager: |

28 Aug 2024 - The impact of AI systems on workers

S&P 500 rose +1.1%, the Nasdaq declined -0.8%, whilst in the
UK, the FTSE rose +2.5%.
27 Aug 2024 - Glenmore Asset Management - Market Commentary
|
Market Commentary - July Glenmore Asset Management August 2024 Globally, equity markets were mixed in July. In the US, the S&P 500 rose +1.1%, the Nasdaq declined -0.8%, whilst in the UK, the FTSE rose +2.5%. In Australia, the All Ordinaries Accumulation Index outperformed its global peers, rising +3.8%. The top performing sectors on the ASX were retail (boosted by investors positioning for improved consumer spending) and gold, which was assisted by expectations of falling bond yields. In the US economy, cooling inflation and a weakening labour saw expectations of interest rate cuts increase. In US equities, this saw a rotation out of some of the large cap tech stocks that have performed extremely well in the last 12 months into small caps, with the logic being that interest rate cuts will result in improved economic growth and a wider range of companies outperforming. In bond markets, the US 10-year bond rate fell -17 basis points (bp) to close at 4.14%, whilst its Australian counterpart fell -19 bp to 4.12%. The driver of lower bond rates was expectations that the Federal Reserve (US central bank) is getting closer to cutting interest rates. In currencies, the A$/US$ fell -1.3 cents to close at US$0.65. August will be a very busy month given the vast majority of the companies in the fund will report their full year results. Funds operated by this manager: |

26 Aug 2024 - 10k Words | August 2024
|
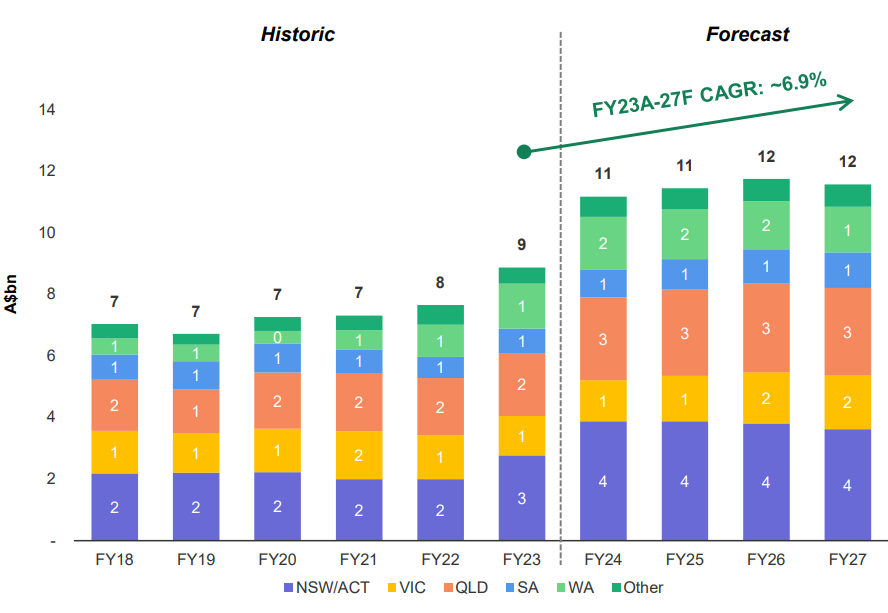
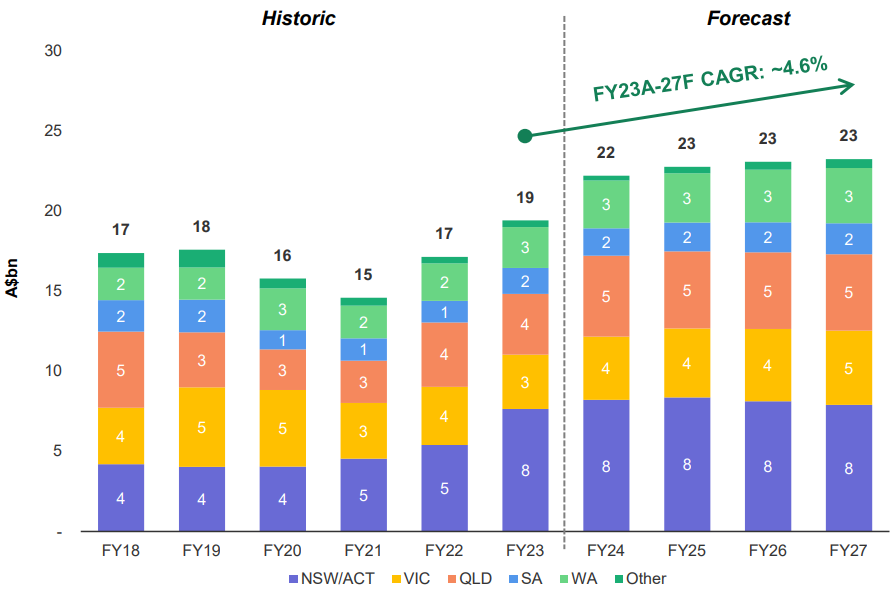
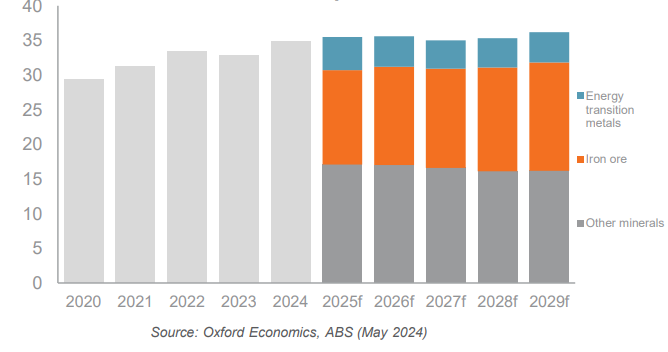
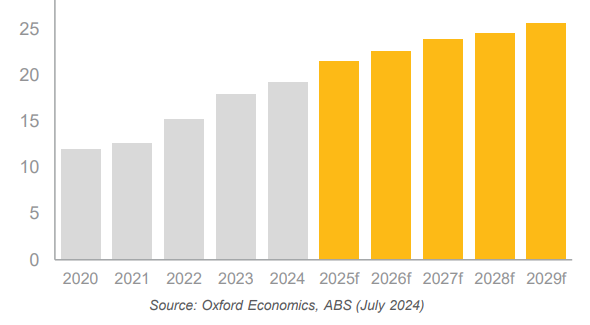
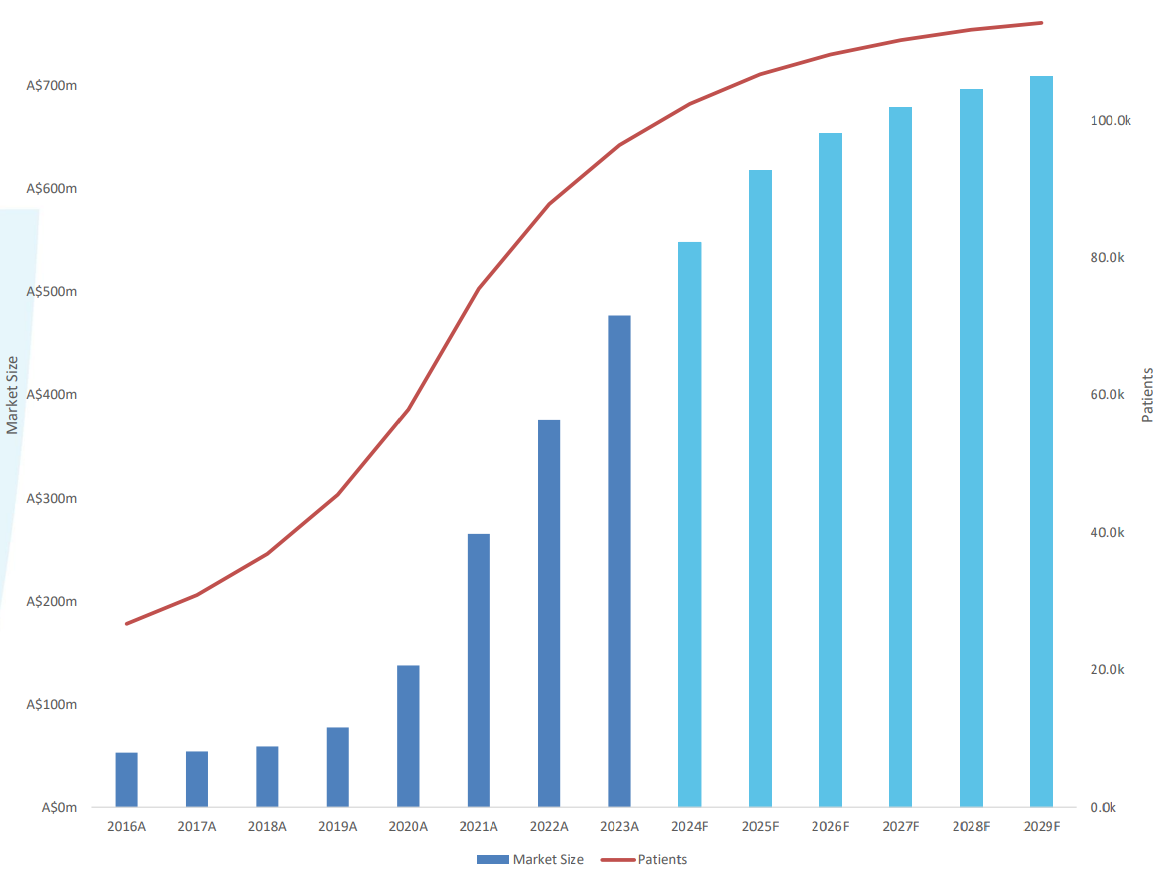
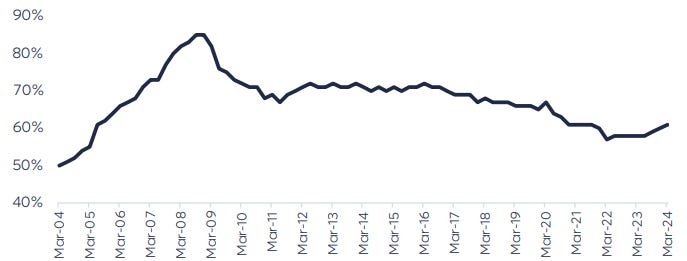
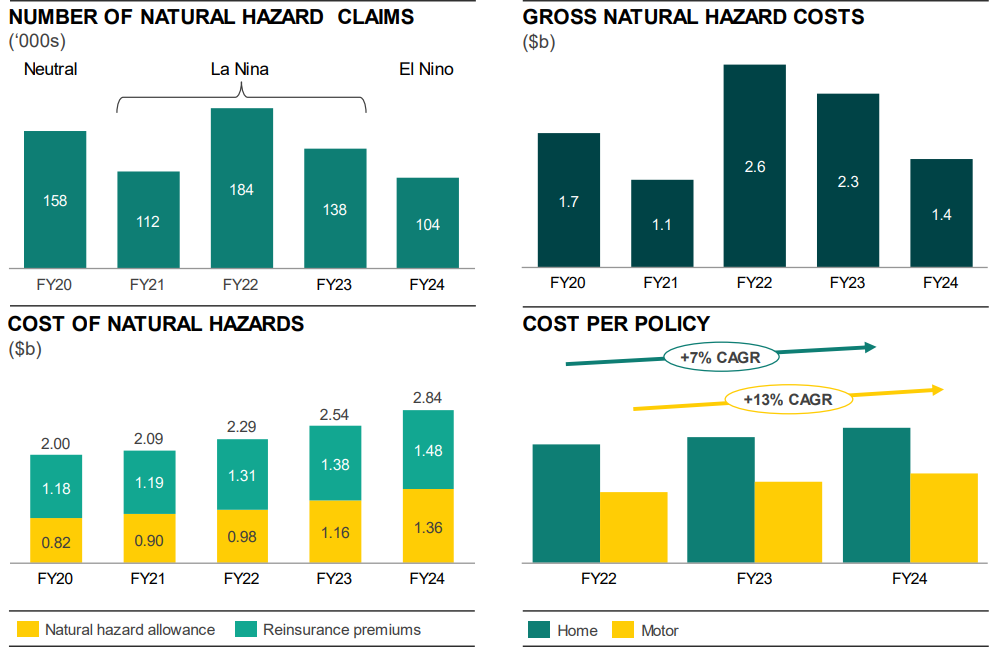
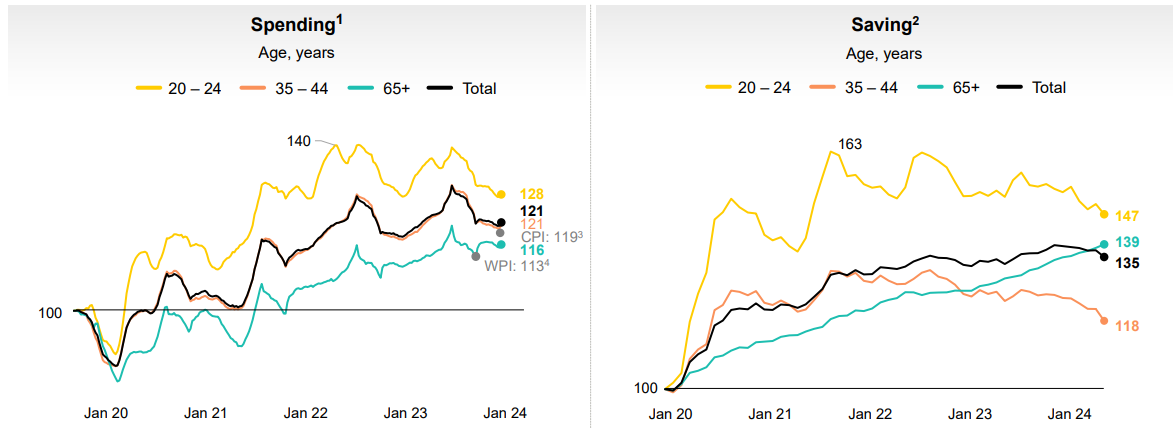
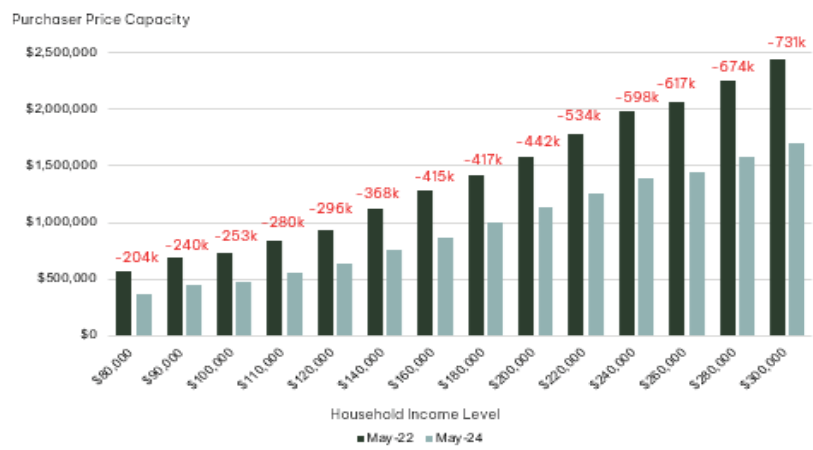
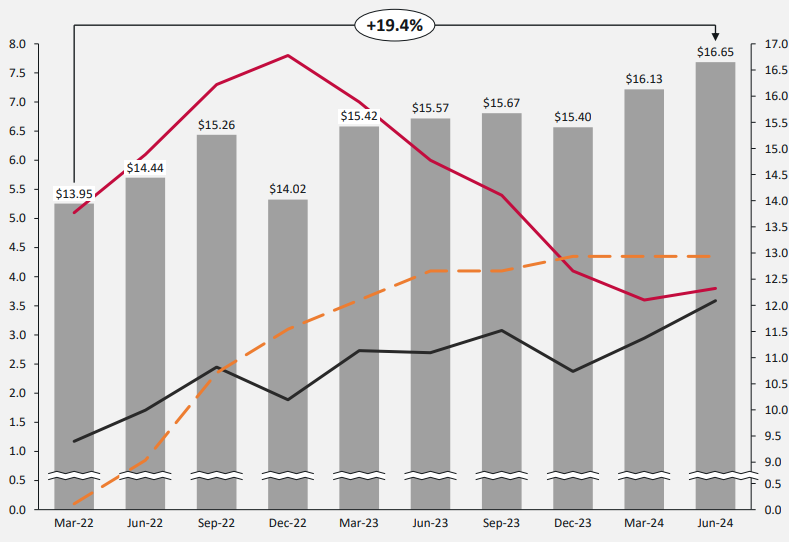
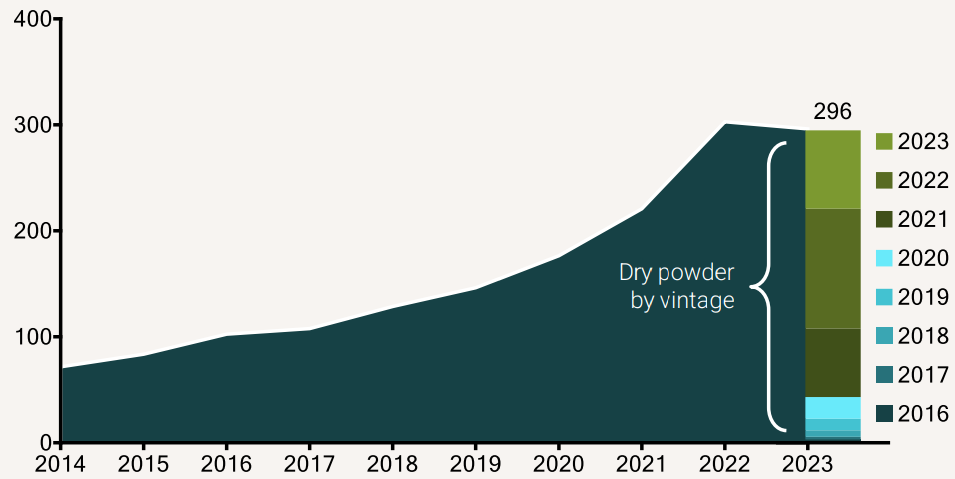
10k Words Equitable Investors August 2024 We are in the midst of ASX reporting season so let's allow the corporates to tell the stories via charts this month - starting with the engineering firms chasing growth markets, stopping for some medicinal cannabis, then on to the financial world. Private company debt ratios have been on the rise and so have insurance premiums. The banks take a look at how prevailing interest rates and inflation have impacted different households. Homebuilders look at what those households can afford. Yet the price and utilisation of gyms just keeps rising. Finally, those serving the tech sector are taking heart from the amount of capital the VC world has committed. Australian water infrastructure - forecast spend Source: SRG Global, ACIF Australian energy & gas infrastructure - forecast spend Source: SRG Global, ACIF Australian resources capex - forecast Source: Mondaelphous, Oxford Economics, ABS Australian electricity infrastructure capex - forecast Source: Mondaelphous, Oxford Economics, ABS Australian medicinal cannabis market size - forecast Source: Wellnex, Statista Private company debt to equity ratio - Australia Source: Judo Bank, ABS Factors driving insurance pricing & profitability Source: Suncorp, Insurance Council of Australia Spending & saving behaviour by age cohorts Source: Commonwealth Bank of Australia Australian household borrowing capacity in May 2024 v May 2022 Source: Simonds Group The fitness industry - average revenue per member (grey bars) and utilisation (black line) v inflation (red) and interest rates (yellow) Source: Viva Leisure Cumulative VC "dry powder" by vintage ($US billion) Source: Enero, Pitchbook NVCA Venture Monitor August 2024 Edition Funds operated by this manager: Equitable Investors Dragonfly Fund Disclaimer Past performance is not a reliable indicator of future performance. Fund returns are quoted net of all fees, expenses and accrued performance fees. Delivery of this report to a recipient should not be relied on as a representation that there has been no change since the preparation date in the affairs or financial condition of the Fund or the Trustee; or that the information contained in this report remains accurate or complete at any time after the preparation date. Equitable Investors Pty Ltd (EI) does not guarantee or make any representation or warranty as to the accuracy or completeness of the information in this report. To the extent permitted by law, EI disclaims all liability that may otherwise arise due to any information in this report being inaccurate or information being omitted. This report does not take into account the particular investment objectives, financial situation and needs of potential investors. Before making a decision to invest in the Fund the recipient should obtain professional advice. This report does not purport to contain all the information that the recipient may require to evaluate a possible investment in the Fund. The recipient should conduct their own independent analysis of the Fund and refer to the current Information Memorandum, which is available from EI. |

26 Aug 2024 - Manager Insights | Seed Funds Management
|
Chris Gosselin, CEO of Australian Fund Monitors, speaks to Nicholas Chaplin, Director and Portfolio Manager at Seed Funds Management. The Seed Funds Management Hybrid Income Fund has a track record of 8 years and 10 months and has outperformed the Solactive Australian Hybrid Securities (Net) benchmark since inception in October 2015, providing investors with a return of 8.41% over the past 12 months and an annualised return of 6.4% since inception compared with the benchmark's return of 4.84% over the same period.
|

23 Aug 2024 - Beyond carbon: Identifying climate transition risks and opportunities
|
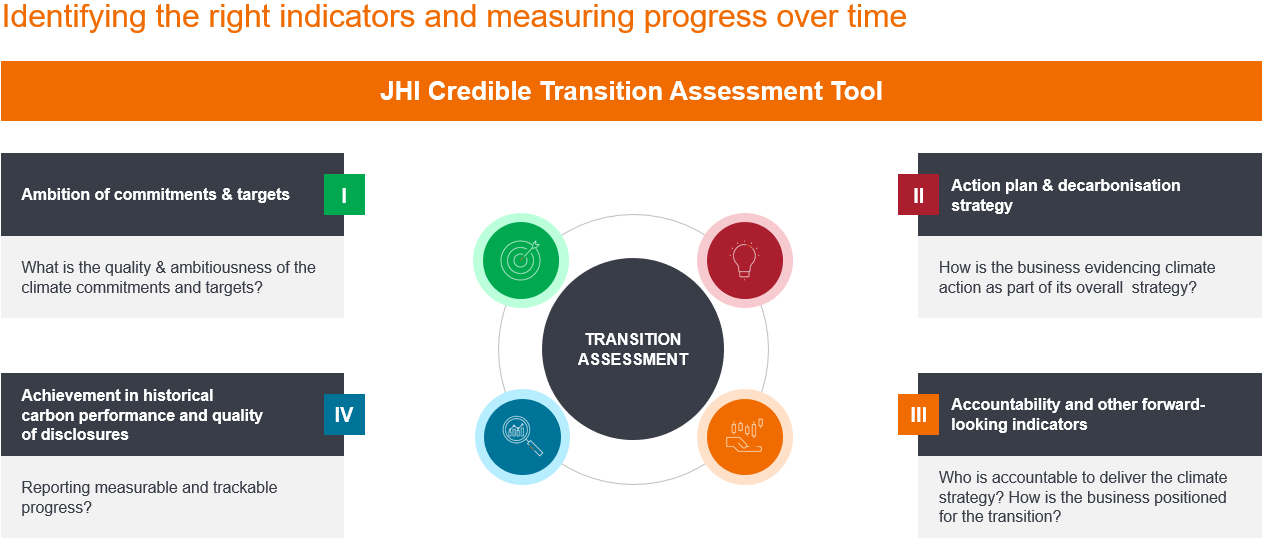
Beyond carbon: Identifying climate transition risks and opportunities Janus Henderson Investors July 2024 As countries and companies commit to limiting global temperature rise to 1.5°C by decarbonising the global economy by 2050 the net zero transition poses both risks and opportunities. Here we explore the importance of evaluating the credibility of corporate transition plans across key industries to identify the leaders and laggards capable of delivering long-term returns. This was the subject of a recent debate hosted by our Chief Responsibility Officer, Michelle Dunstan, alongside a panel of experts for the recent Janus Henderson 'Beyond Carbon: Investing in a credible climate transition to drive real-world change' webcast. Credible plansEvaluating the credibility of transition plans is far from straightforward, explained Adrienn Sarandi, Global Head of ESG Solutions & Strategic Initiatives. However, whilst there isn't an internationally agreed definition of a credible transition plan, there are similarities across various frameworks and regions on the key areas to focus on. Essentially, a credible transition plan must explain how a company is going to deliver on its net zero commitment and what the dependencies are that underpin the implementation of the climate strategy. Credible science-based targets and commitments need to be backed up by a detailed action plan, accountability to deliver those ambitions, and reporting on progress needs to be clear and transparent. "Investors understand the importance of long-term climate transition planning," noted Adrienn. "However, the challenging thing about evaluating climate transition plans is how do you really know who's got a credible transition plan? And how do you know who the leaders and the laggards in a sectoral and regional context are?" To address these challenges, Janus Henderson has developed an internal framework that leverages data, research, and active stewardship, as well as a proprietary Credible Transition Assessment tool (Exhibit 1) that includes over 110 indicators and signals to "dig deep into the detail" behind companies' commitments, targets, historical carbon performance drivers and action plans to deliver their climate commitments as part of the wider business strategy. Exhibit 1: Data driven evaluation
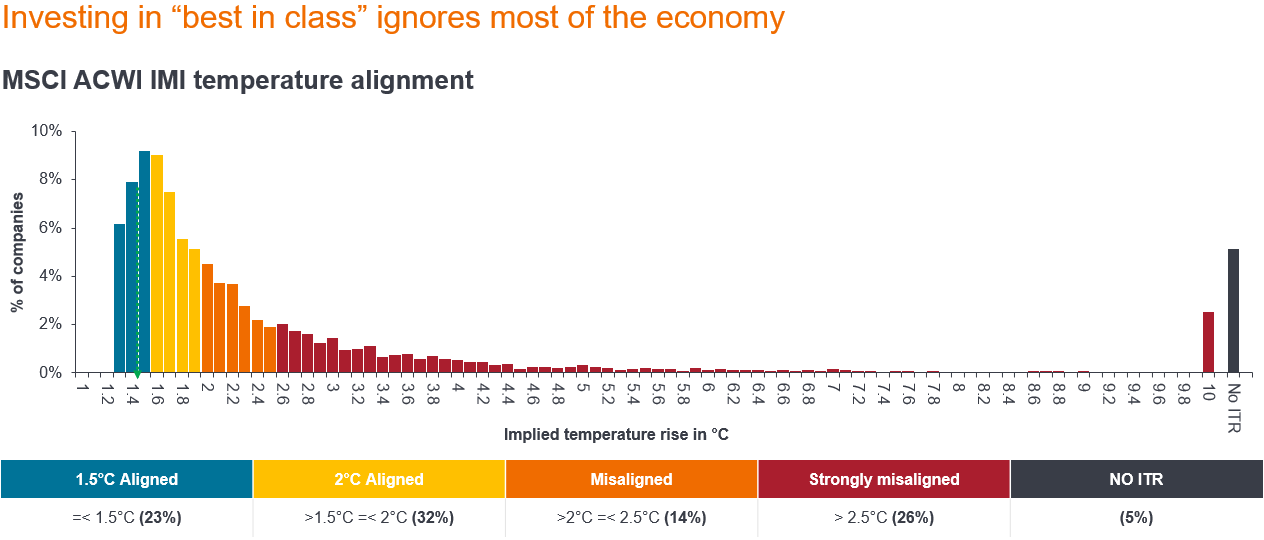
Source: JHI Methodology; data sources include company reports, MSCI ESG Manager, TPI, SBTi, CDP, Bloomberg. Further, as shown in Exhibit 2, in a 1.5°C scenario the investible universe is extremely limited, with very few companies aligned to a limiting a global temperature rise at that level. "By only investing in low carbon 'best in class' companies, investors risk ignoring most of the real economy, foregoing the opportunity to drive real world change through engagement, and creating a skewed portfolio by investing in just a handful of sectors," according to Michelle. Exhibit 2: Few companies align to a 1.5°C scenario today
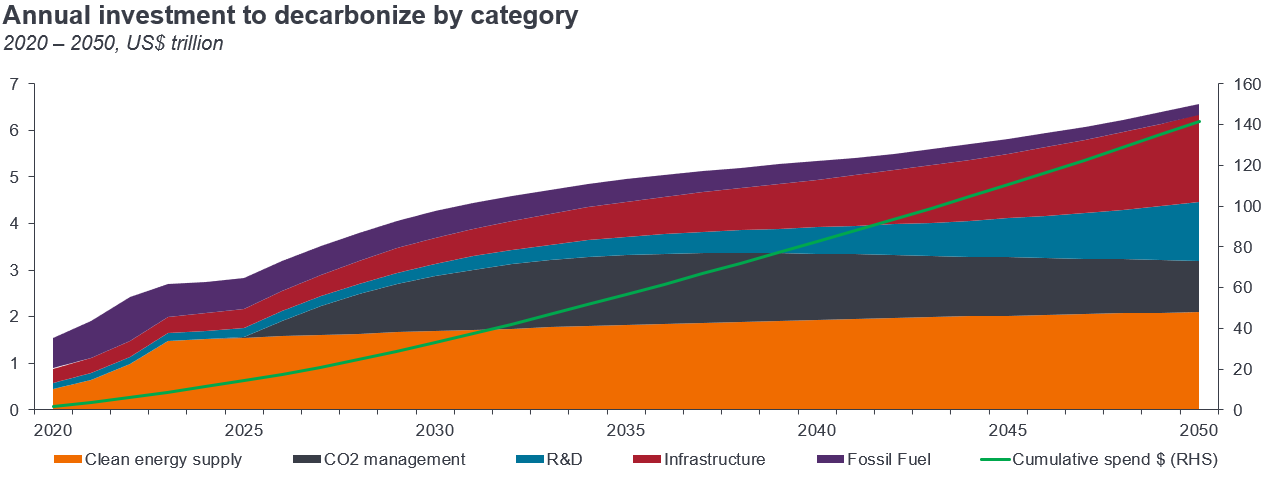
Source: MCSI ESG Manager, as of 30 April 2024, MSCI All Country World Index Investable Markets Index (ACWI IMI), n=8,911 companies, Market Cap US$107 trillion. Unlocking opportunityThe importance of effectively evaluating companies' transition plans comes down to one key word - "opportunity", according to Senior Investment Manager in the Global Sustainable Equity Team, Tal Lomnitzer. "This refers to the opportunity to make strong returns and to make a positive contribution to the much-needed energy transition," noted Tal. "We're talking about a broad set of attractive long-term growth opportunities as the world's energy, industrial, transportation, production, and consumption systems transition to a low carbon economy." To achieve the net zero transition requires a large level of investment, encouraged by a mixture of sticks, including carbon taxes and a phasing out of fossil fuel subsidies, and carrots, such as incentives for renewable energy expansion. These levers are encouraging economic actors to reduce energy-related greenhouse gas emissions (GHG). As shown in Exhibit 3, a lot of money is forecast to flow towards addressing climate change - an expected US$140 trillion by 2050. That investment spans a range of opportunities, primarily across clean energy and other associated infrastructure. Exhibit 3: The investment opportunity is large...
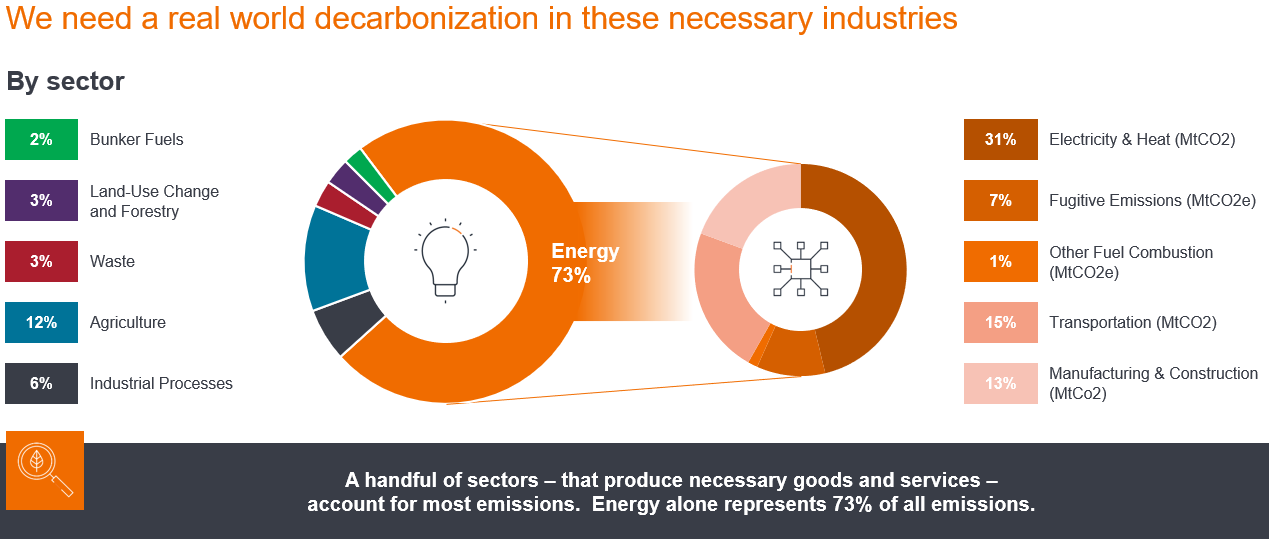
Source: IEA World Energy Investment 2020, UBS Research "On the risk side, there are going to be certain companies that just can't make the shift, leaving them at risk of having stranded assets, missing earnings projections, losing market share and ultimately leading to poor shareholder returns," said Tal. Striking the right balance between risk and opportunity is vital when constructing a transition fund, especially when there is rising interest among investors for exposure to this area of the market, with European sustainable funds attracting US$10.9 billion in Q1 - more than doubling the previous quarter, according to data and analytics provider Morningstar.3 As explored in a recent energy transition article, Tal identified three types of companies that play a key role in making the climate transition a reality: Green solutions: Companies with revenue exposure to clean energy deployment or low emission operations, such as wind turbines, solar panels, semiconductors used in clean tech or electric vehicles, providers of renewable or efficiency technology. Enablers: Providers of low-carbon critical commodities like copper or lithium, financers of low carbon or clean energy deployment, computer aided design (CAD) software or engineering services to design industrial plant, semiconductors, providers of precision farming equipment or plant-based proteins for reducing the environmental footprint of feeding the growing world population. Improvers: 'Brown to green' - companies that provide essential goods and services like auto makers, aviation companies, electricity utilities, oil and gas producers, steel producers, or cement makers but are trying to do so with a lower carbon impact. Green solutions: Winds of changeWithin the green solutions category, manufacturers of wind turbines, such as Denmark-based Vestas, have strong tailwinds. Offshore wind generation in Europe alone is set to rise from 30 gigawatts (GW) in 2023 to 60 GW by the end of the decade. That figure is forecast to climb to anywhere between 300-500 GW in 2050, representing a tenfold growth in offshore wind generation in the region.4 Further, investment is mobilising into onshore and offshore wind generation through various initiatives, including €300 billion (US$322.6 billion) REPowerEU5 - a plan to end reliance on Russian fossil fuels before 2030 in response to the war in Ukraine - as well as US$360 billion from the US Inflation Reduction Act, which is extending the runway for tax credits for companies operating in the industry.6 For companies like Vestas, these tailwinds create an opportunity, according to Tal, at a time when a combination of headwinds, including irrational pricing from competitors, cost inflation, a slowdown in the industry due to permitting delays and rising financing costs, are dissipating. Enablers: Mining and metalsWithin the enablers category, which encompasses companies involved in the supply chain that allow green solutions to exist and be deployed, Tal noted the essential role of commodities like copper. The metal is vital in advancing electrification - the replacement of technologies or processes that use fossil fuels, like internal combustion engines and gas boilers, with electrically-powered equivalents, such as electric vehicles or heat pumps. He pointed to Canada-based Ivanhoe Mines, a company that recently made one of the largest, highest grade copper discoveries of the past 30 years in the Democratic Republic of Congo, as an example of a key player within this category. "It's a real success story in an industry that has historically struggled to deliver projects, on time and on budget," said Tal, adding that it also produces some of the lowest carbon footprint copper on the planet due to the company using hydropower generated from the waters of the Congo River to power its processing operations. Improvers: Turning greenCompanies within the improvers category typically have a significant carbon footprint but are actively working to improve their business to align with a net zero future. Further, it is imperative for both investors and members of the fossil fuel industry to pivot towards strategies that minimise transition risk and drive innovation for a viable energy future. "The bottom line is we need to facilitate the transition, while keeping the world spinning. If we stop oil production today, we're going to quickly face a huge hit to global economies," said Tal, adding that we lose the chance to drive real change by only investing in climate leaders. Leveraging our insights from our research to find companies within hard-to-abate sectors like oil and gas that are truly committed to change, and then engaging with them to establish credible transition plans that enable them to better prepare for the future is far better than the divestment route, he added. Research Analyst Noah Barrett also argues that this is an area of the market where the most meaningful rate of change stories are currently occurring. A standout example within the improver category, according to Noah, is French oil and gas supermajor TotalEnergies, which has a presence in both upstream and downstream operations. "The company's absolute carbon footprint can be viewed as a challenge, but TotalEnergies' scale also represents a significant advantage in the transition, because the existing conventional production base generates a significant amount of cash flow, which can be reinvested into lower carbon energies," said Noah. Relative to its peers in the oil and gas sector, which tend to rely on divestments or the buying of carbon offset to meet their energy transition goals, the French supermajor has dedicated the highest percentage of capital expenditure to low-carbon business operations, with the goal of becoming one of the five largest producers of renewable energy by 2030. Engaging for insight and actionFor companies in the improver category that have carbon intensive businesses, we attempt to identify those that operate in a responsible manner and have a credible transition plan to a less carbon intensive model, with engagement a key component in that process. As investors, we not only harness the insights gleaned from engagements to make better investment decisions, but to encourage companies to adopt strategies and initiatives that will better prepare them for the transition to a lower carbon economy, while also helping preserve cash flows and valuation multiples - making them more attractive investments for our clients. Responsible Investment and Governance Analyst Olivia Gull has been examining oil majors for several years through an environmental, social, and governance (ESG) lens, identifying industry leaders and laggards. Speaking on engagements with TotalEnergies, Olivia noted that, from a governance perspective, there has been a level of consistency. "Whereas we've seen some oil majors alter or roll back targets, TotalEnergies has kept its transition strategy the same since 2020. Further, their CEO and Chairman Patrick Pouyanné who, beyond overseeing this strategy, has set a strong tone from the top when it comes to its climate transition." The French oil major's executive compensation is also well-aligned to its broader net zero ambitions, with performance shares (or long-term incentive compensation) tied to lifecycle carbon intensity of products sold (or scope 1+2+3), adding another layer of credibility to the company's transition strategy. Over the past three years, we have met with TotalEnergies several times to discuss a range of ESG and sustainability topics, with methane emissions one we will likely continue to engage with the supermajor on for the foreseeable future. Methane is a potent GHG that has over 80x the warming potential of carbon dioxide (CO2). Therefore, a reduction in methane emissions, particularly in the energy sector, is the fastest way to reduce global warming in the short-term - it's also extremely cost-effective. According to the International Energy Agency (IEA), around 40% of methane emissions from fossil fuel operations in 2023 could have been avoided at no net cost since the value of the captured methane was higher than the cost of the abatement measure.7 "We've been speaking to the sector over the past few years on how they are managing their methane emissions across the operations, and when it comes to TotalEnergies they have very high standards across their operated assets," noted Olivia. As a result, our engagements with the firm have focused particularly on non-operated assets, where the company has an equity stake or a joint venture with another oil and gas company. "This is where most of the issues lie." Olivia explained that initially some oil and gas companies were reluctant to take accountability for their non-operated assets. But following ongoing engagement with TotalEnergies, the supermajor has begun providing reporting on its non-operated assets methane emissions. Further, we are also seeing a lot more policy support on methane. In November 2023, several new announcements to reduce methane were made at COP28 climate summit were made, including the establishment of the Oil and Gas Decarbonisation Charter, and new countries joining the Global Methane Pledge. Climate mosaicAccording to Tal, via a mixture of research and engagement, and as shown in Exhibit 4, it is possible to identify key sectors and sub-sectors that contribute to the climate transition, such as materials, transport, chemicals, finance, technology, oil and gas, utilities, and real estate - "they're all a part of that mosaic". Exhibit 4: We can't ignore the "dirty" sectors
Source: Climatewatchdata.org (World Resources Institute 2024), latest data as of 2020. "We drill into the companies in great depth to understand their business models and their transition goals, so we take an approach that considers sales, earnings and cash flow growth on a per share basis," noted Tal. We undertake in-house analysis of companies' transition plans in terms of the short-, medium-, and long-term horizons, identifying opportunities for lowering their carbon footprints. rather than just focusing solely on those with the greenest credentials today. "Our goal here is to generate the best risk-adjusted returns we can for investors," concluded Tal. "By adopting this approach, we believe that investors can make long-term investment returns, while also driving the transition forward." Author: Michelle Dunstan - Chief Responsibility Officer, Adrienn Sarandi - Global Head of ESG Solutions & Strategic Initiatives, Tal Lomnitzer - CFA |
|
Funds operated by this manager: Janus Henderson Australian Fixed Interest Fund, Janus Henderson Australian Fixed Interest Fund - Institutional, Janus Henderson Cash Fund - Institutional, Janus Henderson Conservative Fixed Interest Fund, Janus Henderson Conservative Fixed Interest Fund - Institutional, Janus Henderson Diversified Credit Fund, Janus Henderson Global Equity Income Fund, Janus Henderson Global Multi-Strategy Fund, Janus Henderson Global Natural Resources Fund, Janus Henderson Tactical Income Fund 1Source: UK Transition Plan Taskforce, Disclosure Framework 2Source: The International Sustainability Standards Board, IFRS 1 and 2 inaugural standards 3Source: Morningstar, 'Global Sustainable Fund Flows: Q1 2024 in Review' 4Source: European Commission, Offshore renewable energy 5Source: European Commission, REPowerEU 6Souce: The Conversation, 'Getting to net zero emissions: How energy leaders envision countering climate change in the future' 7Source: International Energy Agency, 'After slight rise in 2023, methane emissions from fossil fuels are set to go into decline soon' Capital expenditure: Money invested to acquire or upgrade fixed assets such as buildings, machinery, equipment or vehicles in order to maintain or improve operations and foster future growth. ESG: Environmental, Social and Governance (ESG), also known as sustainable investing, considers ethical factors beyond traditional financial analysis. Free cash flow (FCF): Cash that a company generates after allowing for day-to-day running expenses and capital expenditure. It can then use the cash to make purchases, pay dividends or reduce debt. Net zero: A state in which greenhouse gases, such as Carbon Dioxide (C02) that contribute to global warming, going into the atmosphere are balanced by their removal out of the atmosphere. Scope 1 carbon emissions: Direct Green House Gas (GHG) emissions from owned or controlled sources. Scope 2 carbon emissions: Indirect Green House Gas (GHG) emissions, such as that created through the generation of purchased energy (eg. electricity). Scope 3 carbon emissions: Associated Green House Gas (GHG) emissions related to the entire value chain of a business that it is indirectly responsible for, from products purchased from suppliers to its own products when consumers use them. MSCI All Country World Index Investable Markets Index (ACWI IMI): The index captures large, mid and small cap representation across 23 developed markets and 24 emerging markets countries. With 8,847 constituents, the index is comprehensive, covering approximately 99% of the global equity investment opportunity set. Energy industries can be significantly affected by fluctuations in energy prices and supply and demand of fuels, conservation, the success of exploration projects, and tax and other government regulations. There is no guarantee that past trends will continue, or forecasts will be realised. This information is issued by Janus Henderson Investors (Australia) Institutional Funds Management Limited (AFSL 444266, ABN 16 165 119 531). The information herein shall not in any way constitute advice or an invitation to invest. It is solely for information purposes and subject to change without notice. This information does not purport to be a comprehensive statement or description of any markets or securities referred to within. Any references to individual securities do not constitute a securities recommendation. Past performance is not indicative of future performance. The value of an investment and the income from it can fall as well as rise and you may not get back the amount originally invested. Whilst Janus Henderson Investors (Australia) Institutional Funds Management Limited believe that the information is correct at the date of this document, no warranty or representation is given to this effect and no responsibility can be accepted by Janus Henderson Investors (Australia) Institutional Funds Management Limited to any end users for any action taken on the basis of this information. All opinions and estimates in this information are subject to change without notice and are the views of the author at the time of publication. Janus Henderson Investors (Australia) Institutional Funds Management Limited is not under any obligation to update this information to the extent that it is or becomes out of date or incorrect.
|

22 Aug 2024 - Dion Hershan: 805 days down (and counting)
|
Dion Hershan: 805 days down (and counting) Yarra Capital Management July 2024 With interest rate hikes starting to bite, Dion Hershan, Head of Australian Equities, asks just how resilient will Australia's economy prove to be against some obvious strengthening headwinds? Many people have marvelled at the resilience of the Australian economy and its recession proof qualities over the last two years in the face of 13 interest rate hikes which kicked off in May 2022 (some 805 days ago). However, given the lags associated with monetary policy are 'long and variable', we wonder if it may still be a little premature to make that call. Rather than calling out its 'resilience', perhaps it's Australia's binge on five specific factors (below) and the delayed impact of rate hikes that have masked some underlying fragility. F24's 'resilience', and the very modest 1.2% GDP growth, can be traced to:
The consumer (50% of GDP) has remained stable despite very weak confidence (84.4, in-line with GFC lows) (refer chart) but drained the savings rate down to 0.9% in March 2025 (from 6.7% pre-COVID). At an average savings rate of 90 bps, you can safely assume more than half the population currently has a negative saving rate. After any good binge there is typically indigestion or a hangover, which could well be the phase we are heading into. Chart 1: Consumption growth & consumer confidence are at ~10-15 year lows
Source: YarraCM, Westpac, ABS.Many of these factors now represent formidable headwinds, signalling that the hangover might soon be on the way. In particular:
The average consumer can't run down their savings any further, creating real distress for many people and a forced cut in consumption. And with the economy remaining at close to full employment and inflation above target, meaningful rate cuts are at best a long shot. It appears more likely that we are in for a slow grind. In our view, we're in an environment where we need to tread very carefully after the recent rally, with consensus expectations as realistic as Trump not getting fact checked for the rest of the election campaign or Biden making a comeback. I would be astounded if ASX F25 EPS meets consensus EPS growth at +7.9%, ASX 200 industrials comes in at 8.8% and 35.3% for small cap industrials (refer chart) and if 55% of companies in fact have double digit EPS growth - all of which is baked into consensus. I am taking bets on the quadrella if anyone wants to place one! Chart 2: F25 earnings expectations appear highly optimistic
Source: Macquarie.So as we head into F25, we remain obsessive about businesses with very little economic sensitivity (e.g. TCL, RMD, APA, ORG), and continue to focus on turnarounds (e.g. SGM, TAH, BAP) and businesses with strong structural growth (e.g. XRO, CAR, RMD) that can avoid the hangover or indigestion. |
|
Funds operated by this manager: Yarra Australian Equities Fund, Yarra Emerging Leaders Fund, Yarra Enhanced Income Fund, Yarra Income Plus Fund |

21 Aug 2024 - What's Social Proofing?
|
What's Social Proofing? Insync Fund Managers July 2024 Observing where the world is moving to is crucial to future-proofing portfolios and generating strong consistent returns. Demographic and technological shifts are rapidly changing consumer buying patterns. While understanding numbers is important, grasping human behaviour delivers deeper insights. Diligently analyzing these shifts and their implications helps identify future winners. Social proof is a significant behavioural phenomenon now impacting purchasing decisions. It establishes trust and credibility for brands. Positive experiences shared by others reduce perceived risk and increase consumer confidence. With overwhelming choices, social proof guides consumers simplifying decision-making. Humans are social creatures, and seeing others adopt a product creates a desire to align with perceived norms. Social commerce is transforming online shopping by integrating inspiration, research, and purchase into a seamless experience. This shift enhances consumer behaviour, with social commerce poised for remarkable growth, outpacing traditional e-commerce. In 2023, it accounted for 18.5% of worldwide online sales and is projected to exceed $1 trillion by 2026. Key to social commerce's success is its authenticity and user-centric approach. Consumers discover products through peer, influencer, and brand content, fostering trust and engagement. Platforms like Instagram and TikTok are essential research tools for the Gen Z generation, emphasizing relatable and dynamic content. AI-powered recommender systems drive user engagement and targeted advertising, with companies like Meta leveraging vast amounts of data to deliver personalized content, improving ad returns and customer experiences. Funds operated by this manager: Insync Global Capital Aware Fund, Insync Global Quality Equity Fund Disclaimer |

20 Aug 2024 - Stock Story: National Grid
|
Stock Story: National Grid Magellan Asset Management July 2024 |
|
Growing electricity demand combined with the desire of governments to decarbonise their economies has presented substantial opportunities for capital investment in energy infrastructure. National Grid is a major beneficiary of these trends. The company is poised to grow the scale of its operations at a record pace over the next six years, with expectations they will commission more new and upgraded infrastructure than in the previous 30 years. National Grid has posted strong operating and financial performance over many years and now faces a prolonged period of unprecedented investment that will lead to long-term earnings growth. BackgroundNational Grid is a UK-based multinational whose primary activities are the operation of transmission and distribution of electricity and gas across the UK and Northeastern USA. National Grid operates through the following business units:
In the year ended 31 March 2024 (FY24), the Underlying Operating Profit for Continuing Operations for National Grid increased by 6% at constant exchange rates to £4,773 million. Capital investment increased to a record £8,235 million, an increase of 11% on the previous year. National Grid delivered good operational performance over FY24 with high levels of network reliability; for example, Transmission and Distribution reliability remained steady at 99%-100% across all company-owned networks. The company is committed to achieving net zero and Scope 1 and 2 emissions fell by 6% in FY24. OpportunitiesThe critical need for economies to invest in energy infrastructure has never been more pressing. Investment in an economy's energy infrastructure promotes economic growth, improves manufacturing and technology capabilities and enables decarbonisation - a key step in addressing climate change. Governments in the company's key jurisdictions have all made ambitious climate targets - the UK government has targeted a fully decarbonised electricity system by 2035 and New York has targeted a 100% zero emissions electricity sector by 2040 while Massachusetts has targeted a 50% reduction in carbon emissions by 2030. New York, Massachusetts, Vermont and New Hampshire all have ambitions to reach net zero by 2050. This decarbonisation in the US northeast and the UK is the dominant driver of growth for the company's business portfolio with the expansion and strengthening of energy systems being critical to the wider energy transition. "...artificial intelligence and advanced computing has led to increased growth in underlying electricity demand..."The impacts of decarbonisation on the energy infrastructure sector are enormous. Across the UK, New England and New York, National Grid expects electrification of heat and transport to increase electricity demand from its networks by between 37% and 51% by 2035. In the US, renewable energy capacity could almost triple by 2032 to 110 gigawatts (GW) as the Inflation Reduction Act and Infrastructure Investment and Jobs Act encourage investment in the sector. In addition, the development of artificial intelligence and advanced computing has led to increased growth in underlying electricity demand, placing further demands on the capacity and reliability of existing power systems. As a consequence, policymakers in the UK and the US are encouraging investment in electricity transmission and distribution and other energy infrastructure. Given the bulk of earnings generated by National Grid are derived from regulated energy utility businesses, this encouragement can be expected to lead to increased investment, which leads ultimately to earnings growth. Capital Investment PlanNational Grid invested £33 billion across its businesses over the past five years. In May 2024, the company announced that it expects to invest £60 billion in the five years to the end of March 2029, approximately double the level of investment of the past five years. The significant step up in capital investment will deliver annual group asset growth of around 10% and 6%-8% underlying EPS CAGR from a 2024/25 baseline. The scale of the investment is staggering. For example, the company's UK Electricity Transmission business is expected to install more than 12,000 kilometres of new cables across 17 new projects - the equivalent to the diameter of planet Earth. This investment plan is dominated by investment in electricity networks and will mean approximately 80% of group assets will be electric by 2029 compared to approximately 70% of assets today. Given the commitment of governments to ongoing decarbonisation, the increased exposure of the company to electricity networks positions them well to benefit from ongoing capital investment over the coming decades. By Gerald Stack, Head of Infrastructure & Portfolio Manager |
|
Funds operated by this manager: Magellan Global Fund (Hedged), Magellan Global Fund (Open Class Units) ASX:MGOC, Magellan High Conviction Fund, Magellan Infrastructure Fund, Magellan Infrastructure Fund (Unhedged), MFG Core Infrastructure Fund, Magellan Core ESG Fund Important Information: This material has been delivered to you by Magellan Asset Management Limited ABN 31 120 593 946 AFS Licence No. 304 301 ('Magellan') and has been prepared for general information purposes only and must not be construed as investment advice or as an investment recommendation. This material does not take into account your investment objectives, financial situation or particular needs. This material does not constitute an offer or inducement to engage in an investment activity nor does it form part of any offer documentation, offer or invitation to purchase, sell or subscribe for interests in any type of investment product or service. You should obtain and consider the relevant Product Disclosure Statement ('PDS') and Target Market Determination ('TMD') and consider obtaining professional investment advice tailored to your specific circumstances before making a decision about whether to acquire, or continue to hold, the relevant financial product. A copy of the relevant PDS and TMD relating to a Magellan financial product may be obtained by calling +61 2 9235 4888 or by visiting www.magellangroup.com.au. Past performance is not necessarily indicative of future results and no person guarantees the future performance of any financial product or service, the amount or timing of any return from it, that asset allocations will be met, that it will be able to implement its investment strategy or that its investment objectives will be achieved. This material may contain 'forward-looking statements'. Actual events or results or the actual performance of a Magellan financial product or service may differ materially from those reflected or contemplated in such forward-looking statements. This material may include data, research and other information from third party sources. Magellan makes no guarantee that such information is accurate, complete or timely and does not provide any warranties regarding results obtained from its use. This information is subject to change at any time and no person has any responsibility to update any of the information provided in this material. Statements contained in this material that are not historical facts are based on current expectations, estimates, projections, opinions and beliefs of Magellan. Such statements involve known and unknown risks, uncertainties and other factors, and undue reliance should not be placed thereon. No representation or warranty is made with respect to the accuracy or completeness of any of the information contained in this material. Magellan will not be responsible or liable for any losses arising from your use or reliance upon any part of the information contained in this material. Any third party trademarks contained herein are the property of their respective owners and Magellan claims no ownership in, nor any affiliation with, such trademarks. Any third party trademarks that appear in this material are used for information purposes and only to identify the company names or brands of their respective owners. No affiliation, sponsorship or endorsement should be inferred from the use of these trademarks. This material and the information contained within it may not be reproduced, or disclosed, in whole or in part, without the prior written consent of Magellan. |

19 Aug 2024 - New Funds on Fundmonitors.com
|
New Funds on FundMonitors.com |
|
Below are some of the funds we've recently added to our database. Follow the links to view each fund's profile, where you'll have access to their offer documents, monthly reports, historical returns, performance analytics, rankings, research, platform availability, and news & insights. |
 |
||||||||||||||||||||||
| Microequities Pure Microcap Value Fund | ||||||||||||||||||||||
|
||||||||||||||||||||||
| View Profile | ||||||||||||||||||||||
 |
||||||||||||||||||||||
| Capital Group Multi-Sector Income Fund (AU) | ||||||||||||||||||||||
|
||||||||||||||||||||||
 |
||||||||||||||||||||||
| Revolution Wholesale Private Debt Fund II - Class B | ||||||||||||||||||||||
|
||||||||||||||||||||||
| View Profile | ||||||||||||||||||||||
 |
||||||||||||||||||||||
| Trovio Digital Asset Market Neutral Fund | ||||||||||||||||||||||
|
||||||||||||||||||||||
| View Profile | ||||||||||||||||||||||
|
Want to see more funds? |
||||||||||||||||||||||
|
Subscribe for full access to these funds and over 850 others |
