News

9 Oct 2024 - Trip Insights: LatAm (Part 1)

8 Oct 2024 - New Funds on Fundmonitors.com
|
New Funds on FundMonitors.com |
|
Below are some of the funds we've recently added to our database. Follow the links to view each fund's profile, where you'll have access to their offer documents, monthly reports, historical returns, performance analytics, rankings, research, platform availability, and news & insights. |
 |
||||||||||||||||||||||
| Dimensional Two-Year Sustainability Fixed Int. Trust AUD Class | ||||||||||||||||||||||
|
||||||||||||||||||||||
| View Profile | ||||||||||||||||||||||
| Dimensional World Allocation 70/30 Trust | ||||||||||||||||||||||
|
||||||||||||||||||||||
| View Profile | ||||||||||||||||||||||
| Dimensional World Allocation 30/70 Trust | ||||||||||||||||||||||
|
||||||||||||||||||||||
| Dimensional World Allocation 50/50 Trust | ||||||||||||||||||||||
|
||||||||||||||||||||||
| Dimensional Sustainability World Allocation 70/30 Trust | ||||||||||||||||||||||
|
||||||||||||||||||||||
| View Profile | ||||||||||||||||||||||
 |
||||||||||||||||||||||
| Magellan Core Global Fund | ||||||||||||||||||||||
|
||||||||||||||||||||||
| View Profile | ||||||||||||||||||||||
|
Want to see more funds? |
||||||||||||||||||||||
|
Subscribe for full access to these funds and over 850 others |

4 Oct 2024 - The Rate Debate - Ep51 The rest of the world is changing, so why aren't we?
|
The Rate Debate - Ep51 The rest of the world is changing, so why aren't we? Yarra Capital Management September 2024 The big question remains: will Australia follow the Fed's lead or stick to its current path? In Episode 51 of The Rate Debate, Co-Head of Fixed Income Darren Langer and Investment Manager Jessica Ren unpack the Fed's recent decision, explore the chances of rate cuts before Australia's next federal election, and debate the importance and reliability of employment data for the RBA. They also take a closer look at inflation pressures, from petrol prices and energy rebates to rising service costs. |
|
Funds operated by this manager: Yarra Australian Equities Fund, Yarra Emerging Leaders Fund, Yarra Enhanced Income Fund, Yarra Income Plus Fund |

3 Oct 2024 - Emerging Markets are offering one of the biggest opportunities in a lifetime
|
Emerging Markets are offering one of the biggest opportunities in a lifetime Ox Capital (Fidante Partners) September 2024 The term "BRICS" was coined in 2001, and it refers to a collection of developing countries - Brazil, Russia, India, China and South Africa. Since then, the BRICS nations' share of global GDP (based on purchasing power parity) has surpassed that of developed economies, contributing to over ~60% of global GDP. China for example, grew its share of world GDP (PPP) to ~19% from ~8% in 2001. While China's growth is more mature, many other emerging economies are poised to continue the economic catch-up, as these economies still have relatively low-income per capita levels, and growth is driven by sound economic policies. 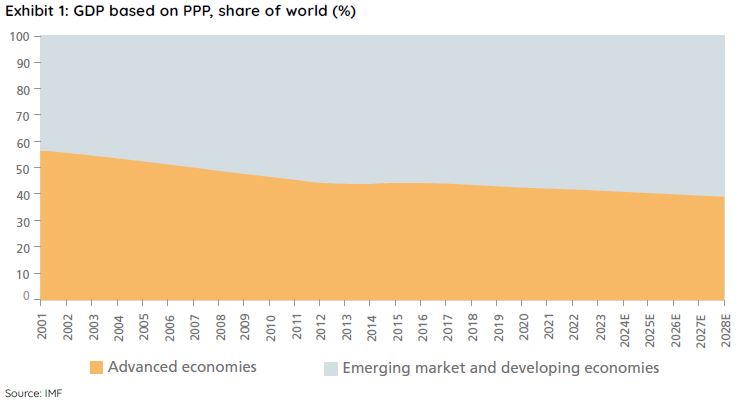 Notably, emerging markets equities are at a multi-decade low in price to earnings and price to book valuations compared to that of developed markets. It is an important fact given EM equities have historically outperformed developed market over the long-term. A general lack of interest has led to extraordinarily appealing valuations. We are looking at an attractive entry point with forward price to earnings multiples at depressed levels for quality companies with sustainable long-term growth and a backdrop supportive of outperformance. Moreover, many EM economies are undergoing continued economic development and political reforms. The economic fundamentals are much better than in prior years. Inflation is trending lower in many EMs allowing central banks to cut rates. A slowing developed markets economy is set to benefit emerging economies as we believe a slowdown in growth for the US will lead to interest rate cuts. Additionally, a declining US dollar and official interest rates are set to benefit emerging market equities. 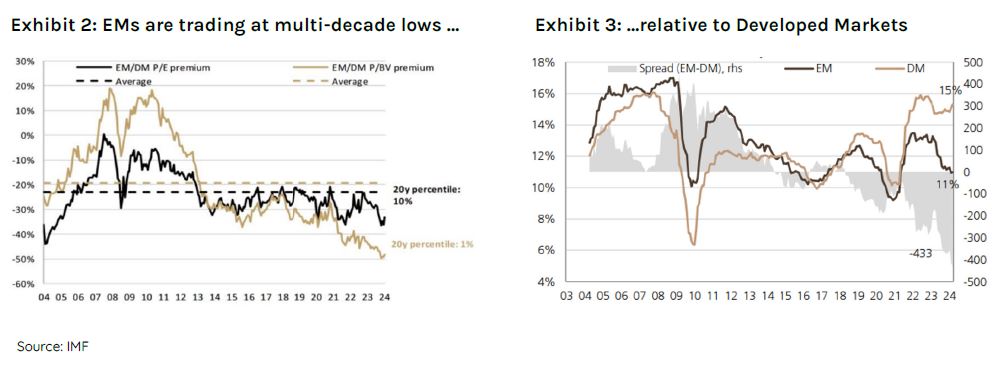 The recent period of underperformance for emerging markets, is an outlier in our view. EM economies were much more indebted and starting valuations were high over a decade ago. The present outlook is vastly different. Fiscal balances are healthy while debt to GDP ratios are at stable levels. Corporates are in a healthy position. Moreover, many EM regions are rich in key commodities for the upcoming Net Zero energy transition. We remain optimistic on emerging markets and believe the fundamentals are in place for EMs to outperform developed economies. Our proprietary quant model (the MOAT) is pointing to a very difficult environment for many developed markets into 2H2024 into 2025 including the US, versus an improving outlook for many EM countries, including China. Ox Capital is positioned now to benefit by investing in quality companies with sustained growth at attractive valuations across EM countries. In a volatile environment such as the one we are in; it is important to try to hedge the volatility. Ox has the capability to manage the portfolio dynamically that has reduced volatility in the past. Theme 1: A weaker USDThe US interest rate hikes by the central bank (Federal Reserve) has driven a stronger US Dollar. The recent strength of the "greenback" has been a headwind for emerging economies. This is logical as a stronger dollar can impact capital flows, trade, direct investment, and can impact credit growth. We believe the eventual decline in the USD will provide a tailwind for emerging market equities as returns are typically higher when the USD is declining in value. Historically, EMs outperformed the market by ~20% on average over the period since 2003. 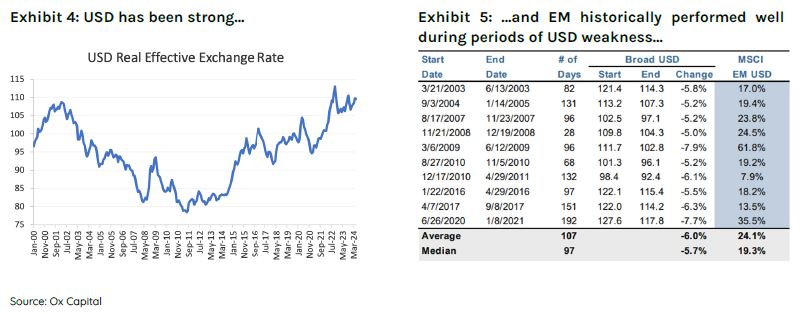 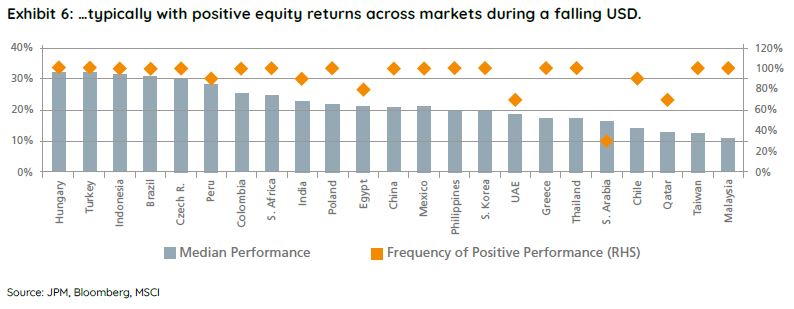 Theme 2: Rate CutsThe US federal funds rate has peaked and the FOMC is likely to cut rates as inflation moderates within its targets range. EM markets have historically performed well when the US cuts interest rate. Moreover, local central banks have been fiscally responsible. Many central banks have already started to cut official interest rates as inflation has trended back towards many central bank targets. Rate policy looks too restrictive, and cuts are likely to continue.  Theme 3: Supply chain reconfiguration and nearshoring.A reconfiguration of global supply chains will boost economic growth for a number of economies, especially nearshoring in ASEAN and LATAM, boosting GDP growth through foreign direct investments. Vietnam is a notable beneficiary of this trend. Greater foreign direct investment into an ever more open and market driven economy, with some of the most comprehensive free trade agreements in place globally, is providing strong employment opportunities for this young and vibrant country. As such, we believe this backdrop provides a foundation for alpha generating opportunities. 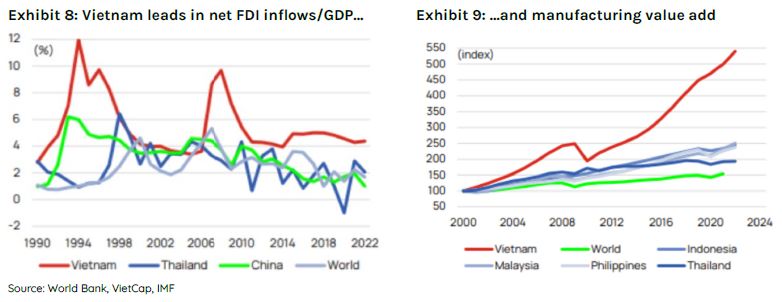 Moreover, nearshoring is a significant opportunity for the LATAM region in the coming years based on their geographical proximity to North America, and relatively cheap skilled labour. Nearshoring could add US$78 billion per annum in additional export revenue in LATAM in the coming years with Mexico being the primary beneficiary. Trade is especially important for Mexico. Mexico relies heavily on its industrial sectors for exports, with the manufacturing sector representing >80% total exports. Mexico's manufacturing sector has grown and matured over the years. Most recently, the top three export categories include auto-components, electronics, and machineries. Mexico is well placed with its long-established export capabilities to fulfil manufacturing orders for an increasing number of international companies. Mexico's relationship with the US is already well-established, as it is the largest exporter to the US. The country's ~15% share of US imports has now surpassed China's ~14%. 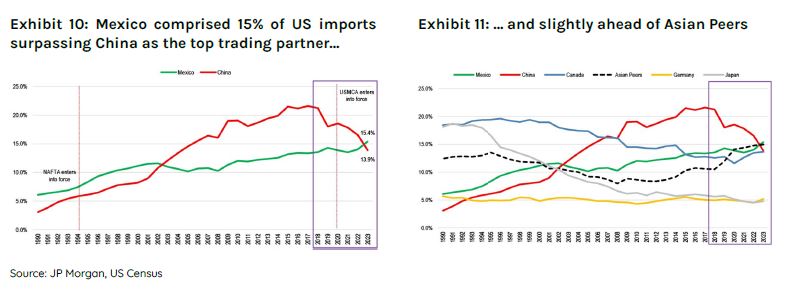 Growth in developed economies is expected to slow as rates have likely peaked. In contrast, despite recent economic challenges, the Chinese economy is expected to grow faster than the US, Japan, and Euro Area. Although China's growth is lower than in recent years, its economy is showing signs of bottoming, on the back of the Chinese authorities showing a willingness to stimulate and support the economy. Keep in mind that interest rates in China are low with minimal inflation relative to the rest of the developed world. A positive set up for equities in the year ahead. Moreover, Emerging countries make up the bulk of global growth, contributing to over ~60% of global GDP, but is under appreciated by global investors. Funds operated by this manager: Ox Capital Dynamic Emerging Markets Fund Important Information: This material has been prepared by Ox Capital Management Pty Ltd (Ox Cap) (ABN 60 648 887 914) Ox Cap is the holder of an Australian financial services license AFSL 533828 and is regulated under the laws of Australia. This document does not relate to any financial or investment product or service and does not constitute or form part of any offer to sell, or any solicitation of any offer to subscribe or interests and the information provided is intended to be general in nature only. This should not form the basis of, or be relied upon for the purpose of, any investment decision. This document is not available to retail investors as defined under local laws. This document has been prepared without taking into account any person's objectives, financial situation or needs. Any person receiving the information in this document should consider the appropriaten |

2 Oct 2024 - Why the coming downturn is good for credit investors
|
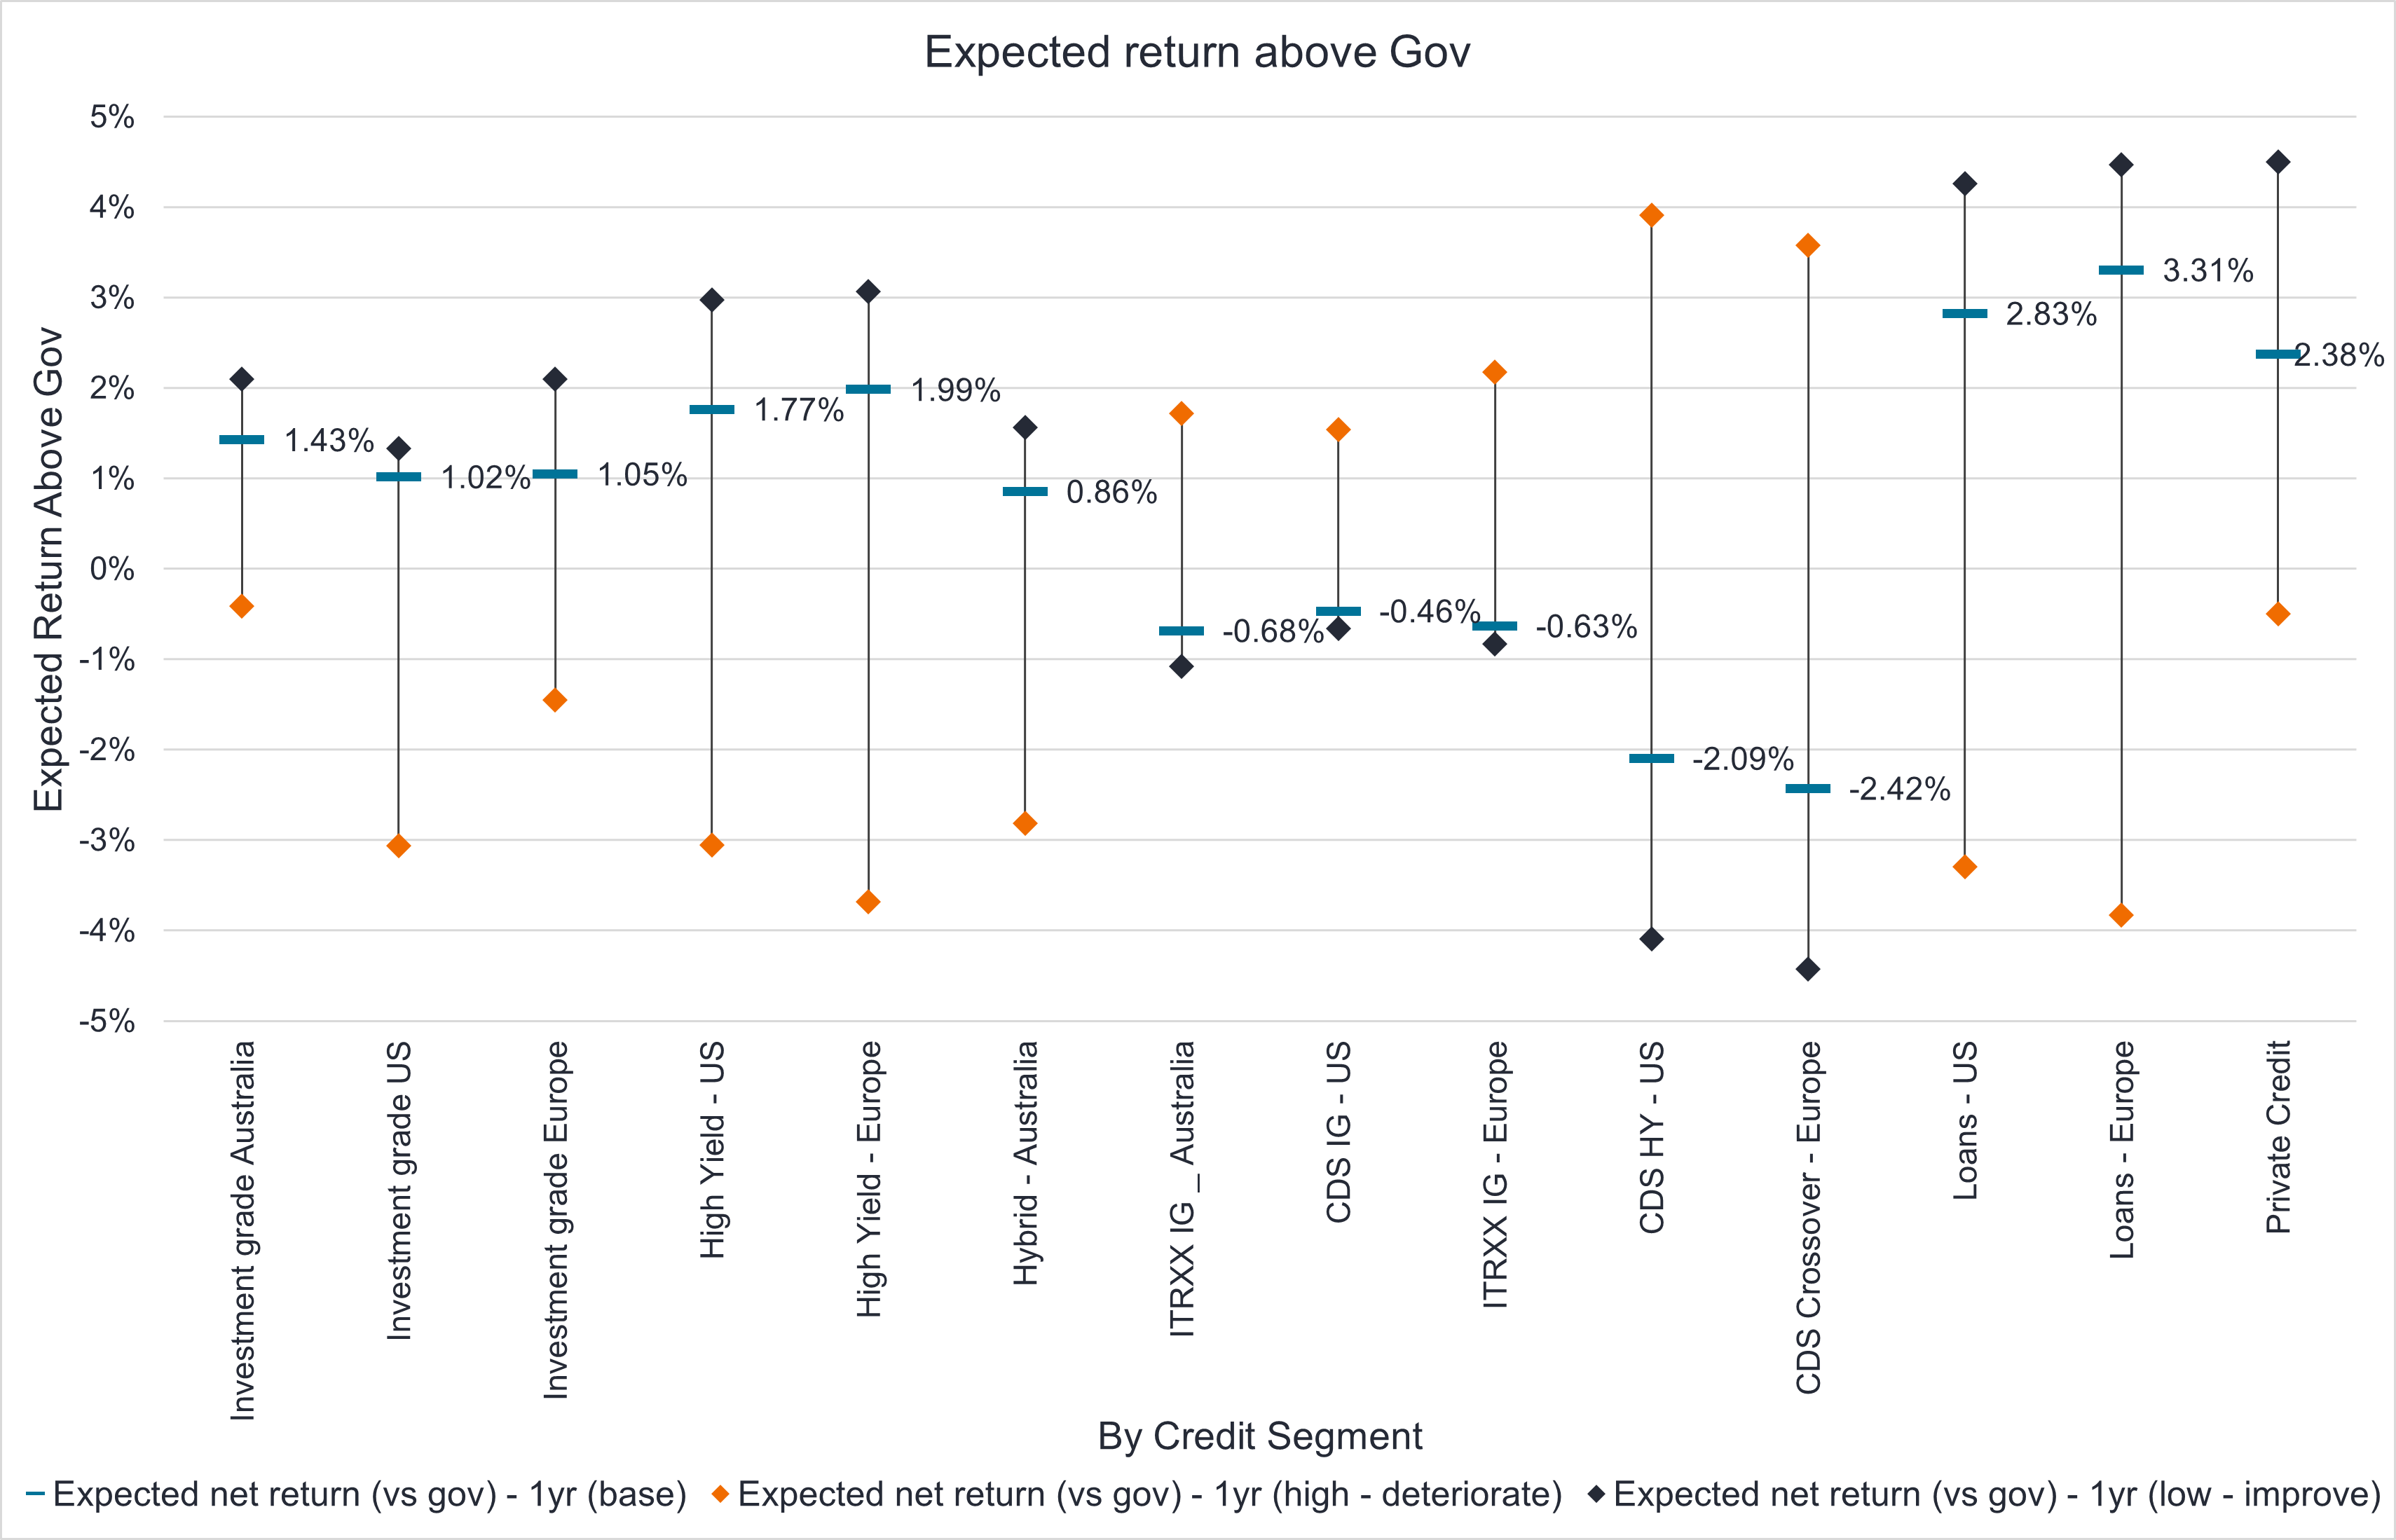
Why the coming downturn is good for credit investors Janus Henderson Investors September 2024 Jay Sivapalan, Head of Australian Fixed Interest, discusses the current state of credit markets and explores how active management strategies, mixed with nuanced credit investing, can lead to positive returns for investors. As monetary policy works its way through various economies reducing final demand it has, by design, the dual outcomes of softening labour markets and lowering corporate profitability. The world has changed, and the price of money, in our view, is now at much healthier levels whilst the availability of credit becomes more discerning. Funding costs for corporates have normalised, not just from the abnormally easy conditions during the pandemic, but also versus the decade of cheap money between the Global Financial Crisis and the pandemic. For investors, the late stage of this economic cycle has arrived and this brings the normal advent of rising delinquencies, re-structures and defaults. Whilst ordinarily this phase of the cycle would spell caution for investors, we believe ultimately it is a healthy development and that taking a nuanced approach to credit investing will likely deliver investors strong risk adjusted returns over the period ahead. Key considerations for investors include:
Starting point mattersAs the economic and business cycle nears the latter stages, any slowdown in economic growth, softening of labour markets will inevitably impact corporate earnings adversely. This cycle will be no different. However, the starting point is worth assessing for different segments of the corporate debt market. To provide some context, corporates in Australia and abroad were healthy, making adequate profits prior to the pandemic. During the pandemic, these very companies shifted upward to making abnormally high profits, aided by both monetary and fiscal policy as well as a resumption of demand. Inflation on nominal revenues also assisted the larger, stronger companies in gaining market share and achieving margin expansion. Meanwhile, highly-levered consumer cyclical and small-medium enterprise (SME) segment survived and in some cases temporarily thrived during the pandemic. However, this segment was never fundamentally strong nor sustainable and is now facing the reality of falling demand and higher funding costs. A different cycleFor the most part investment grade companies today remain well funded with debt termed out and highly profitable. From a fundamentals perspective, they remain relatively resilient to an economic growth slowdown. We see profits as moderating rather than falling precipitously. The same cannot necessarily be said for the SME segment. Nor for highly leveraged and/or cyclical, consumer centric businesses. A default cycle has commenced in loans, and pockets of high yield and private credit across the globe. Domestically this was most visible in SME delinquencies. It was initially centred around the property construction sector, but is now widening to hospitality, domestic tourism, recreational goods and services, and other consumer segments. Business models reliant on ongoing cheap debt or easy re-financing with little or no revenue is in the grips of a reality check, likely with harsh ramifications. A nuanced approach to credit investingNot all default cycles end in a crisis for credit markets. This cycle would suggest that defaults in investment grade companies should remain quite low by historical standards, but may be elevated in higher yielding segments. Importantly, rather than a uniform spike of defaults, we are more likely to see a rotation of defaults from industry to industry within lower quality credit. This will, in turn, keep the default rate rolling over multiple years. Recovery rates in these lower quality segments are being realised at lower levels than the past. Of course, market dislocations can occur with concerns around defaults lower down in credit markets, and cause mark to market underperformance in higher quality credit segments. We would assess these events as opportunities to add to investment grade credit without fear, rather than one to be cautious about. Outsized credit returns availableOverall, higher quality credit in the investment grade space remains the sweet spot for delivering healthy yields. However, to assess relative value, the sticker yields of lower credit quality, higher yielding segments need to be adjusted down for defaults and loss. The relative value of higher beta segments of the credit market currently remains less compelling in our assessment but a widening of credit spreads in this area would be valuable entry points for investors.
With the exception of a left field event, the most probable scenario points to strong prospective relative performance of credit, with investment grade credit being the sweet spot for investors on a risk adjusted basis. For the brave, the loans segment is potentially shaping up to be an opportunity, albeit security selection will be critical given the expected higher defaults and lower recoveries. A beta exposure is not recommended. Cheap ways to invest in credit and hedge tail risksTail ends of economic and market cycles have always been volatile, with investors seeking duration, quality risk-free assets and high compensation for default risk. Liquidity can also become fleeting in an environment of uncertainly. In order to preserve capital and also extract good returns in this environment, one must not passively sit on the sidelines; this is the wrong part of the cycle to be beholden to benchmarks. To ensure portfolios retain their defensive attributes, levers such as active management of duration, yield curve positioning and credit protection through the Credit Default Swap (CDS) market can be invaluable. We are confident dislocations will occur and opportunities will emerge. Again, actively utilising the full spectrum of inflation linked bonds, bond/swap and bond/semi-government spreads, corporate and asset backed betas (such as global loans, high yield and emerging market debt) can further drive return outcomes. Individual industry positioning will become important if markets dislocate more meaningfully. Today, both CDS protection and duration are cheap and effective tools that can be relied upon whilst fully utilising the prospective value in investment grade credit. We assess this as a great way for investors to enhance overall portfolio outcomes on a risk adjusted basis. Author: Jay Sivapalan, CFA |
|
Funds operated by this manager: Janus Henderson Australian Fixed Interest Fund, Janus Henderson Australian Fixed Interest Fund - Institutional, Janus Henderson Cash Fund - Institutional, Janus Henderson Conservative Fixed Interest Fund, Janus Henderson Conservative Fixed Interest Fund - Institutional, Janus Henderson Diversified Credit Fund, Janus Henderson Global Equity Income Fund, Janus Henderson Global Multi-Strategy Fund, Janus Henderson Global Natural Resources Fund, Janus Henderson Tactical Income Fund This information is issued by Janus Henderson Investors (Australia) Institutional Funds Management Limited (AFSL 444266, ABN 16 165 119 531). The information herein shall not in any way constitute advice or an invitation to invest. It is solely for information purposes and subject to change without notice. This information does not purport to be a comprehensive statement or description of any markets or securities referred to within. Any references to individual securities do not constitute a securities recommendation. Past performance is not indicative of future performance. The value of an investment and the income from it can fall as well as rise and you may not get back the amount originally invested. Whilst Janus Henderson Investors (Australia) Institutional Funds Management Limited believe that the information is correct at the date of this document, no warranty or representation is given to this effect and no responsibility can be accepted by Janus Henderson Investors (Australia) Institutional Funds Management Limited to any end users for any action taken on the basis of this information. All opinions and estimates in this information are subject to change without notice and are the views of the author at the time of publication. Janus Henderson Investors (Australia) Institutional Funds Management Limited is not under any obligation to update this information to the extent that it is or becomes out of date or incorrect. |

1 Oct 2024 - 10k Words | September 2024
|
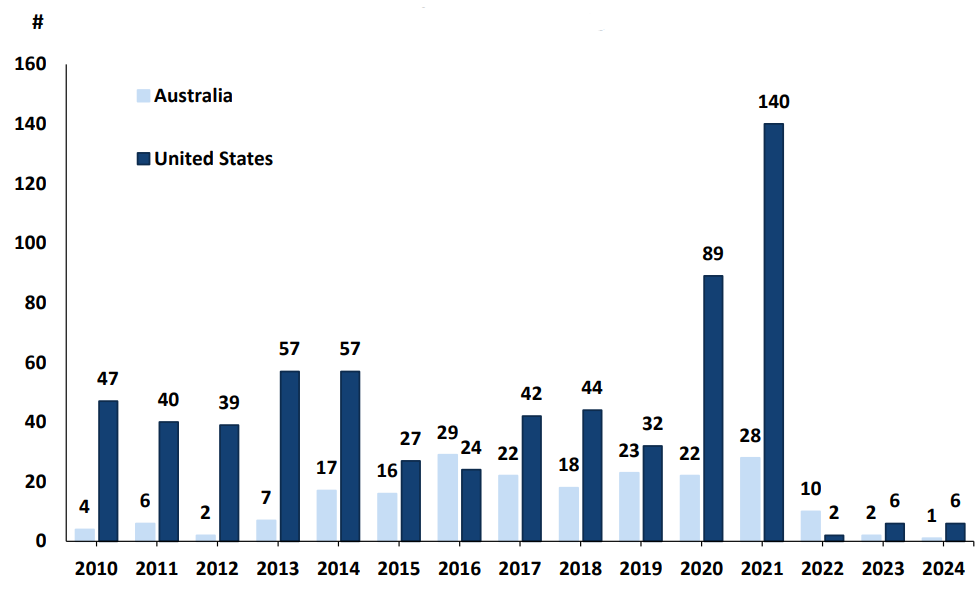
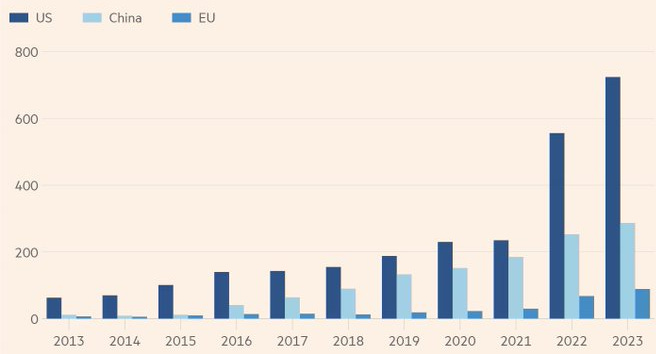
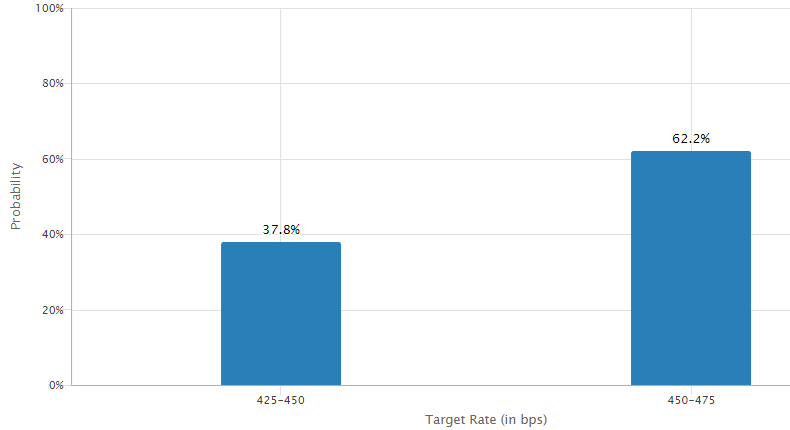
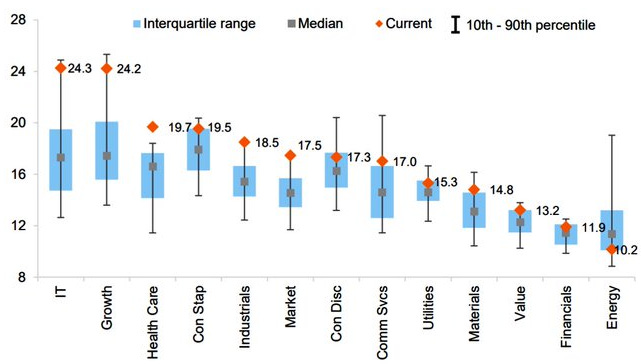
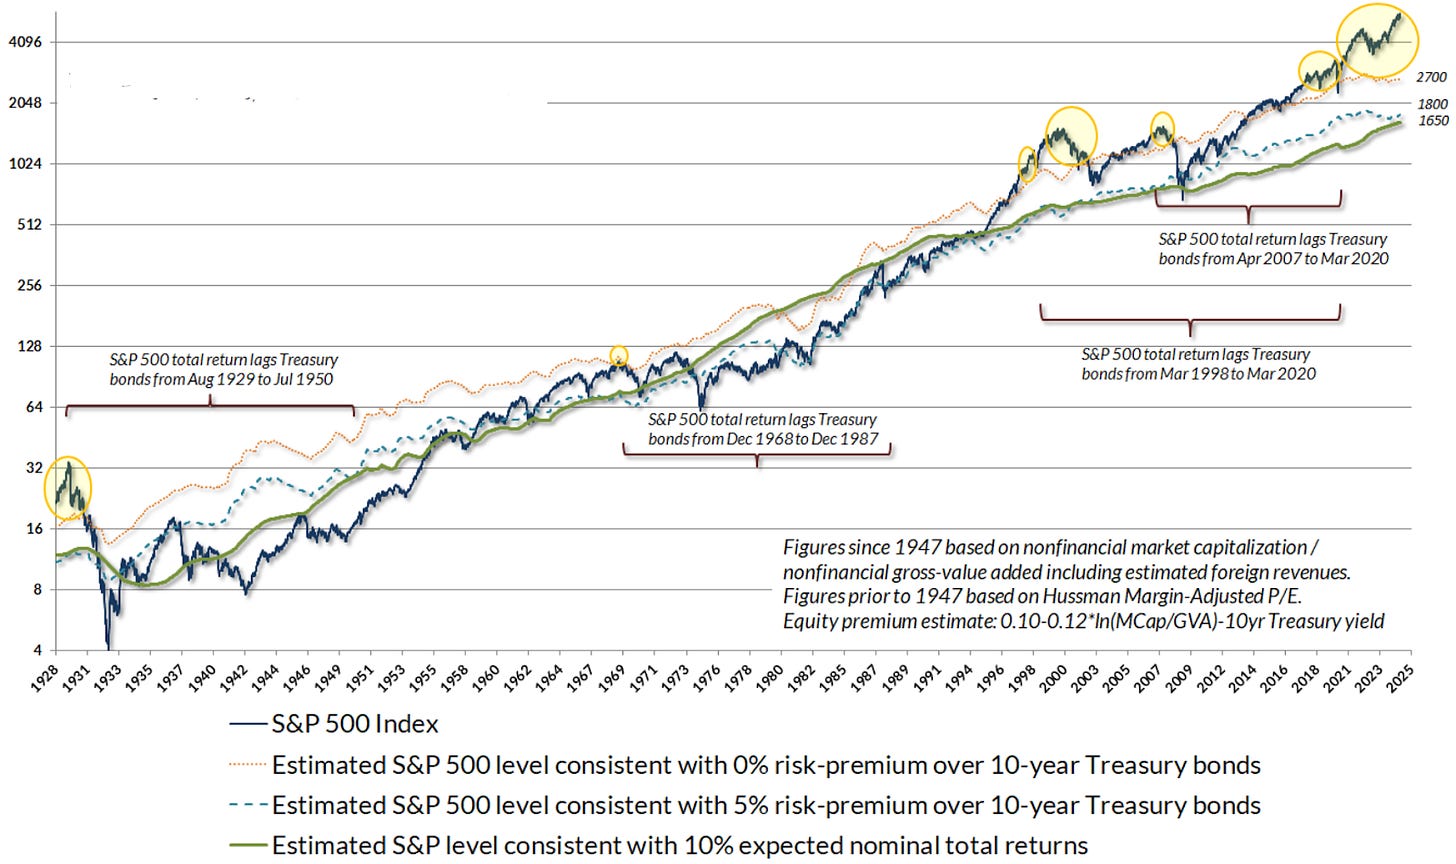
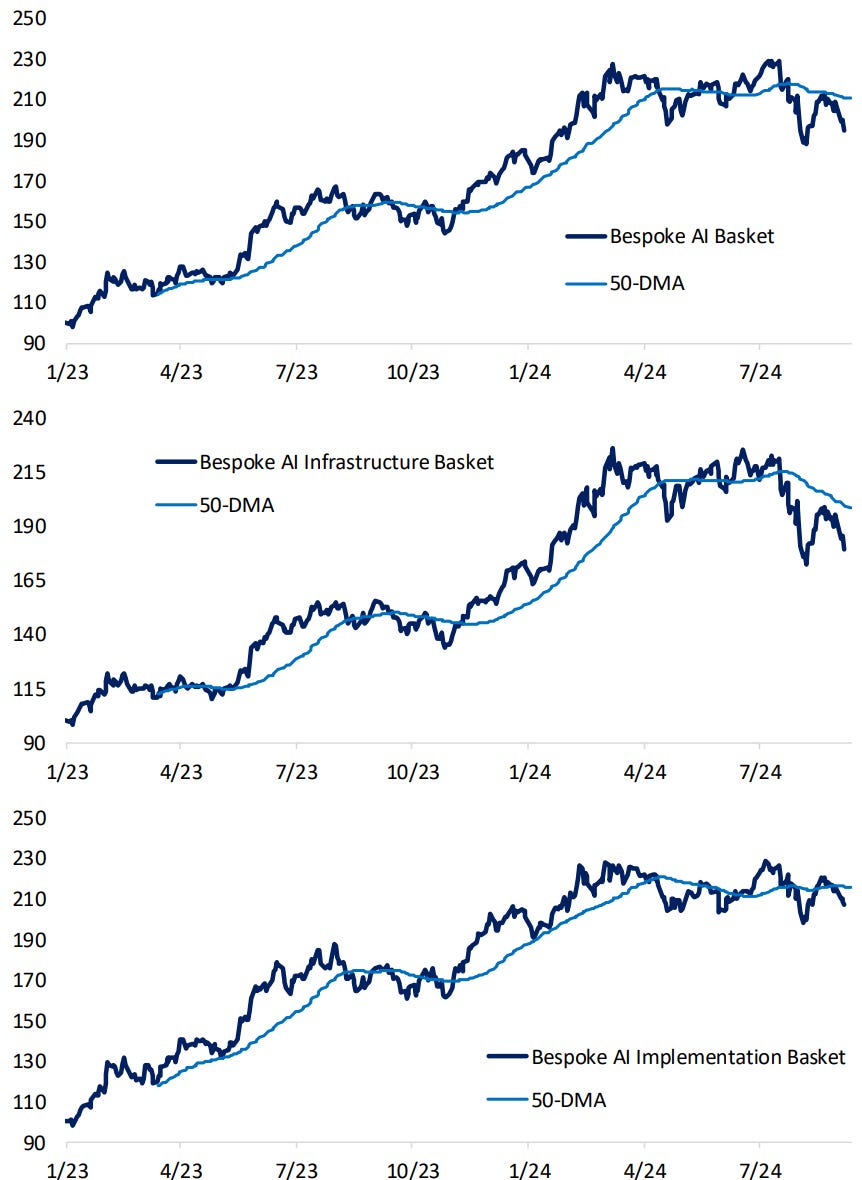
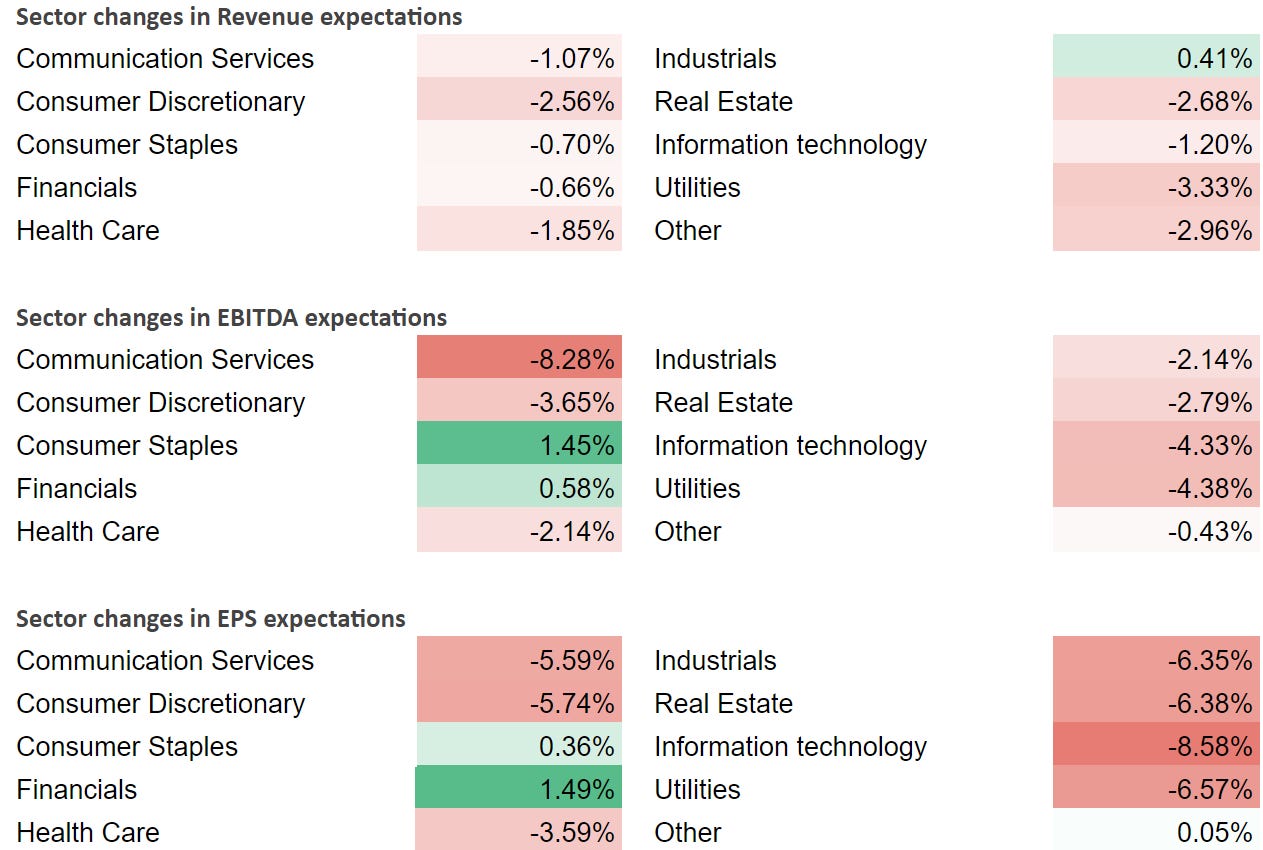
10k Words Equitable Investors September 2024 Tech IPOs - there have been very few of them lately - but the unlisted world is bursting with "unicorns". Now that the Fed has cut rates in September, what's next? The market is not only oscillating around interest rate expectations but is also exhibiting volatility in the short time between the rate cut announcement and the press conference. We check in on PE multiples relative to historical levels by geography and sector, consider market moves in relation to risk premiums, then the performance of "AI" stocks. Finally we turn to the ASX's recent reporting season and look at the average sector-based consenus revisions to nano-to-mid caps plus the stream of dividends flowing into investors' accounts this month and next. Technology IPOs
Source: Dealogic, PAC Partners The number of active unicorns
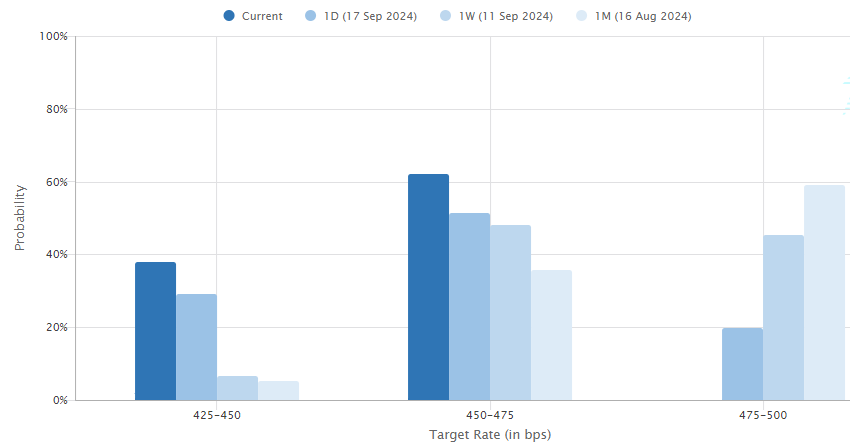
Source: FT, PitchBook, European Commission US Fed rate expectations for the Fed's November meeting
Source: CME FedWatch Changes in time to US Fed rate expectations for the Fed's November meeting
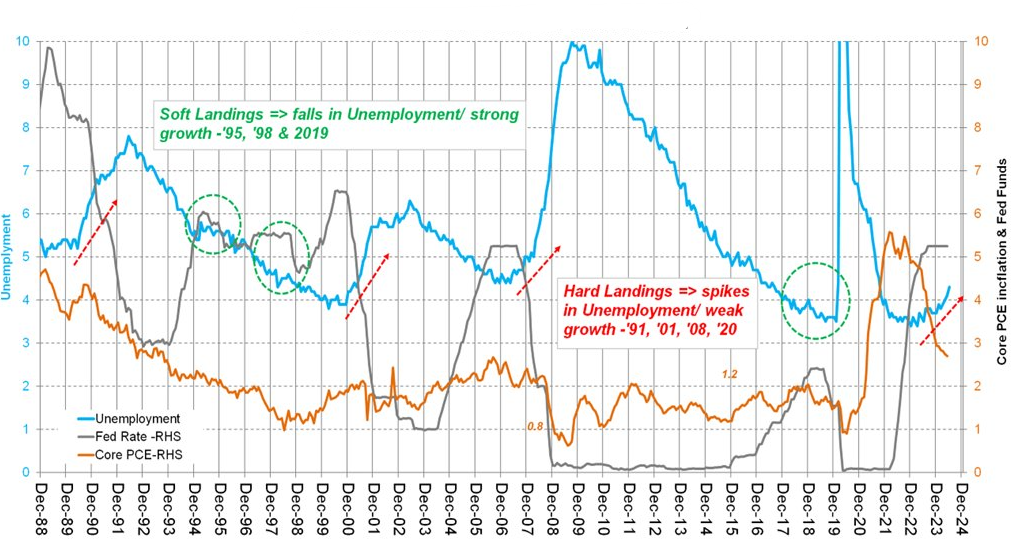
Source: CME FedWatch Fed cuts, employment & inflation
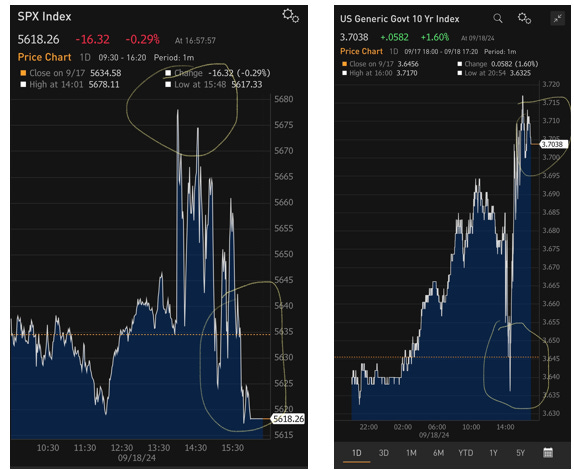
Source: Endeavour Equity Strategy US equity and bond markets change direction between release of FOMC statement and Fed Chair press conference
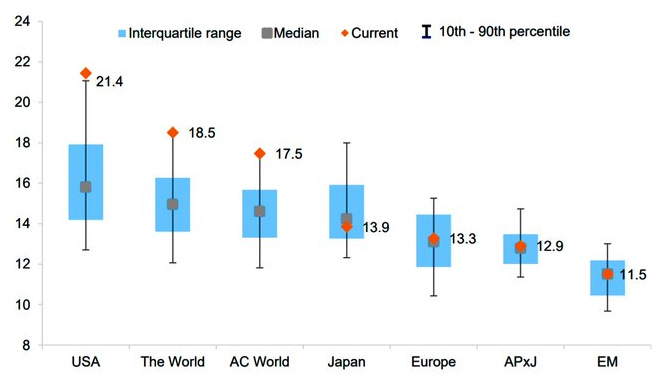
Source: Mohamed A El-Erian, Bloomberg MSCI regions' 12-month forward PE multiples relative to the last 20 years
Source: Goldman Sachs Investment Resesarch MSCI world sector/style 12-month forward PE multiples relative to the last 20 years
Source: Goldman Sachs Investment Resesarch S&P 500 actual v level consistent with expected return range
Source: Hussman Strategic Advisors Artificial Intelligence (AI) US equity baskets since 2023
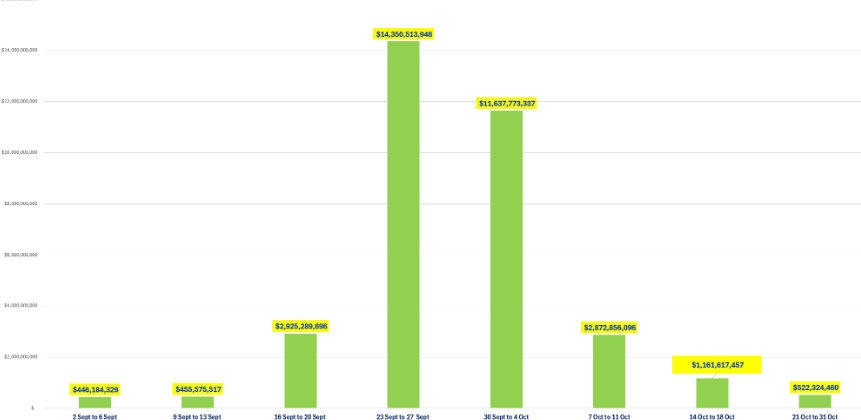
Source: Bespoke Changes in consensus estimates - average across sector - during month of August for ASX "FIT" nano-to-mid cap ASX listings Source: Equitable Investors, Koyfin Weekly value of all ASX dividends to be paid in September & October 2024 Source: Coppo Report September 2024 Edition Funds operated by this manager: Equitable Investors Dragonfly Fund Disclaimer Past performance is not a reliable indicator of future performance. Fund returns are quoted net of all fees, expenses and accrued performance fees. Delivery of this report to a recipient should not be relied on as a representation that there has been no change since the preparation date in the affairs or financial condition of the Fund or the Trustee; or that the information contained in this report remains accurate or complete at any time after the preparation date. Equitable Investors Pty Ltd (EI) does not guarantee or make any representation or warranty as to the accuracy or completeness of the information in this report. To the extent permitted by law, EI disclaims all liability that may otherwise arise due to any information in this report being inaccurate or information being omitted. This report does not take into account the particular investment objectives, financial situation and needs of potential investors. Before making a decision to invest in the Fund the recipient should obtain professional advice. This report does not purport to contain all the information that the recipient may require to evaluate a possible investment in the Fund. The recipient should conduct their own independent analysis of the Fund and refer to the current Information Memorandum, which is available from EI. |

30 Sep 2024 - New Funds on Fundmonitors.com
|
New Funds on FundMonitors.com |
|
Below are some of the funds we've recently added to our database. Follow the links to view each fund's profile, where you'll have access to their offer documents, monthly reports, historical returns, performance analytics, rankings, research, platform availability, and news & insights. |
 |
||||||||||||||||||||||
| Dimensional Australian Core Equity Trust - Active ETF | ||||||||||||||||||||||
|
||||||||||||||||||||||
| View Profile | ||||||||||||||||||||||
| Dimensional Five-Year Diversified Fixed Int. Trust AUD Class | ||||||||||||||||||||||
|
||||||||||||||||||||||
| View Profile | ||||||||||||||||||||||
| Dimensional Global Bond Sustainability Trust AUD Class | ||||||||||||||||||||||
|
||||||||||||||||||||||
| Dimensional Global Bond Trust AUD Class | ||||||||||||||||||||||
|
||||||||||||||||||||||
| Dimensional Short Term Fixed Interest Trust | ||||||||||||||||||||||
|
||||||||||||||||||||||
| View Profile | ||||||||||||||||||||||
 |
||||||||||||||||||||||
| Solaris Australian Equity Income Fund | ||||||||||||||||||||||
|
||||||||||||||||||||||
| View Profile | ||||||||||||||||||||||
|
Want to see more funds? |
||||||||||||||||||||||
|
Subscribe for full access to these funds and over 850 others |

27 Sep 2024 - Change as the only constant: investing in a world in transition
|
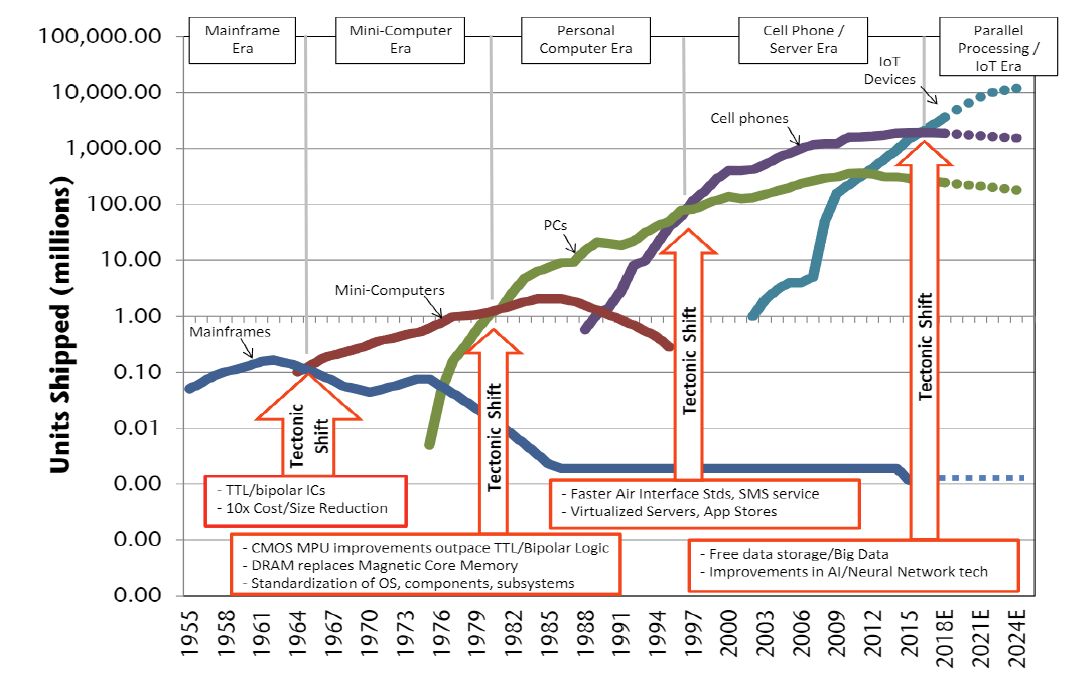
Change as the only constant: investing in a world in transition Nikko Asset Management August 2024 Q1: Does the AI investment theme still offer significant long-term potential?When we are confronted with truly significant change, we can often react in ways that are not entirely rational. If the change represents a perceived threat, our fight or flight response can be triggered, leading us to resist the change or ignore it in the hope that it might go away. While there are clearly risks, resisting the opportunities presented by artificial intelligence (AI) and ignoring its development would seem to be dangerous for investors. Bill Gates has been quoted as saying that the impact of new technologies is often overestimated on a two year view but greatly underestimated over time periods of ten years or more. When we view technological development in its long-term context, the change it represents can become less overwhelming and we can see patterns from history which might give us a clue as to where we stand today, what might happen next and who the big winners might be. It should be fairly obvious to investors today that we are in the middle of a very strong, AI-driven cycle for IT hardware as the infrastructure for an AI based platform of computing is being developed at a rapid pace. Yet, obvious questions remain, such as "how long will this last?" and "are we once again overestimating the short-term significance and underestimating the long term impact?" To put this in context, it might be useful to look at previous hardware cycles and their characteristics as the various computing platforms have evolved over the last 60 years or so. Chart 1: The evolution of computing platforms
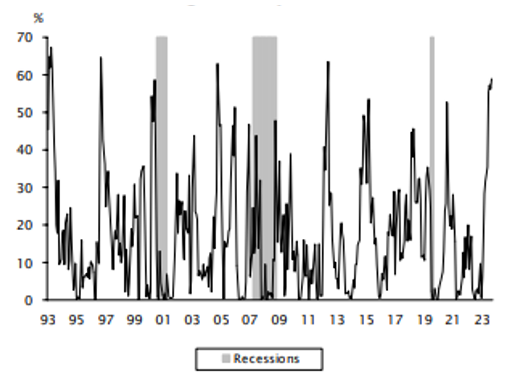
Source: Jeffries Equity Research Chart 1 above shows the evolution of computing platforms since the 1950s. We can see that each era lasts around 10 to 15 years and with each passing cycle, the number of devices connected to the network has increased tenfold. As a result, technology has penetrated more and more industries and been applied to more and more aspects of everyday life. What is less clear from the chart is that in each era, there has been one or two companies that have typically captured 80% or more of the hardware value chain. IBM in the mainframe era, DEC in mini-computers, Microsoft /Intel in PCs, Nokia and then Apple in cell phones and so far Nvidia in the parallel processing/IoT era powered by an AI datacentre at its core. It's probably fair to assume that we are likely in the early stages of the AI-related infrastructure build, perhaps at a point equivalent to the mid-1990s when the internet was still being constructed. While this rapid growth phase for hardware is likely to slow down, there is still a long runway of adoption to go if prior cycles are any guide. One significant difference between the AI infrastructure boom and the growth in fixed and mobile internet infrastructure is the fact that the internet rollout was largely financed by debt raised by telecom companies and IPOs raised by often loss-making early stage companies. Today's AI infrastructure, however, is being built using cash flows from large and very profitable businesses. This factor alone may give the hardware cycle more longevity than its predecessors. In terms of applications and profitable use cases for AI, it appears that we are in a position similar to the mid-to-late 1990s when the internet was being developed. Back then, we expected navigation, entertainment and e-commerce would likely become the main applications for the internet. It took a further decade for the smartphone to reach the mass market and fully enable the potential of the network, allowing companies like Apple, Meta Platforms, Alphabet, Amazon and others to flourish. AI may yet be applied to new industries and revolutionise the competitive landscapes therein. Drug discovery, self-driving cars, media content production and software code writing could all become the main applications for AI in the longer term. However, it is too early to make definitive predictions. The emerging risk of a classic hype cycle seems fairly clear. If profitable use cases are not delivered soon enough, this may slow the infrastructure boom. This was certainly the case in the late 1990s early 2000s. However, back then the internet infrastructure collapsed under an unsustainable mountain of debt, which was paid out in the form of expensive 3G licences. During this period, Apple disrupted the telecom value chain with the power of iTunes and then the smartphone. This time, the spending is funded by cash flow and earnings, and while it may slow down, it seems unlikely to collapse any time soon. In conclusion, the impact of AI clearly has the scope to be far-reaching and is likely a factor investors will have to contend with for a long time to come. Q2: Will the market leadership broaden beyond technology names into other sectors?The possibility of stock market leadership broadening beyond technology names and into other sectors, in our view, depends on several factors. These include economic conditions, the level of real rates, sector-specific earnings, cash flow developments and investor sentiment. In general, market leadership so far in 2024 has been driven by upgrades in earnings and cashflow. Five mega-cap AI stocks--Nvidia, Alphabet, Amazon, Meta and Microsoft--have accounted for almost all of the market's return. However, value stocks in areas such as energy, banking and insurance have also performed well, while defensives such as consumer staples and healthcare have largely underperformed. The market seems to be assuming that we are in the middle of a business cycle of indeterminate length--all underpinned by a gradual disinflationary environment. It is only natural to question if this is a fair assessment. Does it all add up? How should we construct portfolios in this environment? So far in 2024, changes in earnings have had a greater influence on the market than changes in real interest rates (Chart 2). The chart shows how much of the returns can be explained by changes in earnings. Rather ominously, similarly high readings were seen just before major market events, such as the Asian financial crisis of 1998, the dot.com bust of 2000, and arguably, the Global Financial Crisis (GFC) of 2007/2008 and the European debt crisis of 2012. Chart 2: Proportion of S&P 500's large-cap stock returns attributable to changes in earnings
Large capitalisation stocks' share of the return dispersion explained by the dispersion in earnings surprise measured over nine-month windows from 1993 through mid-May 2024. Past performance is not indicative of future performance. Source: Empirical Research Partners Naturally, investors are wondering if there is something equally damaging around the corner which may cause this benign central scenario to unravel. If we examine each factor, listed below, we may be able to draw some conclusions.
Q3: What are the main risks and challenges equity investors may face in the remainder of 2024?Whether it's about the level of the CPI, the direction of economic growth, credit quality in the consumer and corporate sector, the housing market, supply of USTs, elections, geopolitics or even an outright stock market bubble, the list of investor worries and concerns seems as long as one can remember. Yet the market continues to push higher. Are we headed for a fall or are we in an economic sweet spot with moderate growth and declining inflation that could go on for some time? Like any journey, to really understand the benefits of the destination, we should also understand our starting point. Taking a long-term view makes this a little more straightforward and likely helps us draw some better insights, given the myriad of potential outcomes which exist in the short-term. The last 15 years have been characterised by unprecedented fiscal and monetary stimulus to keep the cost of money low following the GFC and more recently to support economies during the pandemic. The low cost of capital reached a pinnacle in a 2021 stock market bubble of money-losing growth stocks, which burst spectacularly as the cost of money increased. The next 15 years seem unlikely to be a repeat of the last 15, with the direction of real rates being the primary concern for investors. Our best guess is that we are now faced with a sustainably higher cost of capital than the abnormally low level we witnessed following the GFC. A number of factors contribute to this, including (but not limited to) the high forthcoming supply of government debt to fund a burgeoning fiscal deficit, the impact of geopolitics on trade restrictions and the inflationary implications of the energy transition. If real rates are indeed set to rise over the next decade or so, this will have implications for stock picking as immediate profits become more valuable to investors than the hope of potential profit a decade from now. This might explain why the companies in the market related to the AI theme are performing so well, as they are also experiencing sharp increases in earnings and cash flow. This contrasts sharply with long-duration growth stocks, which continue to lag the market as the anticipated earnings for 2035 or beyond remain just that--hope. Yet, perhaps the biggest risk to investors with time horizons of 10 years or more is missing out on the opportunities a well-diversified portfolio of global equities can offer. As a smart investor once said, "time in the market is far more important than timing the market". This seems as true today as ever. We are on the verge of a further breakthrough in productivity, enabled by the ongoing evolution of computing platforms, and we stand ready to tackle arguably the most pressing challenge in human history--climate change. Throughout history, equity investors have benefitted from maintaining a long-term view and an optimistic outlook on humanity's ability to prevail in the face of adversity. This might once again be the case, meaning that the biggest risk might be not having exposure to the highest quality earnings streams through a diversified portfolio of global equities. Perhaps we have already mentioned that we know professionals who can be of assistance in such matters.
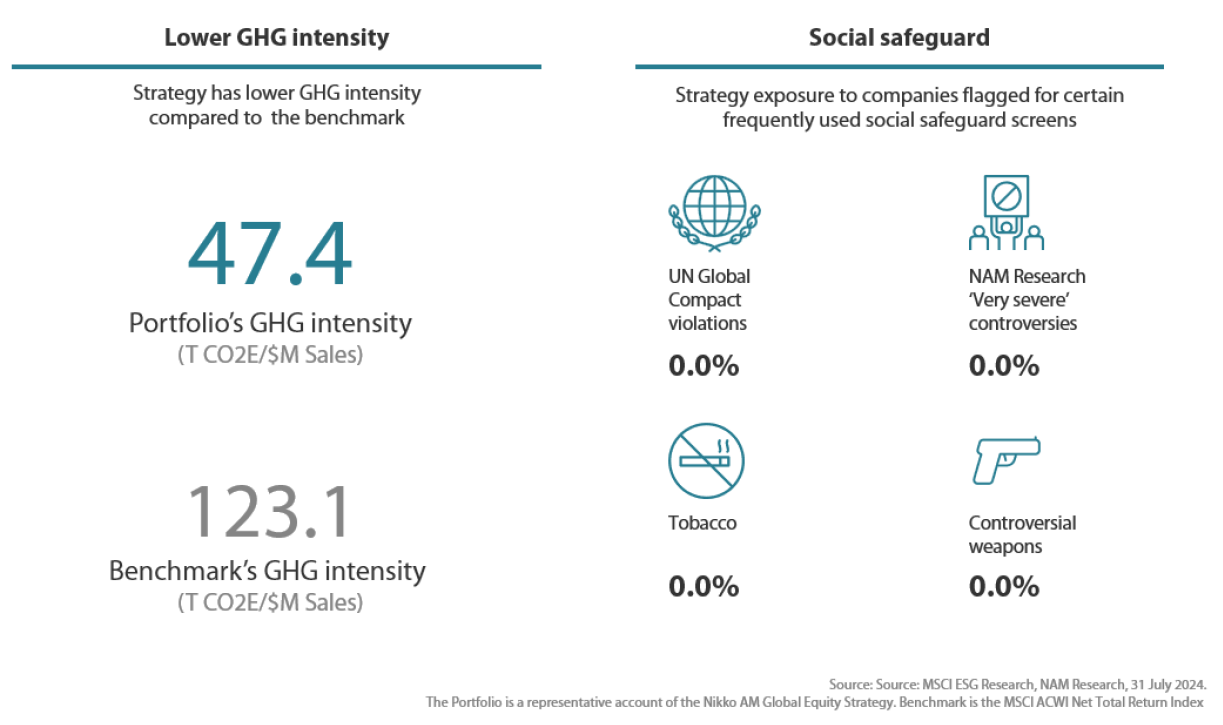
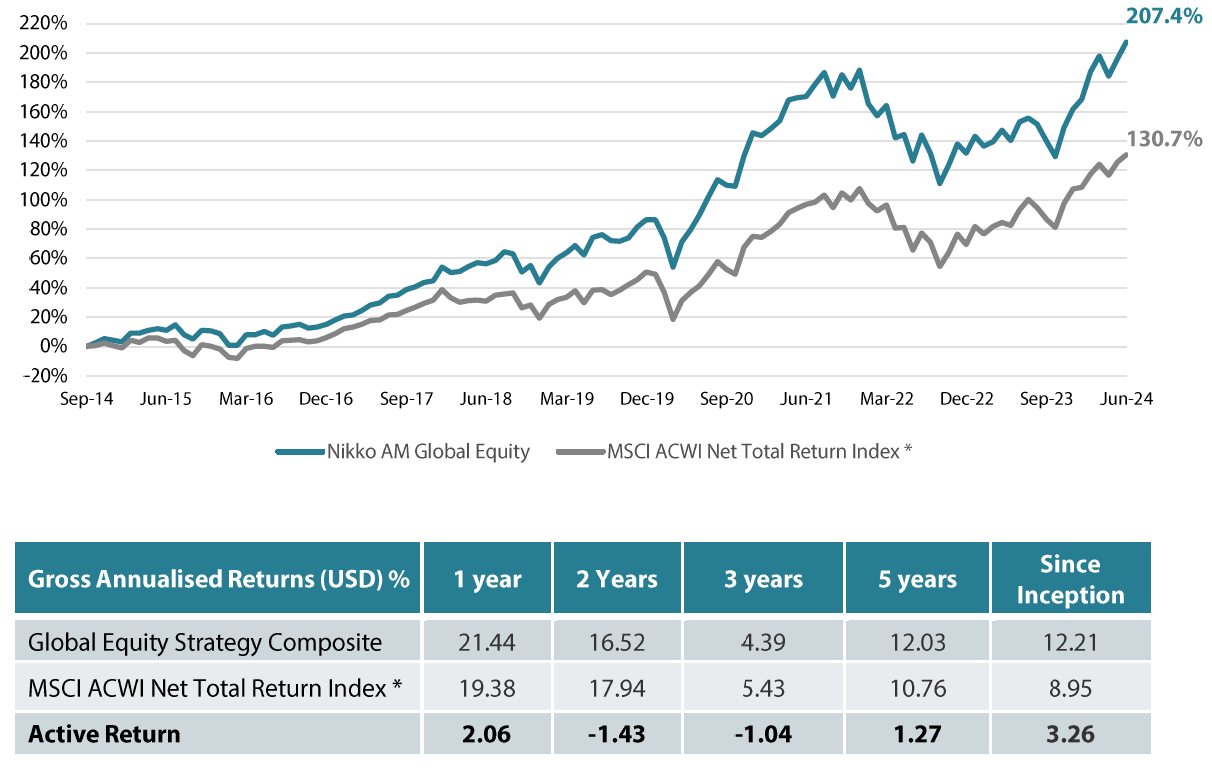
Global Equity strategy composite performance to June 2024 |

26 Sep 2024 - Stop Losses You Can Actually Use
|
Stop Losses You Can Actually Use Marcus Today September 2024 |
The Reality of Stop LossesStop losses are a discipline that allows you to let your profits run and cut losses. But as anyone who has started using stop losses for the first time will tell you, you get the logic. You think it's a good idea, you start out with the best intentions, but after selling a few stocks that immediately bounce, or selling what you consider to be long-term investments in the short term, only to see them continue to trend up in the long term, you lose your resolve.The reality is that stop losses will involve getting stopped out of some share prices that then immediately shoot up. It's inevitable. Sometimes. And those are the ones you remember, and those are the ones you tell everyone about.Stop losses are not a golden bullet, they are a discipline, and sometimes, you do need a sense of humour. The art of it is to not care about things that happen after you have sold. Regret is not going to help you in your mission to make as much money as possible in anything that has a price over any timeframe.How to Use Stop LossesThe best use of stop losses is not as an instruction but as an alarm bell to unemotionally point out that a trend has changed against you. They can be used by any investor on any timescale, even long-term value investors and wealthy people with large individual stock positions. It's a tap on the back of the head that says, "Have you spotted this? What are you going to do about it?" How many times are you going to ignore the fact that you are now losing money, and it's trending against you?As we discussed in the initial stop loss article, stops can be set in many different ways. They include technical and mathematical stop losses like a dollar-based stop loss and profit stop, a set percentage stop loss, a trailing stop loss, a chart-based stop loss, a volatility-based stop loss, and a percentage of capital stop loss.The Truth About Stop LossesBut there is more to stop losses than that. Yes, you can invent and monitor complex formulas that purport to spit out the perfect stop loss price, but the truth is that only a small part of the value of using stop losses is delivered by using the right price. Most of the value comes from the fact that you had a stop loss at all.There is no 'correct' stop loss. Stop losses are not some finely tuned method of achieving an exact outcome. Their primary purpose is to avoid a mega-loss that you can't afford to have. They are a loss-stopping mechanism, and for the constipated, procrastinating investor who habitually lets their losses run, it is more important to do it than to do it perfectly. There is no perfectly.Alternative Stop LossesSo for those of you who are not mathematically minded and don't want to engage with arithmetic, here are a few other less calculated stop losses that you might be interested in employing. These stop loss methods include most of the value of a stop loss--strategies that are more 'real life' and don't require a calculator. 1. The Holiday Stop Loss Sell everything before you go on holiday. Nothing is worse than a ruined holiday because you're fretting about some dumb stock position. When you have your head in the stock market all day, every day, a holiday isn't a holiday unless you get it out. 2. The Insomnia Stop Loss Sell anything that could possibly, or does, keep you awake. Anything that is disturbing you. You need to put a high value on your frame of mind, and with a finite number of days left to live, you can't afford to waste time being miserable, especially not about money. Anything that's making your life miserable has to go. If in doubt, get out. 3. The Objectivity Stop Loss When things are about as bad as they can get, you need objectivity, which means you need to talk to someone. Use someone else as your stop loss. If in doubt, discuss it with others. And if you can't tell your partner, sell. 4. The Punching the Air Stop Loss This is an old broker's saying: sell anything that provokes you to stand up at your desk and punch the air in delight. Any stockbroker will tell you, euphoria means "Sell". It means a price has exceeded your expectations, and asking for more is simply greedy. You have to book the wins sometime. This is as good a moment as any. 5. The Denial Stop Loss Sell anything you've got wrong. Making money by predicting share prices is not a science. You cannot pin down certainty. There are so many variables and so much sentiment in stock decisions that getting it wrong is to be expected--it's inevitable. When you do get it wrong, you have to act, not deny. There is no room for pride in stock decisions. We all get things wrong. Accept that, and half of the battle--the not-losing-money half--is won. 6. The School Fees and Mortgage Stop Loss Paying essential bills takes priority over trading, I'm afraid. 7. The Divorce Stop Loss Only triggered it once, and if you can recognise the "engagement ring thrown at you" stop loss first, you'll never actually need it. It's Not What You Buy, It's What You Do AfterIt's not about what you buy, it's all about what you do after you buy. Managing the investment, not making it. Most high (or low) brow investors working off Buffett quotes have been brainwashed to think it's all about choosing what to buy. For a disciplined investor or trader, it's all about what you do after you buy. That's the part that needs a plan, discipline, and vigilance, and it's where almost everyone goes wrong and doesn't bother.If you are one of those "Set & Forget", Buffett-quoting, ineffective "Invest as if they are going to shut the market for ten years" investors, shut your eyes, exercise your first stop loss, and see what happens. You will instantly move from confused, indecisive, and unfit to invest, to something... better.Forever.It's not hard. Try it. Author: Marcus Padley |
|
Funds operated by this manager: |

25 Sep 2024 - Five key takeaways from the latest GDP data
|
Five key takeaways from the latest GDP data Pendal September 2024 |
|
TODAY'S June quarter GDP numbers paint a reasonably bleak, but not unexpected, picture of the Australian economy. Quarterly GDP was 0.2% for the third consecutive quarter, leaving annual growth at 1%. It was the weakest financial year - excluding the Covid hit of 2020/21 - since the recession of 1991/92. We are avoiding a technical recession overall this time, but the consumer is going backwards - even with 2.5% population growth. Remember, the main GDP you hear reported is a chain volume, not price measure. I prefer looking at numbers on a state basis, split into consumption and investment. This gives a better picture of what is going on in the economy.

Source: ABS Here are five key takeaways from today's numbers: 1. Government spending remains strong despite government investment tapering offGovernment expenditure contributed 0.3% to GDP, government investment 0.1%, while government spending rose by a strong 1.4%. The main driver is social benefit programs for health services (largely the NDIS). This also remains a major source of strength for employment and inflation, and is central to the current animated debate between Treasurer Chalmers and the RBA (though Governor Bullock has wisely toned down prior comments, leaving RBA proxies to continue it). State governments are also major drivers of growth and inflation. However, NSW has now seen government investment go negative (down 3.8%) as major projects like the Metro are completed. Victoria (up 5.4%) and South Australia (up 5.8%) clearly didn't get the RBA memo asking for restraint. 2. Households are going backwards againHousehold expenditure fell by 0.2% over the quarter, leaving it up only 0.5% on the year. Each person is buying 2% less of goods and services than a year ago. NSW was particularly hard hit (down 0.6%) for the quarter, with Queensland (up 0.1%) and WA (up 0.4%) bucking the trend. 3. Households are barely saving anythingThe national accounts do not directly measure savings - it is a residual item after income and expenditure are calculated. However, it does give an insight into household behaviour. The saving ratio remained at 0.6%. 
Source: ABS Now, there can be opposing explanations of a fall in the savings ratio. On the positive side, it can reflect animal spirits as optimistic consumers go on a spending spree, believing their finances are strong - we saw this pre-GFC when the savings rate regularly went negative. However, it can also reflect that in the nominal economy, income growth is not exceeding price growth, meaning consumers need to either save less or draw down on existing savings. Given current rates and sluggish spending, this is a better explanation. 4. Australia's commodity boom is waning (negative for GDP) but remains historically strongAustralia's terms of trade - the prices we receive for our exports versus what we pay for our imports - fell 3% in the quarter. Import prices were flat but export prices, dominated by bulk commodities, fell 3%. It is down 6.4% from a year ago. The terms of trade peaked in June 2022 and is now around 20% lower, but it still remains slightly above the post-GFC average. The main impact for governments is a tapering of the "rivers of gold" from royalties and mining company taxes. On a more positive note, service exports are growing strongly again (up 5.6%), though recent Federal Government overseas student policy announcements may dampen this. 5. Finishing on an optimistic note, GDP should pick up from hereA lot is being made, especially by the government, around the positive impact that tax cuts and subsidies should have in the year ahead. Of more importance, though, is the fact that for the first time since the inflation boom of 2022, incomes are increasing faster than inflation. This real wage growth is being driven by falling inflation, which will continue in the year ahead. The RBA is forecasting GDP of 1.7% for 2024 and 2.6% for 2024/25. Given the first two quarters of this year are only up 0.4%, the RBA is expecting a 0.6% to 0.7% quarterly rises over the next year. This may seem a bit optimistic, but the possibility of rate cuts and falling inflation could well see a decent rebound in the economy. Public demand should moderate over the medium term, but current reforms will take time. The fact it is an election year for the Federal Government should see public demand remain around 4%, meaning household consumption need only return towards 2%, or population growth, for its forecast to be hit. Author: Tim Hext |
|
Funds operated by this manager: Pendal Global Select Fund - Class R, Pendal Horizon Sustainable Australian Share Fund, Pendal MicroCap Opportunities Fund, Pendal Multi-Asset Target Return Fund, Pendal Sustainable Australian Fixed Interest Fund - Class R, Pendal Sustainable Australian Share Fund, Regnan Credit Impact Trust Fund, Regnan Global Equity Impact Solutions Fund - Class R |
|
This information has been prepared by Pendal Fund Services Limited (PFSL) ABN 13 161 249 332, AFSL No 431426 and is current as at December 8, 2021. PFSL is the responsible entity and issuer of units in the Pendal Multi-Asset Target Return Fund (Fund) ARSN: 623 987 968. A product disclosure statement (PDS) is available for the Fund and can be obtained by calling 1300 346 821 or visiting www.pendalgroup.com. The Target Market Determination (TMD) for the Fund is available at www.pendalgroup.com/ddo. You should obtain and consider the PDS and the TMD before deciding whether to acquire, continue to hold or dispose of units in the Fund. An investment in the Fund or any of the funds referred to in this web page is subject to investment risk, including possible delays in repayment of withdrawal proceeds and loss of income and principal invested. This information is for general purposes only, should not be considered as a comprehensive statement on any matter and should not be relied upon as such. It has been prepared without taking into account any recipient's personal objectives, financial situation or needs. Because of this, recipients should, before acting on this information, consider its appropriateness having regard to their individual objectives, financial situation and needs. This information is not to be regarded as a securities recommendation. The information may contain material provided by third parties, is given in good faith and has been derived from sources believed to be accurate as at its issue date. While such material is published with necessary permission, and while all reasonable care has been taken to ensure that the information is complete and correct, to the maximum extent permitted by law neither PFSL nor any company in the Pendal group accepts any responsibility or liability for the accuracy or completeness of this information. Performance figures are calculated in accordance with the Financial Services Council (FSC) standards. Performance data (post-fee) assumes reinvestment of distributions and is calculated using exit prices, net of management costs. Performance data (pre-fee) is calculated by adding back management costs to the post-fee performance. Past performance is not a reliable indicator of future performance. Any projections are predictive only and should not be relied upon when making an investment decision or recommendation. Whilst we have used every effort to ensure that the assumptions on which the projections are based are reasonable, the projections may be based on incorrect assumptions or may not take into account known or unknown risks and uncertainties. The actual results may differ materially from these projections. For more information, please call Customer Relations on 1300 346 821 8am to 6pm (Sydney time) or visit our website www.pendalgroup.com |
