News

21 Jun 2023 - Performance Report: Bennelong Australian Equities Fund
[Current Manager Report if available]

21 Jun 2023 - Thinking small to win big
|
Thinking small to win big Novaport Capital May 2023 Conventional wisdom suggests that 'time in the market' is a less risky strategy than 'timing the market'. Boom and gloom provide attractive entry and exit points but only if the timing is right. Accurately identifying market peaks and troughs is notoriously difficult. In our experience, gradually allocating more to markets during times of market distress and less when 'everything is awesome' is a preferable approach. Small caps, and in particular, industrials, present an opportunity for investors at current levels. The Small Ordinaries benchmark has underperformed the ASX100 since November 2021. Notably, industrials have underperformed resources, which have been supported by thematics such as energy security, battery materials, and gold. In addition, adjusting to tighter monetary policy has weighed on small industrials. The recent underperformance presents a chance for investors to incrementally allocate to the sector. Falling liquidity signals capitulation Investors' willingness to trade reveals their confidence, or lack thereof, in the market. Rising liquidity can create a virtuous circle during a bull market, when abundant liquidity entices more capital into markets (attracted by lower trading costs). Yet when liquidity falls and markets are falling, the cycle works in reverse. Capital ceases to flow to (or exits) the market due to illiquidity concerns. Since November 2021, liquidity in the small industrials sector has dropped meaningfully. Thus far in 2023, the daily average value of turnover for small industrials has been $704m, down a third (from $1,070m) during the same period in 2021. The decline in liquidity indicates that a lower amount of new money is being put to work in Small Caps. Contrarian investors have a better chance of picking up a bargain now, relative to last year. Microcaps have been hit harder Not surprisingly the decline in liquidity has been most pronounced for the smallest of small caps. 74% of the smaller small industrials (with a market capitalisation of less than $1 billion) had lower turnover in the last 12 months relative to the previous year. Adjusting for stocks which benefited from index inclusion, 85% of companies saw turnover decline. The impact on liquidity has been lower for the larger small companies, 63% had lower turnover (or 69% adjusting for index changes). Unsurprisingly, 37% of 'larger' small caps (market cap >$1bn) outperformed the benchmark relative to a mere 14% of the 'smallest' companies. One of our holdings Quantum Intellectual Property Ltd, provides a case study of the current dynamic in microcaps. Quantum has a meaningful and growing share of the Australian Patent, Trade Mark and IP Legal Services market. Over the last year their share price has fallen by 19%, materially under-performing the small cap benchmark. On our estimates, the company trades on an attractive discount to earnings and yield metrics relative to the broader market, however its share turnover is 23% lower than the previous year. In a recent market update, the company reaffirmed expectations for organic growth, improving margins and further consolidation opportunities. The decline in liquidity merely reflects that the stock has fallen off the market's radar in our view, creating an investment opportunity. Quantum is just one example of similar opportunities arising in the current market environment. Different exposures than large caps The Australian stock market is heavily weighted towards highly profitable bank and resources stocks. The smaller end of the market has a wider range of exposures, from resource exploration stocks and retailers to fast growing technology businesses. The composition of the small caps benchmark evolves over time. Furthermore, industrial companies are less risky than three years ago. We estimate that loss making companies are now only 5% of the small industrials' universe, down from over 30% before the pandemic. The current small cap market has a lower exposure to risky, early stage or loss-making companies. Following the recent underperformance of small caps, we see attractively priced opportunities relative to the large cap universe. For example, Domain Holdings offers faster growth than REA Group (as it increases market penetration), yet it trades at a discount. At the same time, small cap building materials companies in markets with high barriers to entry, trade at through cycle earnings multiples in the mid-teens, despite having more favourable industry structures relative to than their historical averages. Smaller Companies have traditionally been more volatile and sensitive to the economic environment, which is expected to be challenging. There are valid reasons to be cautious. However, the small industrials benchmark is comprised of more robust businesses post the 2022 market correction. Their underperformance relative to large caps and the withdrawal of liquidity suggests the market is already fearful. This presents us with an opportunity to increase our exposure to quality, but overlooked, businesses. Author: Sinclair Currie, Principal and Co-Portfolio Manager Funds operated by this manager: NovaPort Microcap Fund, NovaPort Wholesale Smaller Companies Fund This material has been prepared by NovaPort Capital Pty Limited (ABN 88 140 833 656 AFSL 385 329) (NovaPort), the investment manager of the NovaPort Smaller Companies Fund and the NovaPort Microcap Fund (Funds). Fidante Partners Limited ABN 94 002 835 592 AFSL 234668 (Fidante) is a member of the Challenger Limited group of companies (Challenger Group) and is the responsible entity of the Funds. Other than information which is identified as sourced from Fidante in relation to the Funds, Fidante is not responsible for the information in this material, including any statements of opinion. It is general information only and is not intended to provide you with financial advice or take into account your objectives, financial situation or needs. You should consider, with a financial adviser, whether the information is suitable to your circumstances. The Fund's Target Market Determination and Product Disclosure Statement (PDS) available at www.fidante.com should be considered before making a decision about whether to buy or hold units in the Funds. To the extent permitted by law, no liability is accepted for any loss or damage as a result of any reliance on this information. Any projections are based on assumptions which we believe are reasonable but are subject to change and should not be relied upon. NovaPort and Fidante have entered into arrangements in connection with the distribution and administration of financial products to which this material relates. In connection with those arrangements, NovaPort and Fidante may receive remuneration or other benefits in respect of financial services provided by the parties. Fidante is not an authorised deposit-taking institution (ADI) for the purpose of the Banking Act 1959 (Cth), and its obligations do not represent deposits or liabilities of an ADI in the Challenger Group (Challenger ADI) and no Challenger ADI provides a guarantee or otherwise provides assurance in respect of the obligations of Fidante. Investments in the Fund(s) are subject to investment risk, including possible delays in repayment and loss of income or principal invested. Accordingly, the performance, the repayment of capital or any particular rate of return on your investments are not guaranteed by any member of the Challenger Group. |

20 Jun 2023 - Performance Report: Emit Capital Climate Finance Equity Fund
[Current Manager Report if available]

20 Jun 2023 - Performance Report: Delft Partners Global High Conviction Strategy
[Current Manager Report if available]

20 Jun 2023 - Australian Secure Capital Fund - Market Update May
|
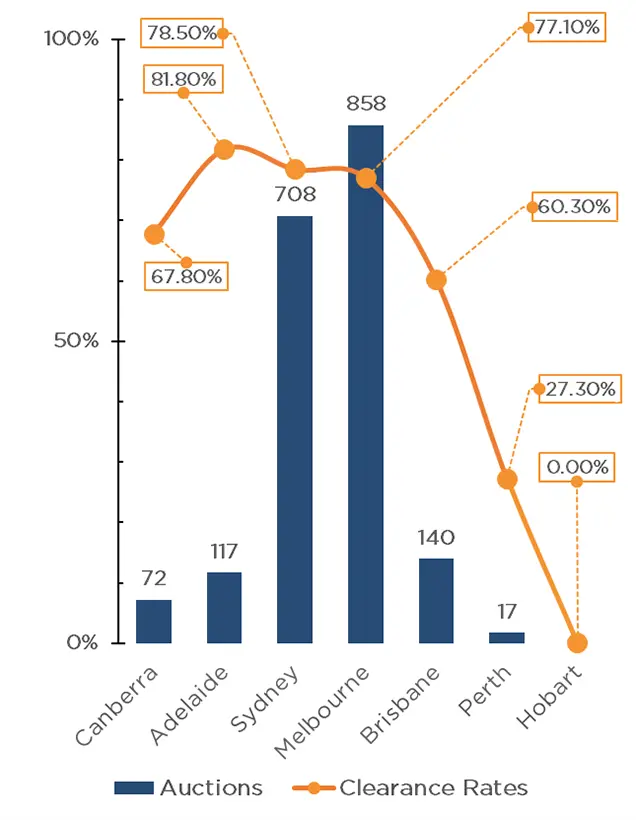
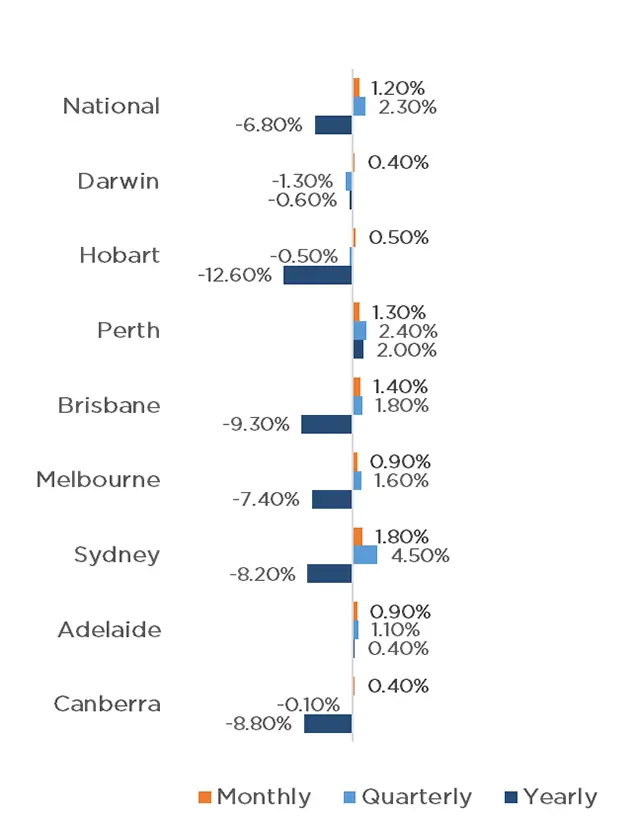
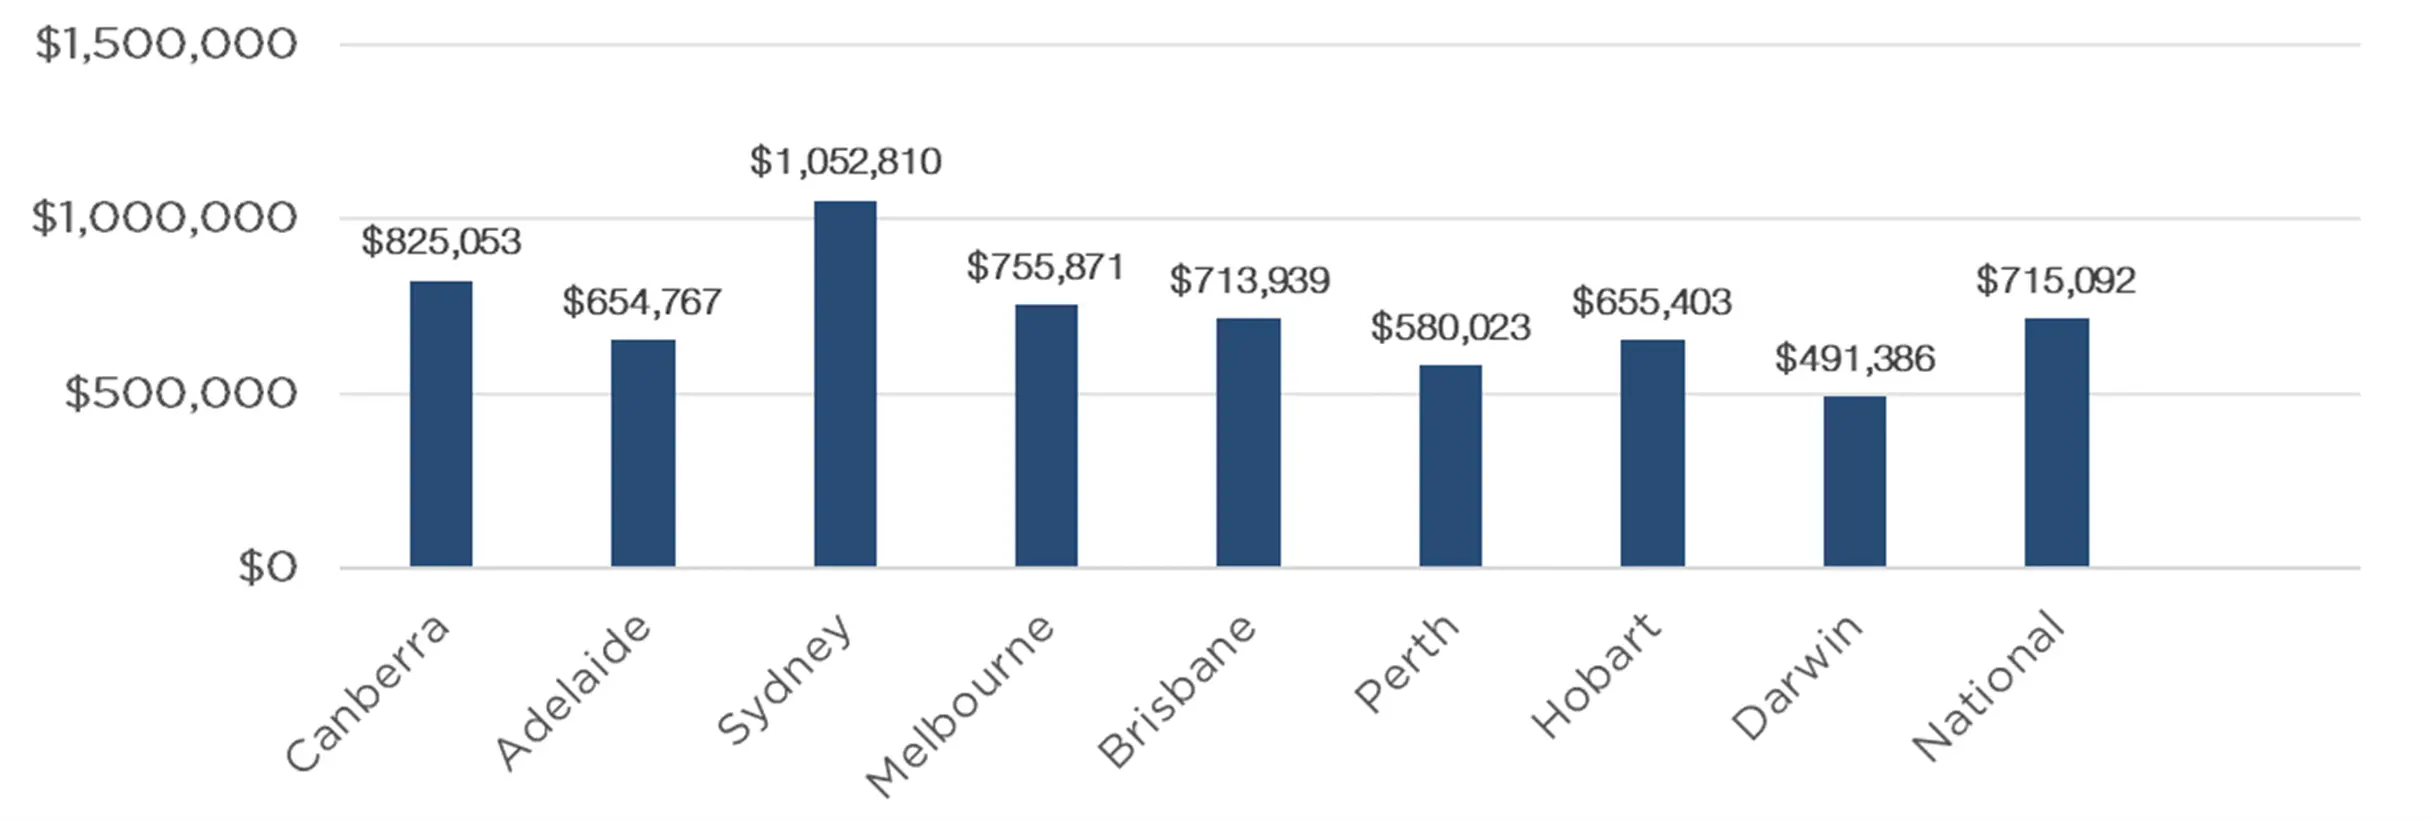
Australian Secure Capital Fund - Market Update May Australian Secure Capital Fund June 2023 The Australian housing market continues to bounce back despite further interest rate rises, with CoreLogic's national Home Value Index rising by 1.2% in May. The capitals and the regions both performed strongly, with all capital cities recording a month-on-month increase, and only regional Victoria decreasing. Once again, the capital cities performed well with Sydney leading the way with a 1.8% increase, followed by Brisbane (1.4%), Perth (1.3%), Melbourne (0.9%), Adelaide (0.9%), Tasmania (0.5%), Darwin (0.4%) and Canberra (0.4%). Performance across regional areas was also largely positive, with only Victoria experiencing a reduction in values (-0.5%). The Northern Territory and ACT, maintained values, whilst New South Wales (0.5%), Western Australia (0.5%), Tasmania (0.7%), Queensland (0.8%) and South Australia (0.9%) all experienced growth. The property market continues to experience a lack of supply, with the last weekend of May holding just 1912 auctions, well below the 3226 that occurred on the same weekend in 2022. This lack of supply is likely the factor propping up property prices. Melbourne (858) and Sydney (708) led the way with significantly more auctions taking place than the rest of the country with Brisbane (140), Adelaide (117), Canberra (72) and Perth (17) all well below previous year figures. Whilst the total auctions were down considerably, clearance rates were exceptionally high, with a weighted average of 75.9% across the capital cities, well above the 59.3% last year. Adelaide had the highest clearance rate across the country, with 81.8% (up from 73.6% last year). Sydney and Melbourne also performed strongly with 78.5% and 77.1% respectively, well above the 56.4% and 60.4% last year. Canberra recorded 67.8% (64.4% last year) with Brisbane also outperforming last year, with 60.3% (51.2% last year). Perth was the weakest performance of the cities, with only a 27.3% clearance rate, down from 42.1% last year. Clearance Rates & Auctions 22nd - 25th of May 2023
|

19 Jun 2023 - Performance Report: PURE Resources Fund
[Current Manager Report if available]

19 Jun 2023 - Performance Report: 4D Global Infrastructure Fund (Unhedged)
[Current Manager Report if available]

16 Jun 2023 - Hedge Clippings | 16 June 2023
|
|
|
|
Hedge Clippings | 16 June 2023 Inflation: No Pain, No Gain. Paul Keating will long be remembered for his "recession we had to have" comment, made way back in 1990. The self-styled "World's Greatest Treasurer" embraced the attention the comment gave him at the time, and has frequently dined out on it ever since. 33 years later we're back to facing another recession - with a number of leading business figures this week putting the chances at 50:50. Anecdotal evidence indicates that sections of the economy, and/or the community, are closer than others (if not there already), but meanwhile we're still treading the "narrow path" that Philip Lowe is trying to take the economy down, inflicting economic pain to achieve an inflationary gain. The causes - and hopefully the effects - of the 1990's recession and today's recession - or should that be tomorrow's - are quite different, although there are some parallels. The excesses of the '80's led to the crash of '87, which flowed to Australia, as did high inflation. By 1992 unemployment was 11 per cent, and mortgage rates topped 17%. This time around, we're still hostage to global tides and currents, and as such the economic after-effects of the GFC, QE, COVID, and Ukraine, but we are thankfully a long way from approaching the levels of 1992. Where Keating was keen to deflect responsibility (nothing's changed!) even to the extent of implying he should be given the credit, this time around all the criticism has been directed at Philip Lowe thanks to his forward guidance in March 2020 that rates, then at an unprecedented level of 0.1%, would remain there for an "extended period". In November of that year, in an attempt to stimulate an economy he's now trying to cool, he defined that period as "at least three years". In February 2021, he made his now famous prediction that the RBA's expectation was that rates would "not increase until 2024 at the earliest". While all the finger pointing is going on, and with the benefit of hindsight, let's remember the timeline: In March 2020, when Lowe's forward guidance mentioned an "extended period" of low rates, COVID-19 had just emerged. Later that month the government declared a state of emergency, 14 day quarantines, and a national lockdown. In NSW, indoor and outdoor gatherings were limited to two people. In July 2020, Victoria commenced a 16 week lockdown. Consequently in the June quarter of 2020, GDP fell 6.7%, then rebounded in the following four quarters, before falling 2.1% in September 2021. The RBA's targeted inflation band was (and remains) 2-3%. In December 2020 inflation came in at just 0.09%, resulting in the RBA's February 2021 guidance that "the Board will not increase the cash rate until actual inflation is sustainably within the 2 to 3% target range". At that stage inflation had not been above 2% for more than one quarter since September 2014, and by June 2020 it had dipped -0.3%. Lowe and the RBA Board undoubtedly misjudged the post COVID rebound, and can be excused for not foreseeing Russia's invasion of Ukraine in early 2022, but two things emerge: Firstly, for the previous six or seven years they had been battling LOW inflation, and particularly given COVID, they were keen, or possibly desperate, to stimulate the economy. Secondly, fellow central bankers around the world made the same mistakes. However, Lowe is on the outer, particularly with Chalmers, who unlike Keating in 1990, is looking for a scapegoat. So where to now? Earlier this week the Federal Reserve held US rates steady for the first time in a year, despite projecting that inflation will persist, leaving their options open to move rates higher going forward. In Australia, May's unemployment level fell back to 3.6%, contradicting the weak March GDP number of 0.2%, the weakest result since September 2021. By that time Australia's economic journey down the "narrow path" will have been confirmed, along with Philip Lowe's walk down a wooden plank. |
|
|
News & Insights Market Commentary | Glenmore Asset Management Quay podcast: The surprising trends emerging in real estate | Quay Global Investors May 2023 Performance News |
|
|
If you'd like to receive Hedge Clippings direct to your inbox each Friday |

16 Jun 2023 - Performance Report: ASCF High Yield Fund
[Current Manager Report if available]

16 Jun 2023 - Performance Report: Collins St Value Fund
[Current Manager Report if available]


