
News

5 Dec 2025 - Laffont's Take on the AI Bubble
|
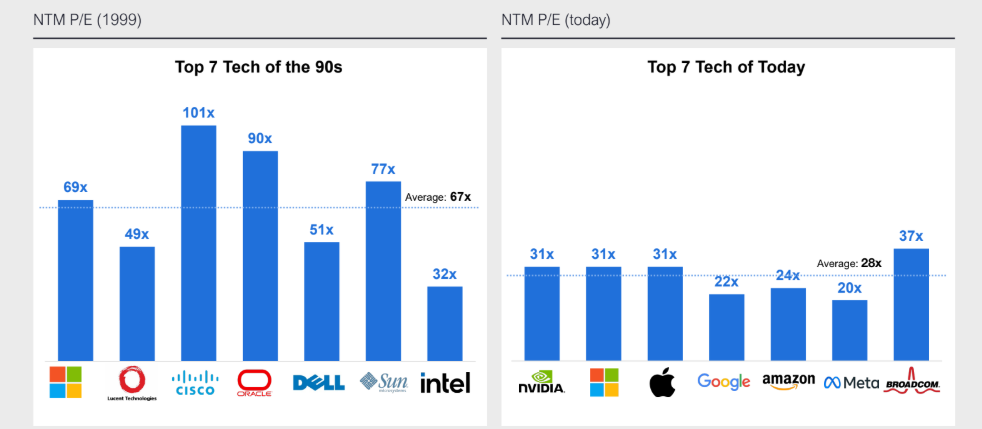
Laffont's Take on the AI Bubble Marcus Today November 2025 5-minute read With Warren Buffett stepping down from public life at 95, younger investors are looking for a new sage to follow. God knows the legendary Buffett gave us enough wise words on life and markets over the years. I'm not sure he can help us today anyway. Buffett's no expert on artificial intelligence, at least as far as I know. He doesn't even have a computer in his office or a smartphone. AI is the new guy's problem. Hunting for a New Buffett in the AI EraWhom to select as a Buffett replacement as the next global sage? Some would suggest Phillipe Laffont might do the trick. He runs a firm called Coatue Management. It now has (approx.) $70bn under management. Laffont's calls on the US tech boom have been prescient for a long time. Last month, Coatue Management released his latest thinking publicly and he addressed the big question of our times: Is AI a bubble, after all? Well, it could be. You can make an argument for the case, and he at least addresses it. Yes, capital expenditure is big. Adoption may not happen on a sufficient scale. The circularity of deals is something to watch for. But Laffont was, and remains, an AI bull. Why the AI Bulls Still Have a CasePerhaps the most compelling point for the bull case, at least for me, is that AI adoption is massive, and yet still so early. There's a long runway here. A further point is that, while the US market is richly valued, it's not crazy, and certainly not like the dot-com boom. You can see how he presents this point below:
Source: Coatue Management We can extrapolate this point further. Much of AI spending is from existing cash flow, at least for now. There isn't the same financial fragility as historic bubbles usually show. Laffont adds that the Big Tech firms may even have lots more cash to splash. That's if a core promise of AI comes to fruition: less labour costs. The numbers around this are quite something. Coatue say that the top 50 tech companies in the US could save $75bn in labour costs annually if AI can reduce headcount by 6%. Imagine what it could do with a higher percentage. All those figures around "headcounts" are to do with human beings, and their livelihoods. There's a big discussion for society to have on this point. But as far as the stock market goes, it leads, all else being equal, to higher profits. Good for share prices. It may not be wise to go against this for too long. Amazon (NASDAQ: AMZN) is already shedding thousands of people. It's usually an early mover on all the big trends. There are no certainties in the markets, or life for that matter. I'm sure Buffett would agree on this point. Bubble Risk vs Opportunity in the Next AI WaveCoatue sees the most likely outcome as AI increasing productivity and GDP. That keeps inflation contained, and, left unsaid, the big US debt problem for another time. Coatue are not blind to the risks. They see a 1/3 chance that the AI bubble bursts and takes the market down with it. But their conclusion seems to be that there's too much potential in the next wave of adoption, such as enterprise AI apps and how AI companies like OpenAI monetise their user base. Don't forget that even a titan like Google (NASDAQ: GOOG) is now under threat here. That should be enough for a lot of companies to shake in their boots... and us watching for the next behemoth to emerge. No moat, a feature so beloved by Buffett, looks safe from the AI encroachment. I can't tell you today what the next wave of AI winners will be. But we won't find them if we don't even look. Rather than fret about whether AI is a "bubble", I'm sure we'll both be better served by looking to see who benefits. That's my takeaway from Laffont's messaging. I'd like to think Buffett might say the same. |
|
Funds operated by this manager: |

4 Dec 2025 - US Private Credit Signals Superior Value Down Under
|
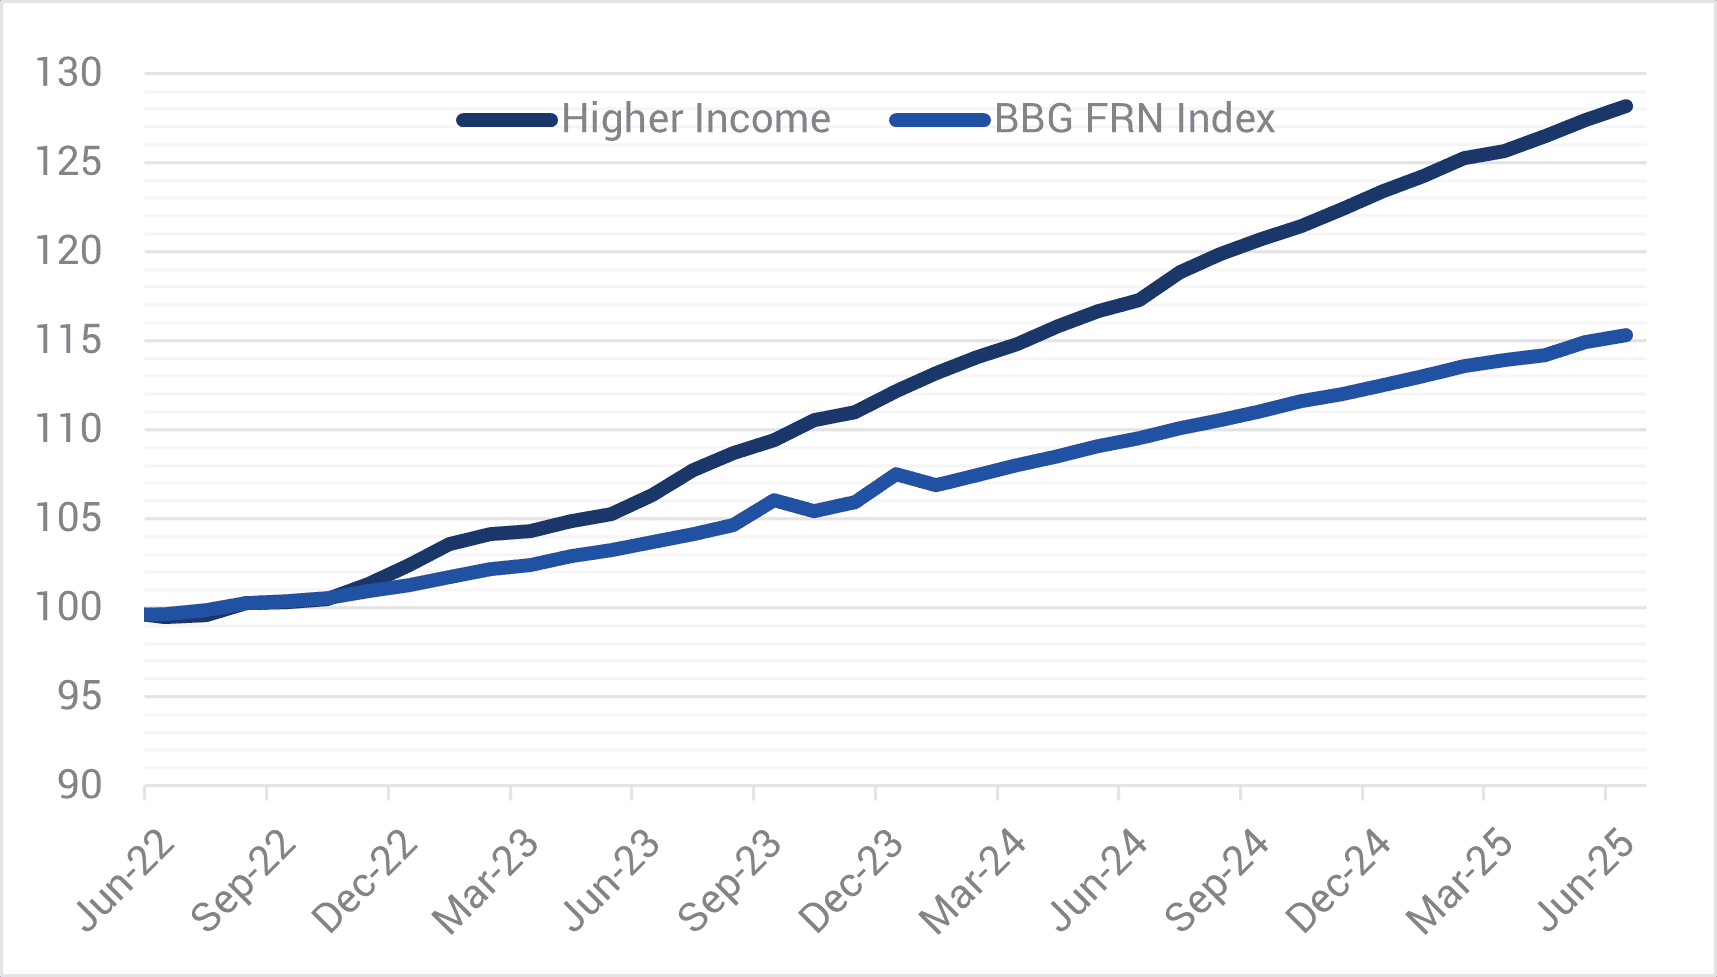
Phil Strano: Is now the sweet spot for active bond management? Yarra Capital Management July 2025 The volatility currently seen in bond markets is being fuelled by a combination of macroeconomic forces. In the U.S., ballooning fiscal deficits and a new $3.8 trillion tax bill are putting upward pressure on long-term interest rates. At the same time, foreign demand for U.S. Treasuries appears to be weakening. Central banks are reducing interest rates, yet are constrained in their influence over longer-dated bonds. Meanwhile, Australia faces a decade of projected deficits of its own, and our yield curve continues to respond more to global forces than domestic settings. These pressures are driving significant steepening in the yield curve - the difference between short- and long-dated bond yields. Steepening curves allow skilled credit managers to adjust risk exposure and capitalize on price differences. In this environment, extending the maturity of our bond holdings has become more appealing, particularly given longer-term bonds can offer stronger price gains as they approach maturity - a dynamic we term "rolldown." At the same time, we're also seeing anomalies in credit spreads, where less sophisticated investors are prioritising yield over relative value, creating pockets of possible mispricing. This is where active management proves its worth. Passive bond funds are bound by index rules. They cannot reposition for anticipated curve moves, nor can they selectively add risk when prices dislocate. Given the Bloomberg FRN Index is more highly rated (average AA- compared to BBB) with shorter spread duration (~two years compared to ~three), the Yarra Higher Income Fund (HIF) is well placed to outperform during risk-on periods (refer Chart 1). However, HIF's outperformance during certain risk-off periods demonstrates the potential benefits of active management. HIF outperformed the index through 2022 in an environment of both higher bond yields and credit spreads and more recently in April 2025. Outperformance in April provides a recent example of how nimble decision-making up and down the curve may contribute to risk adjusted returns. While the FRN Index posted a negative excess return of 11bps compared to the RBA Cash Rate, HIF posted a positive 32 bps excess return despite credit spreads widening by 20-30bps over the month. In April, we started the month expecting volatility around geopolitical events, which prompted us to lift cash levels and position our portfolios with higher overall interest rate duration. Crucially, we also implemented this with a steepening bias or, in other words, a view that long-term interest rates would rise faster than short-term rates. By focusing our exposure on the front of the curve, or short-term bonds, and being underweight long-term bonds at the back end, we were well-positioned when the long end sold off sharply while the short end remained stable. Chart 1 - Cumulative Return - Yarra Higher Income Fund v. Bloomberg FRN Index
Source: YCM/BBG, June 2025.In terms of stock selection, April also presented some fantastic buying opportunities for us to take advantage of spread widening and add high-quality credit exposures at discounted levels. One such name was the USD-denominated Perenti 2029 bonds, an issuer we had previously sold at tight spreads of BBSW+180bps and were able to buy back ~200bps wider (BBSW+380bps). Credit spreads have since contracted ~100bps from these wides, providing a tidy return on investment. While our portfolio positioning has not changed markedly from 12 months ago, these two recent examples show how we're actively managing nimble, benchmark-unaware portfolios that are more 'all-weather' credit in nature. Our April performance, in which both Yarra's Enhanced Income Fund (EIF) and Higher Income Fund (HIF) posted positive absolute returns, underscores the value of our approach. Our strategy came together as a result of preparation, speed, and conviction, none of which are available to passive strategies. Looking beyond the tactical wins, and the case for active credit is supported by the broader macro context. While spread volatility continues, outright yields in the front and mid-parts of the curve have held steady. That means the income on offer remains attractive - and investors are simply being rewarded through a different mix of risk premia. The flexibility to shift between spread and rate risk allows us to preserve capital and position for growth, depending on where the market is offering best value. It's a powerful setup. Investment-grade credit today is offering yields that, on a 12-month view, look comparable to long-term equity market returns - but without the same drawdown risk. Across the spectrum, private credit looks less compelling: the illiquidity and default risk required to justify allocations to private credit simply aren't being compensated in this environment. Looking ahead, we see the drivers of this opportunity set - fiscal overreach, inflation variability, and steepening curves - as persistent features of the bond market over the next 6 to 12 months. We believe this is a sweet spot for credit investing. High running yields and steeper curves, allowing active positioning across durations are compelling and signal the era of 'buy everything and wait' in fixed income is over. Today's market rewards clarity of view, agility of execution, and a willingness to lean into volatility when others step back. |
|
Funds operated by this manager: Yarra Australian Bond Fund , Yarra Australian Equities Fund , Yarra Emerging Leaders Fund , Yarra Income Plus Fund , Yarra Enhanced Income Fund , Yarra Australian Smaller Companies Fund , Yarra Ex-20 Australian Equities Fund , Yarra Global Small Companies Fund , Yarra Higher Income Fund |

3 Dec 2025 - Is travel becoming the new status symbol for Gen Z?

2 Dec 2025 - 10k Words | November 2025
|
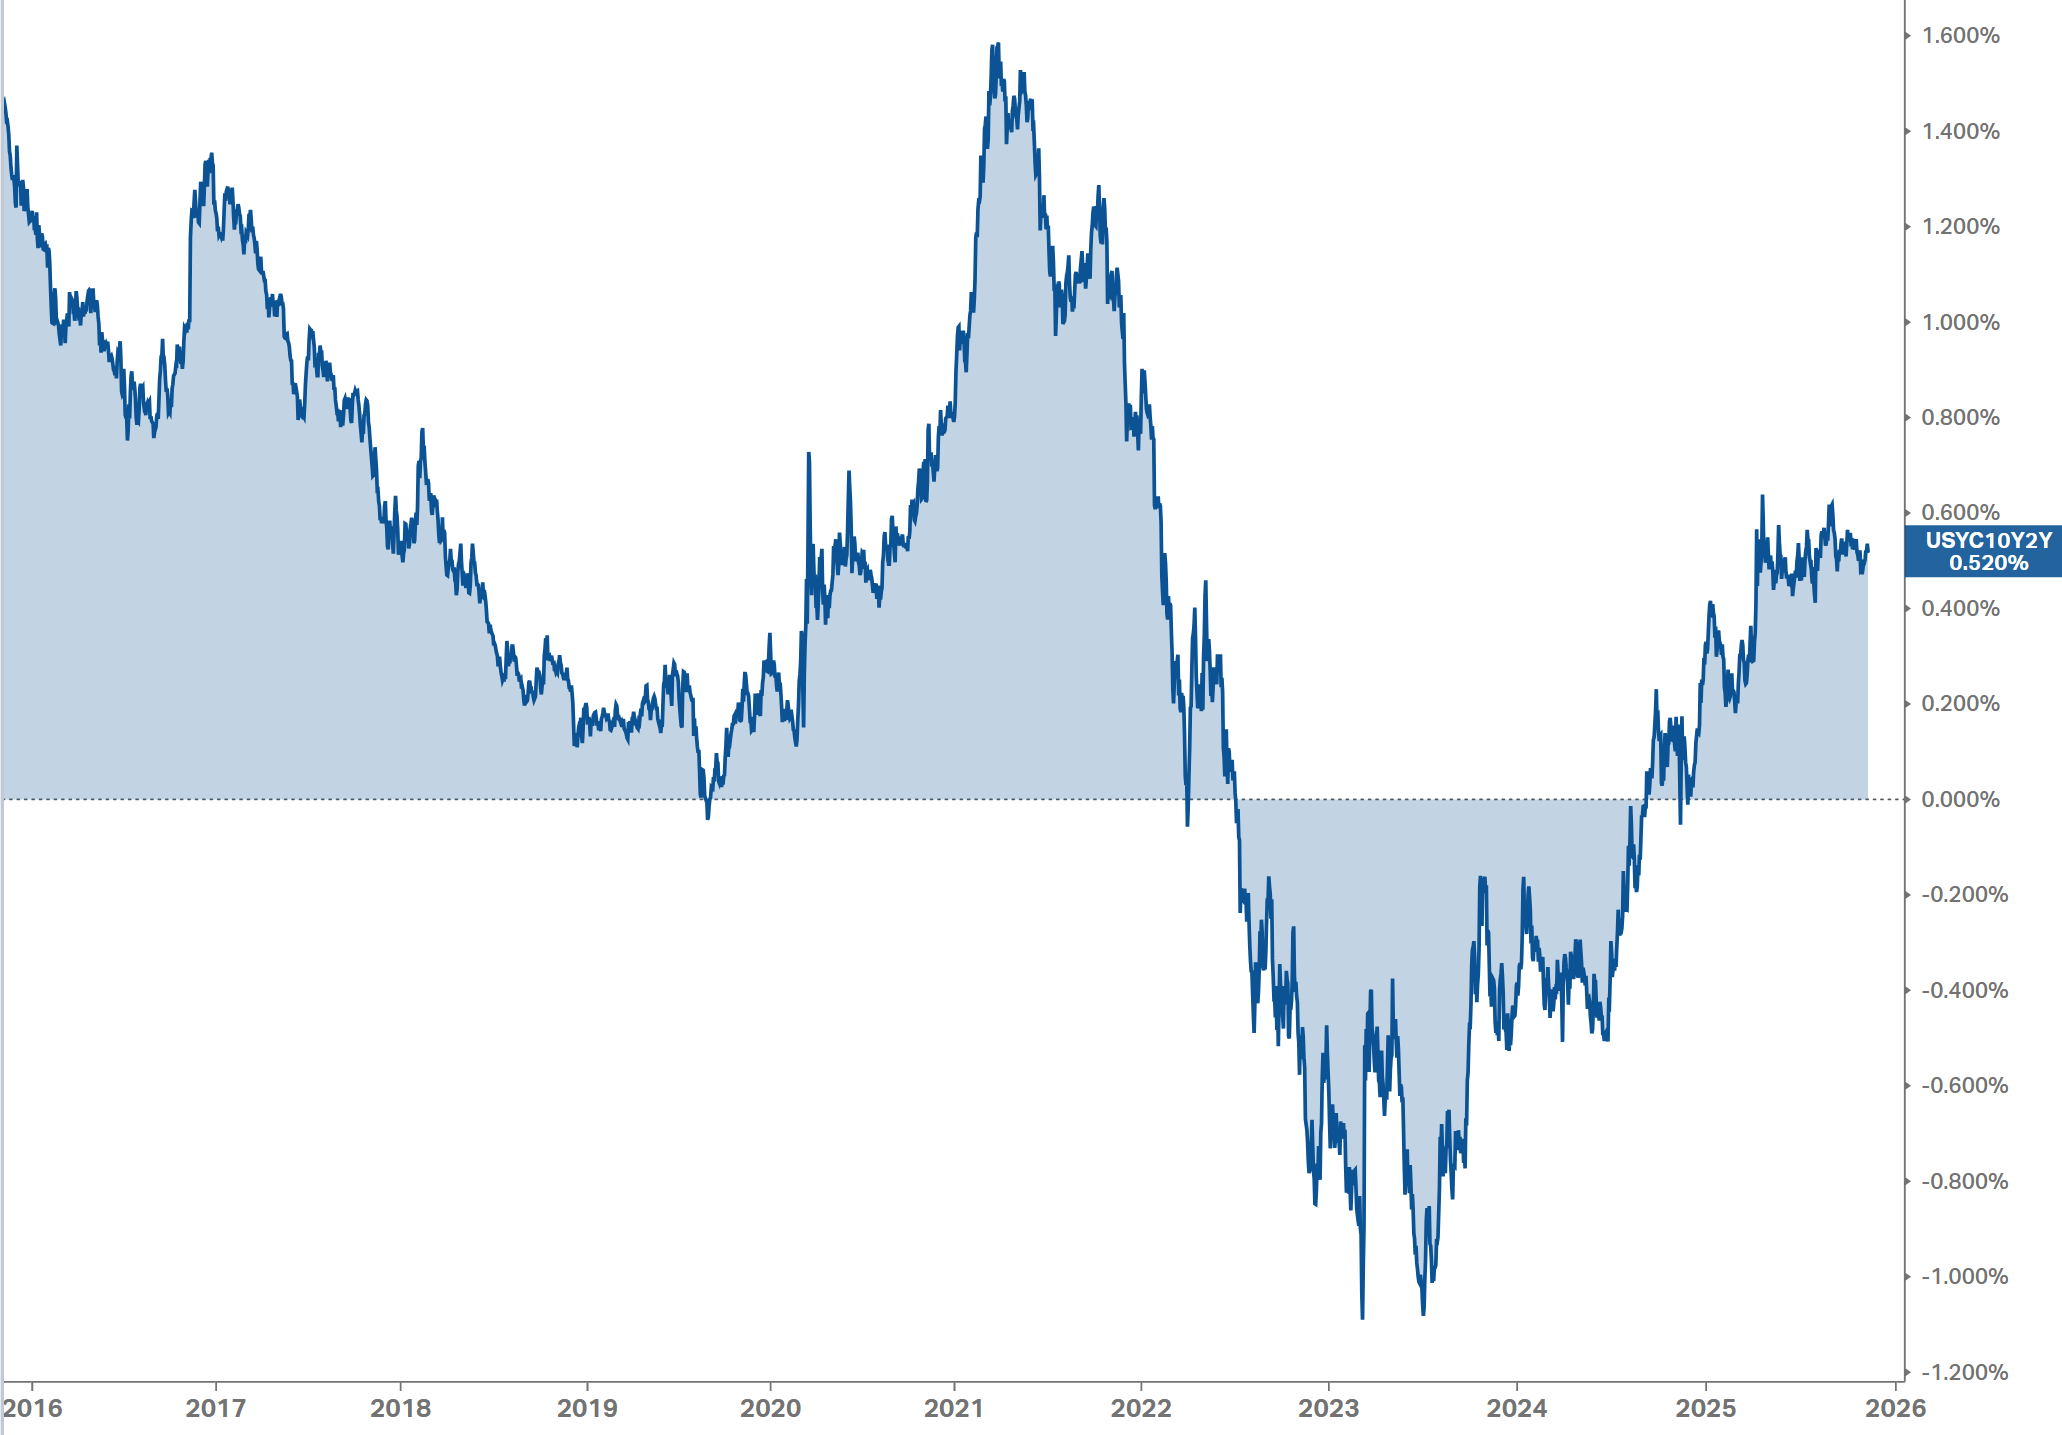
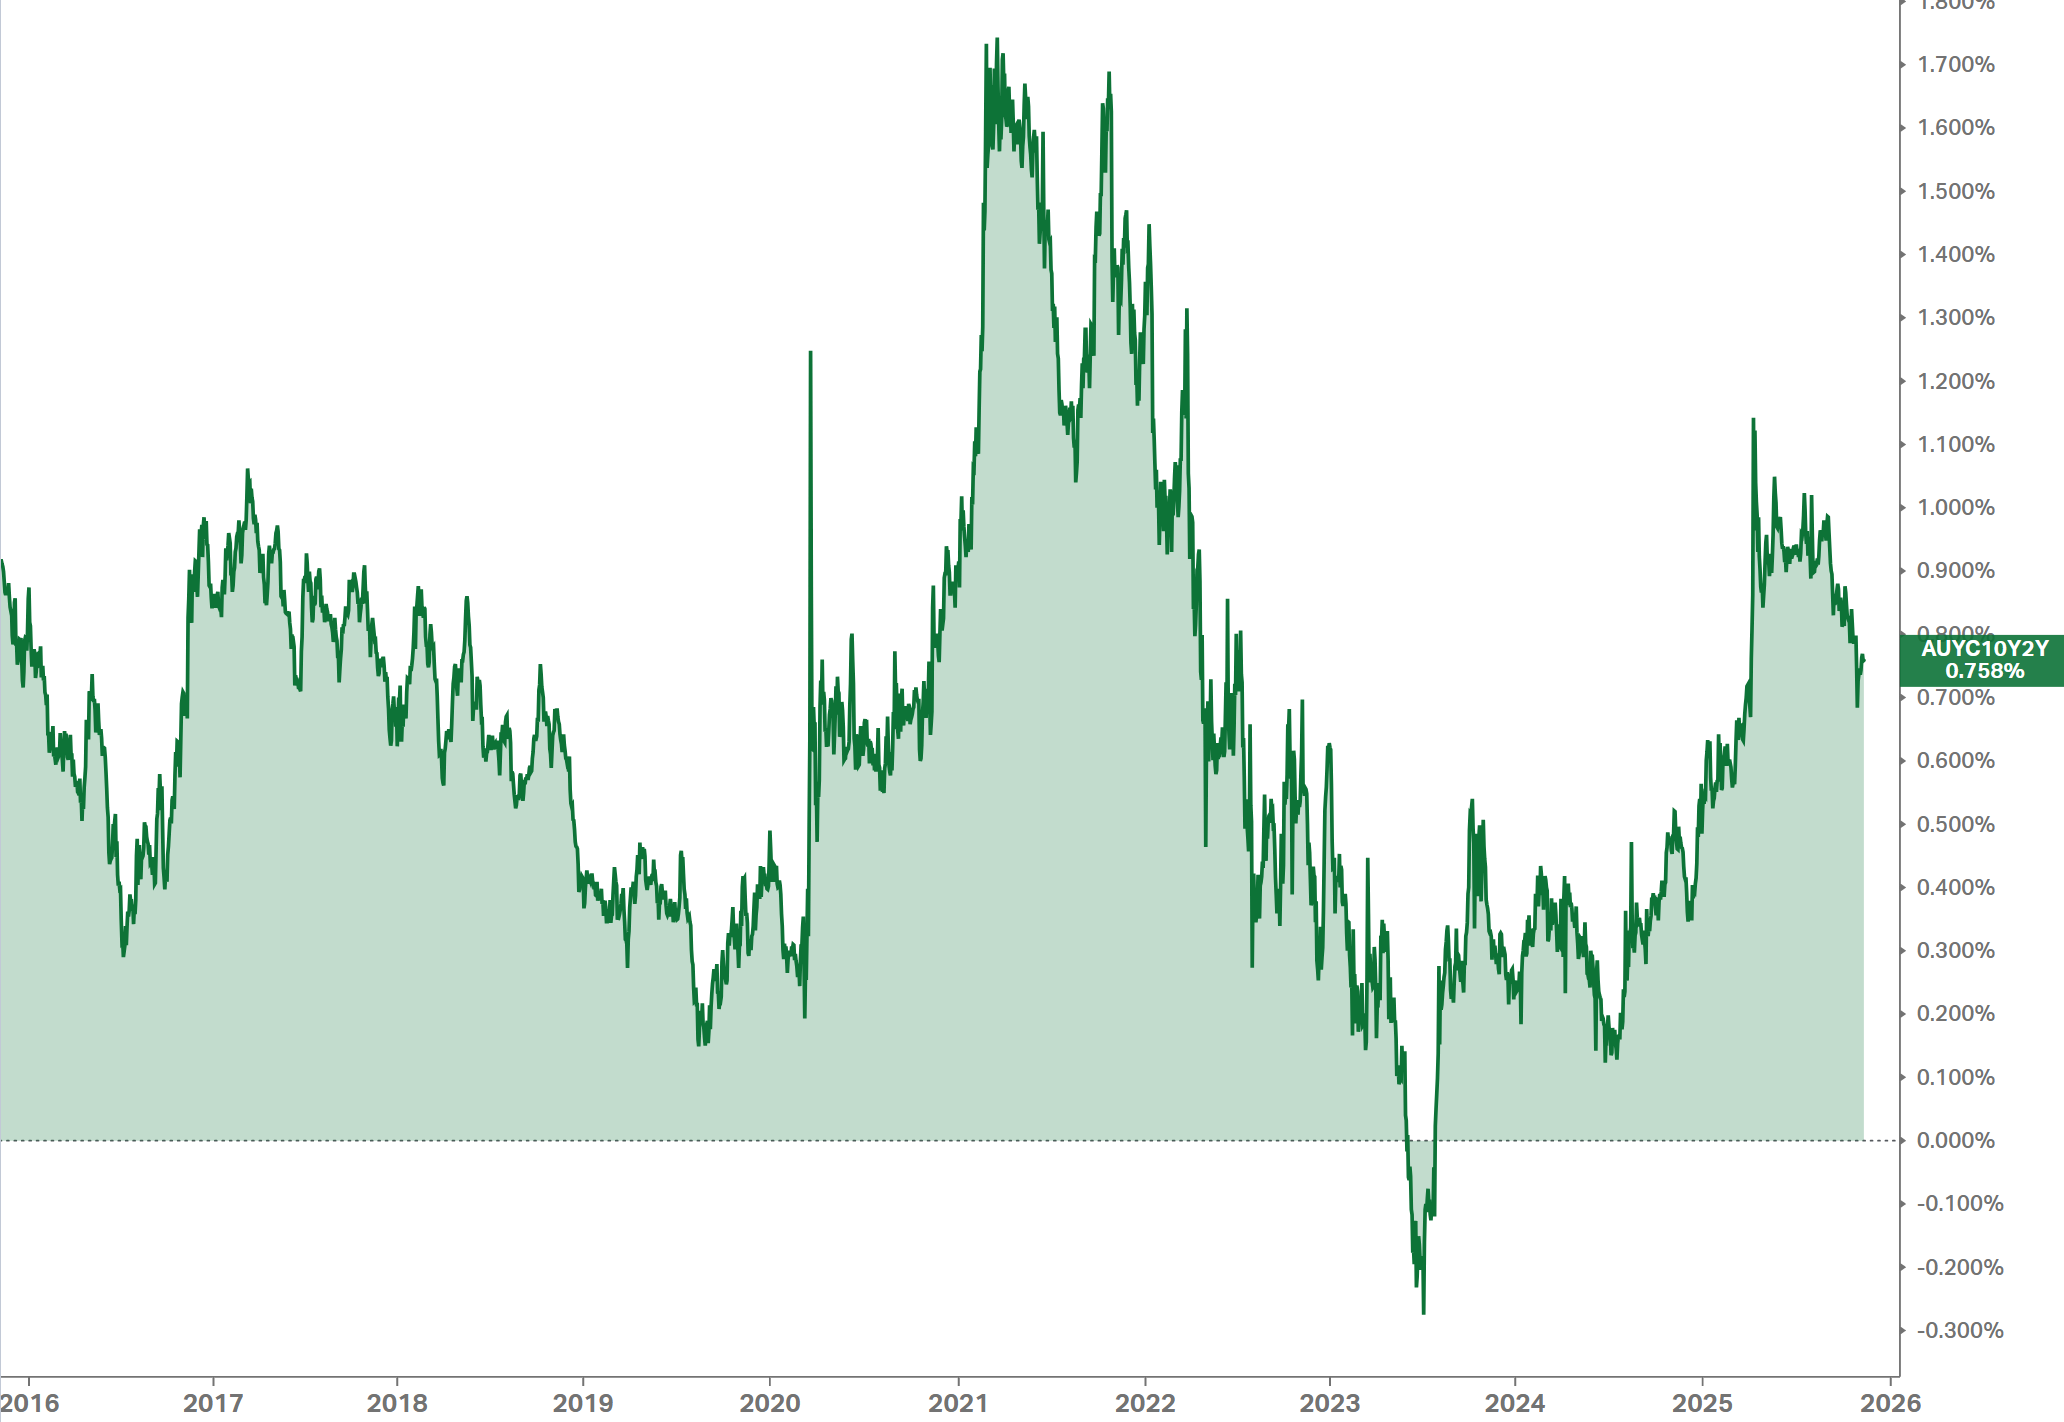
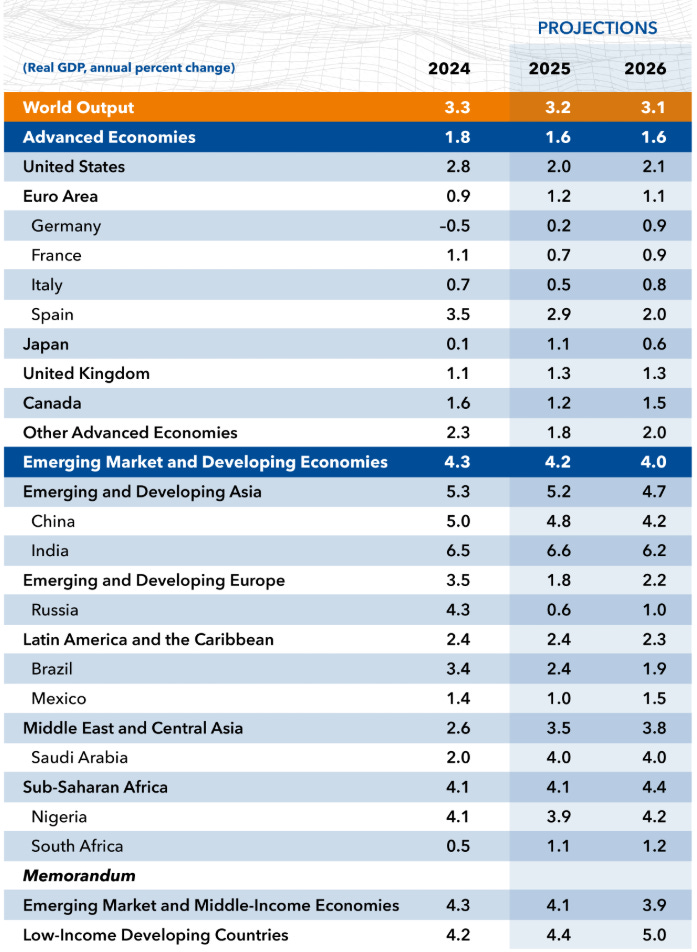
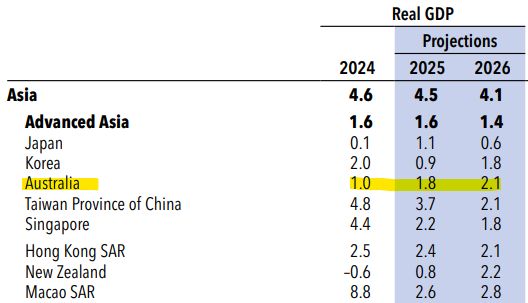
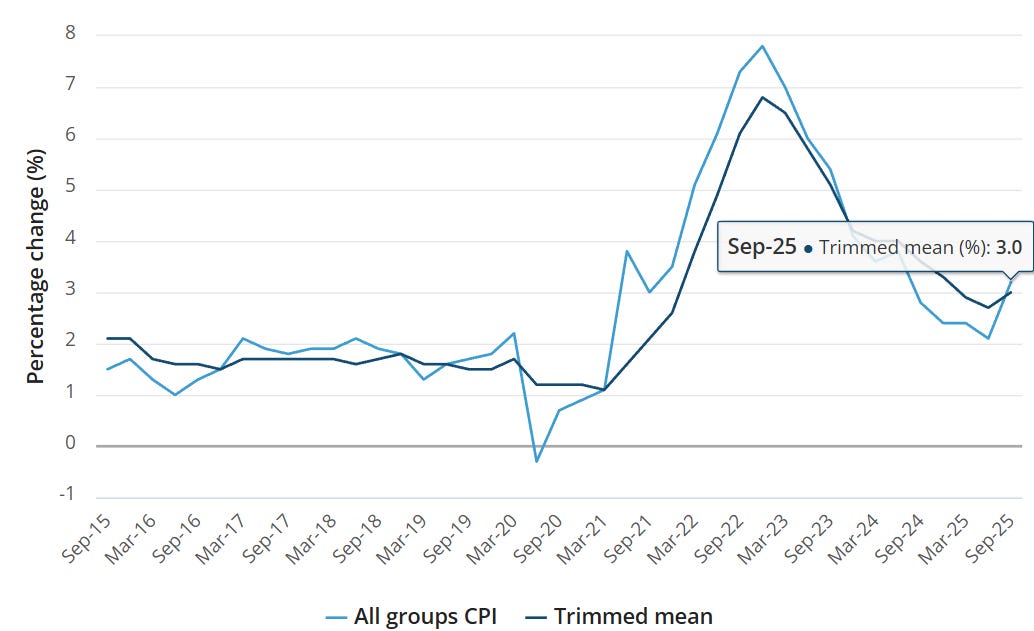
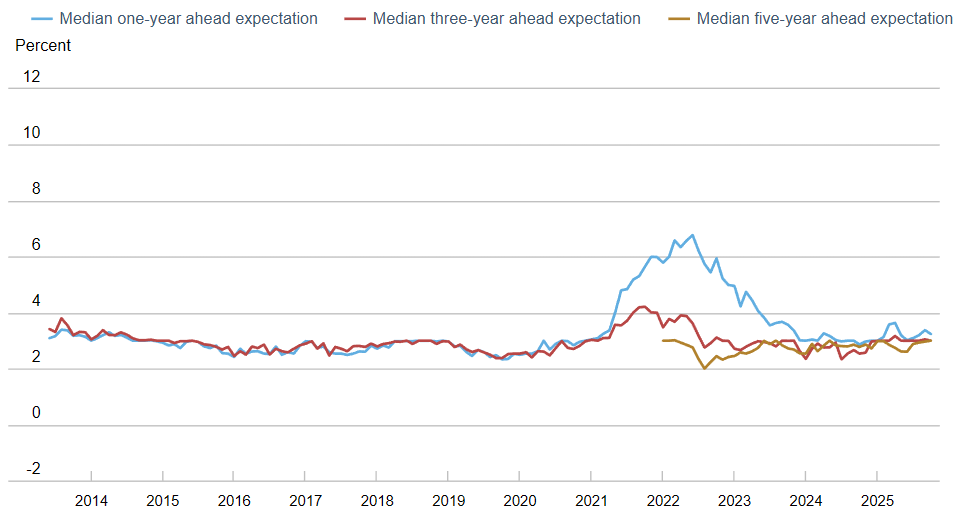
10k Words Equitable Investors November 2025 (2-minute read) Apparently, Confucius did not say "One Picture is Worth Ten Thousand Words" after all. It was an advertisement in a 1920s trade journal for the use of images in ads on the sides of streetcars... We check in on the yield curves in the US and Aus, which have levelled-out or fallen of-late, having steepened through much of CY2025. The IMF's take on economic growth is that the US and Australia will both be growing below the overall global rate this year and next. Australia's latest inflation read was cause for pause. US consumer inflation expectations remain firm. There's not much private sector job growth going on in Australia, while in the US announced job cuts have been peaking. Yet analysts' consensus earnings growth expectations remain in double-digit territory in the US. The "Magnificent 7" has continued to satisfy investors even as the average stock battles on. Private clients have record exposure to equities. Digging deeper, Pure Asset Management highlights takeover premiums for ASX industrials; Carta puts some data around "SAFE" round startup valuations; and Bolton Clarke charts the relative under-investment in Australian aged care infrastucture.
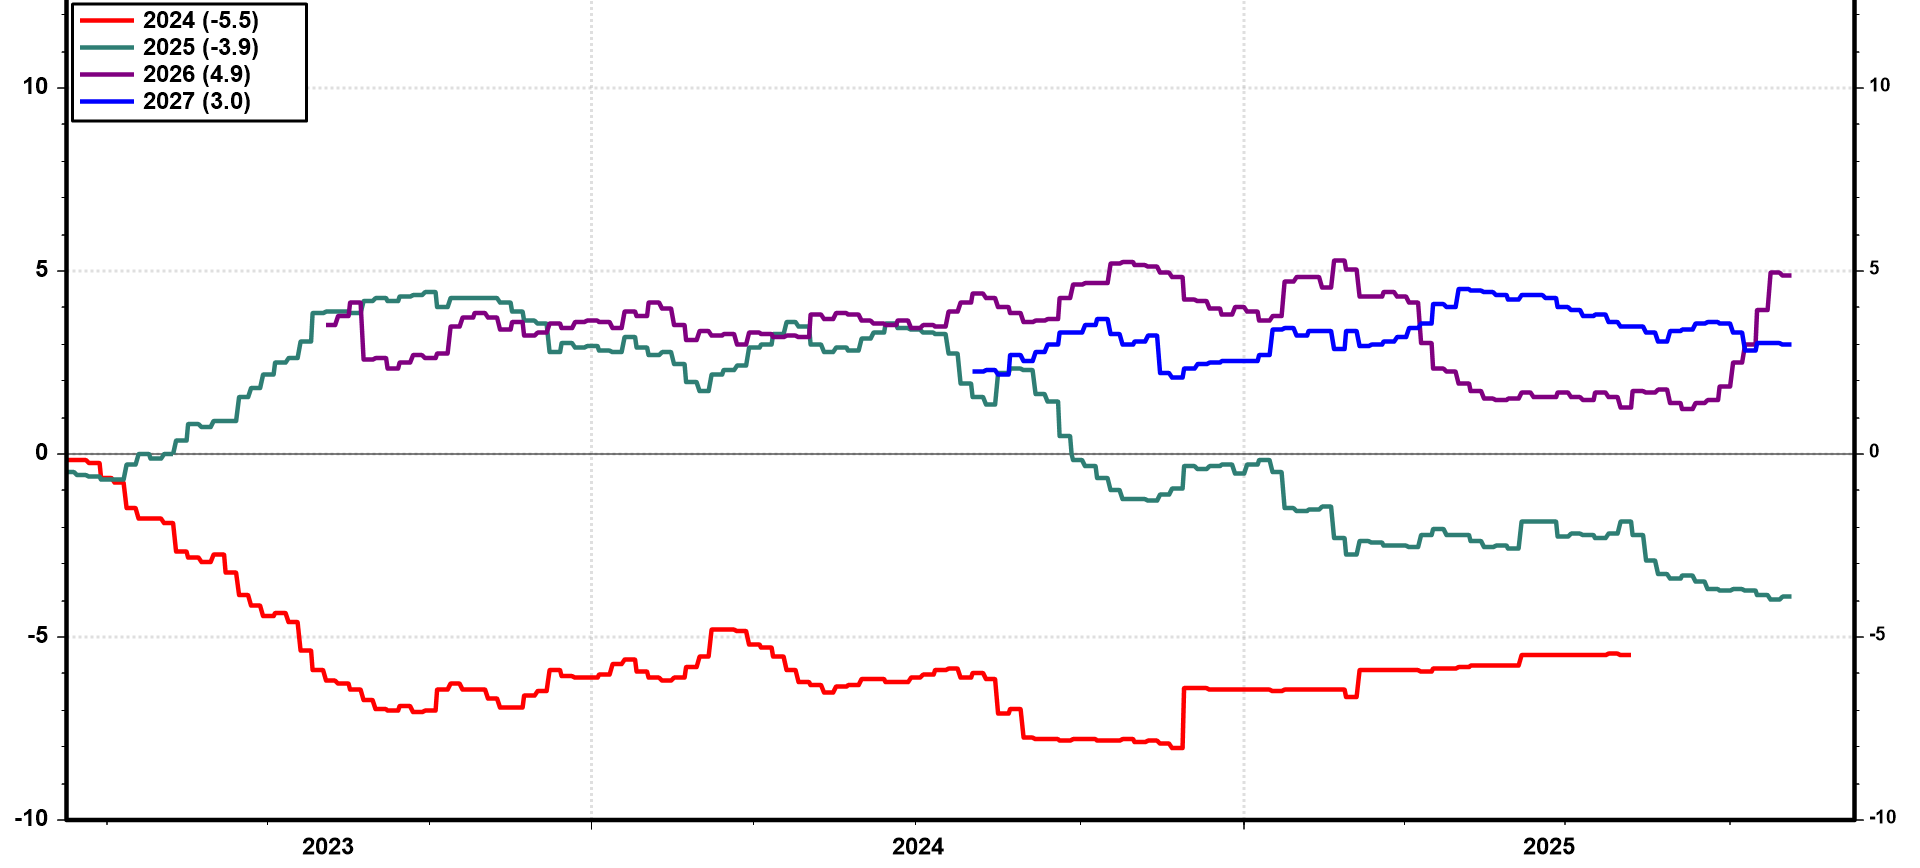
US 10 year - two year government bond yield curve
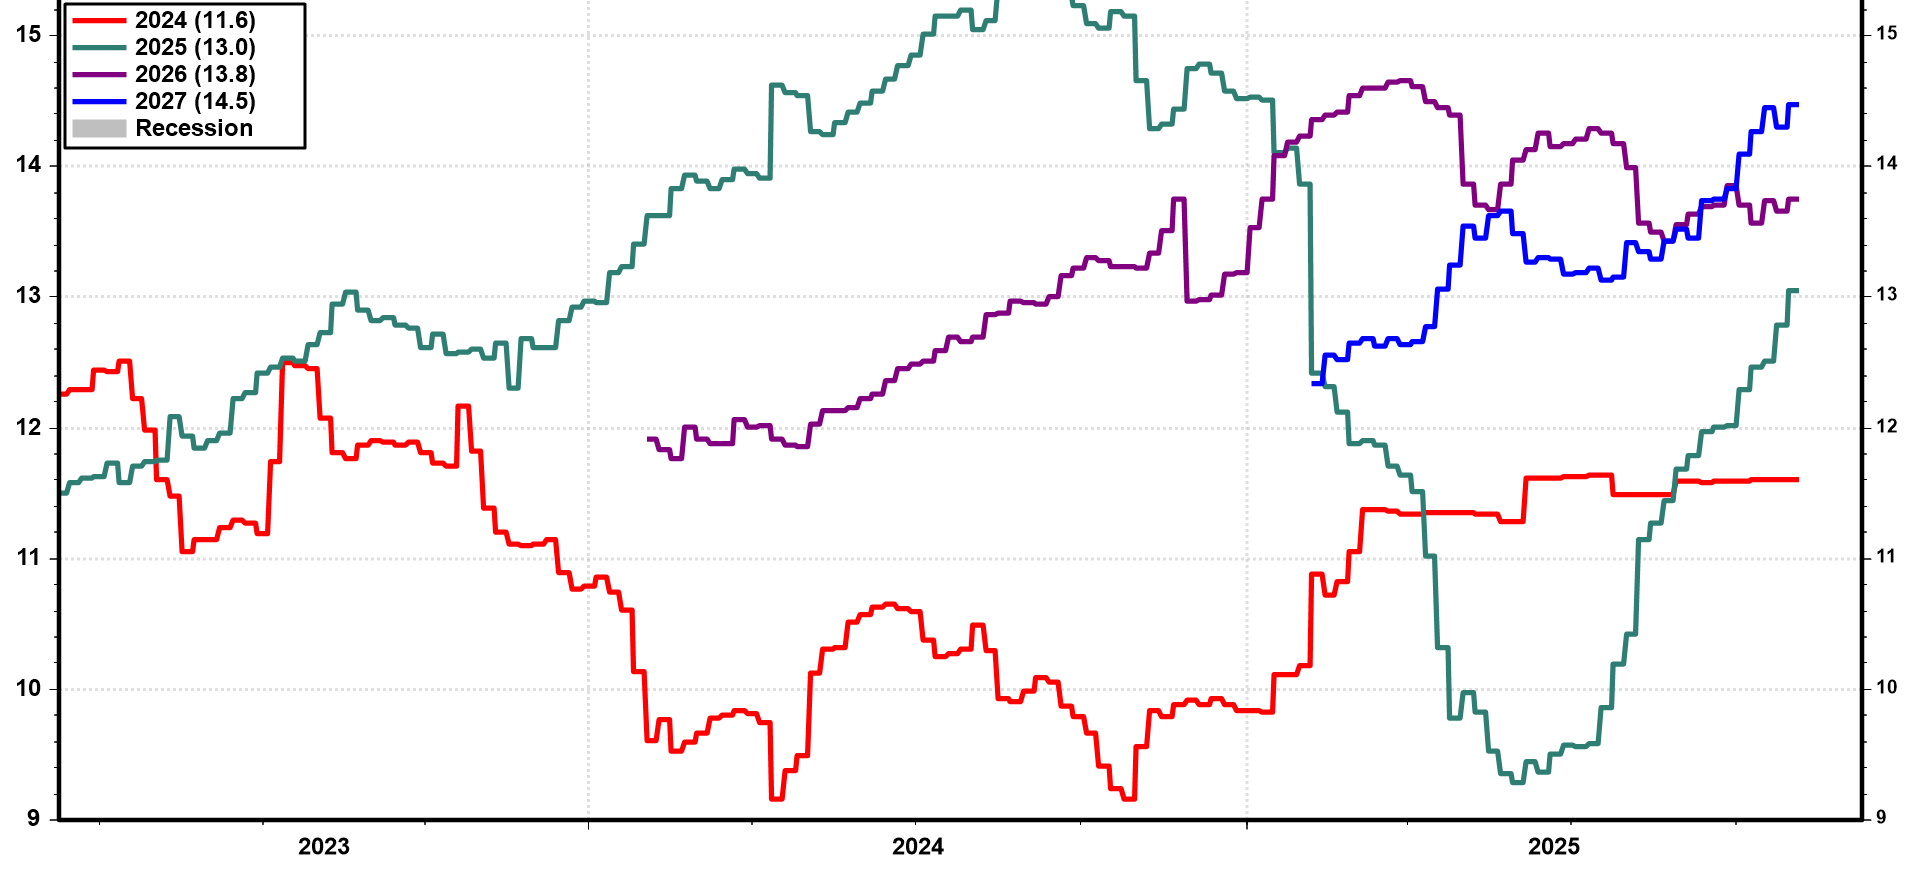
Source: Koyfin Australia 10 year - two year government bond yield curve
Source: Koyfin IMF economic growth projections (October 2025)
Source: IMF Where Australia sits in the IMF economic growth projections (October 2025)
Source: IMF Australian trimmed mean inflation came in at 3.0% in the September quarter
Source: ABS US consumers' inflation expectations
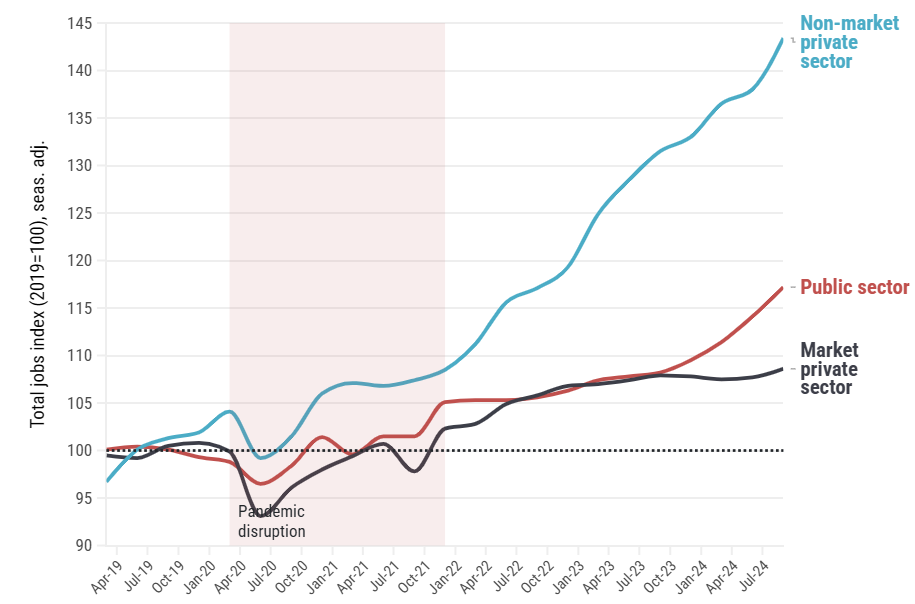
Source: New York Fed Survey of Consumer Expectations Australian private market sector jobs flat while government-linked surge since COVID-19
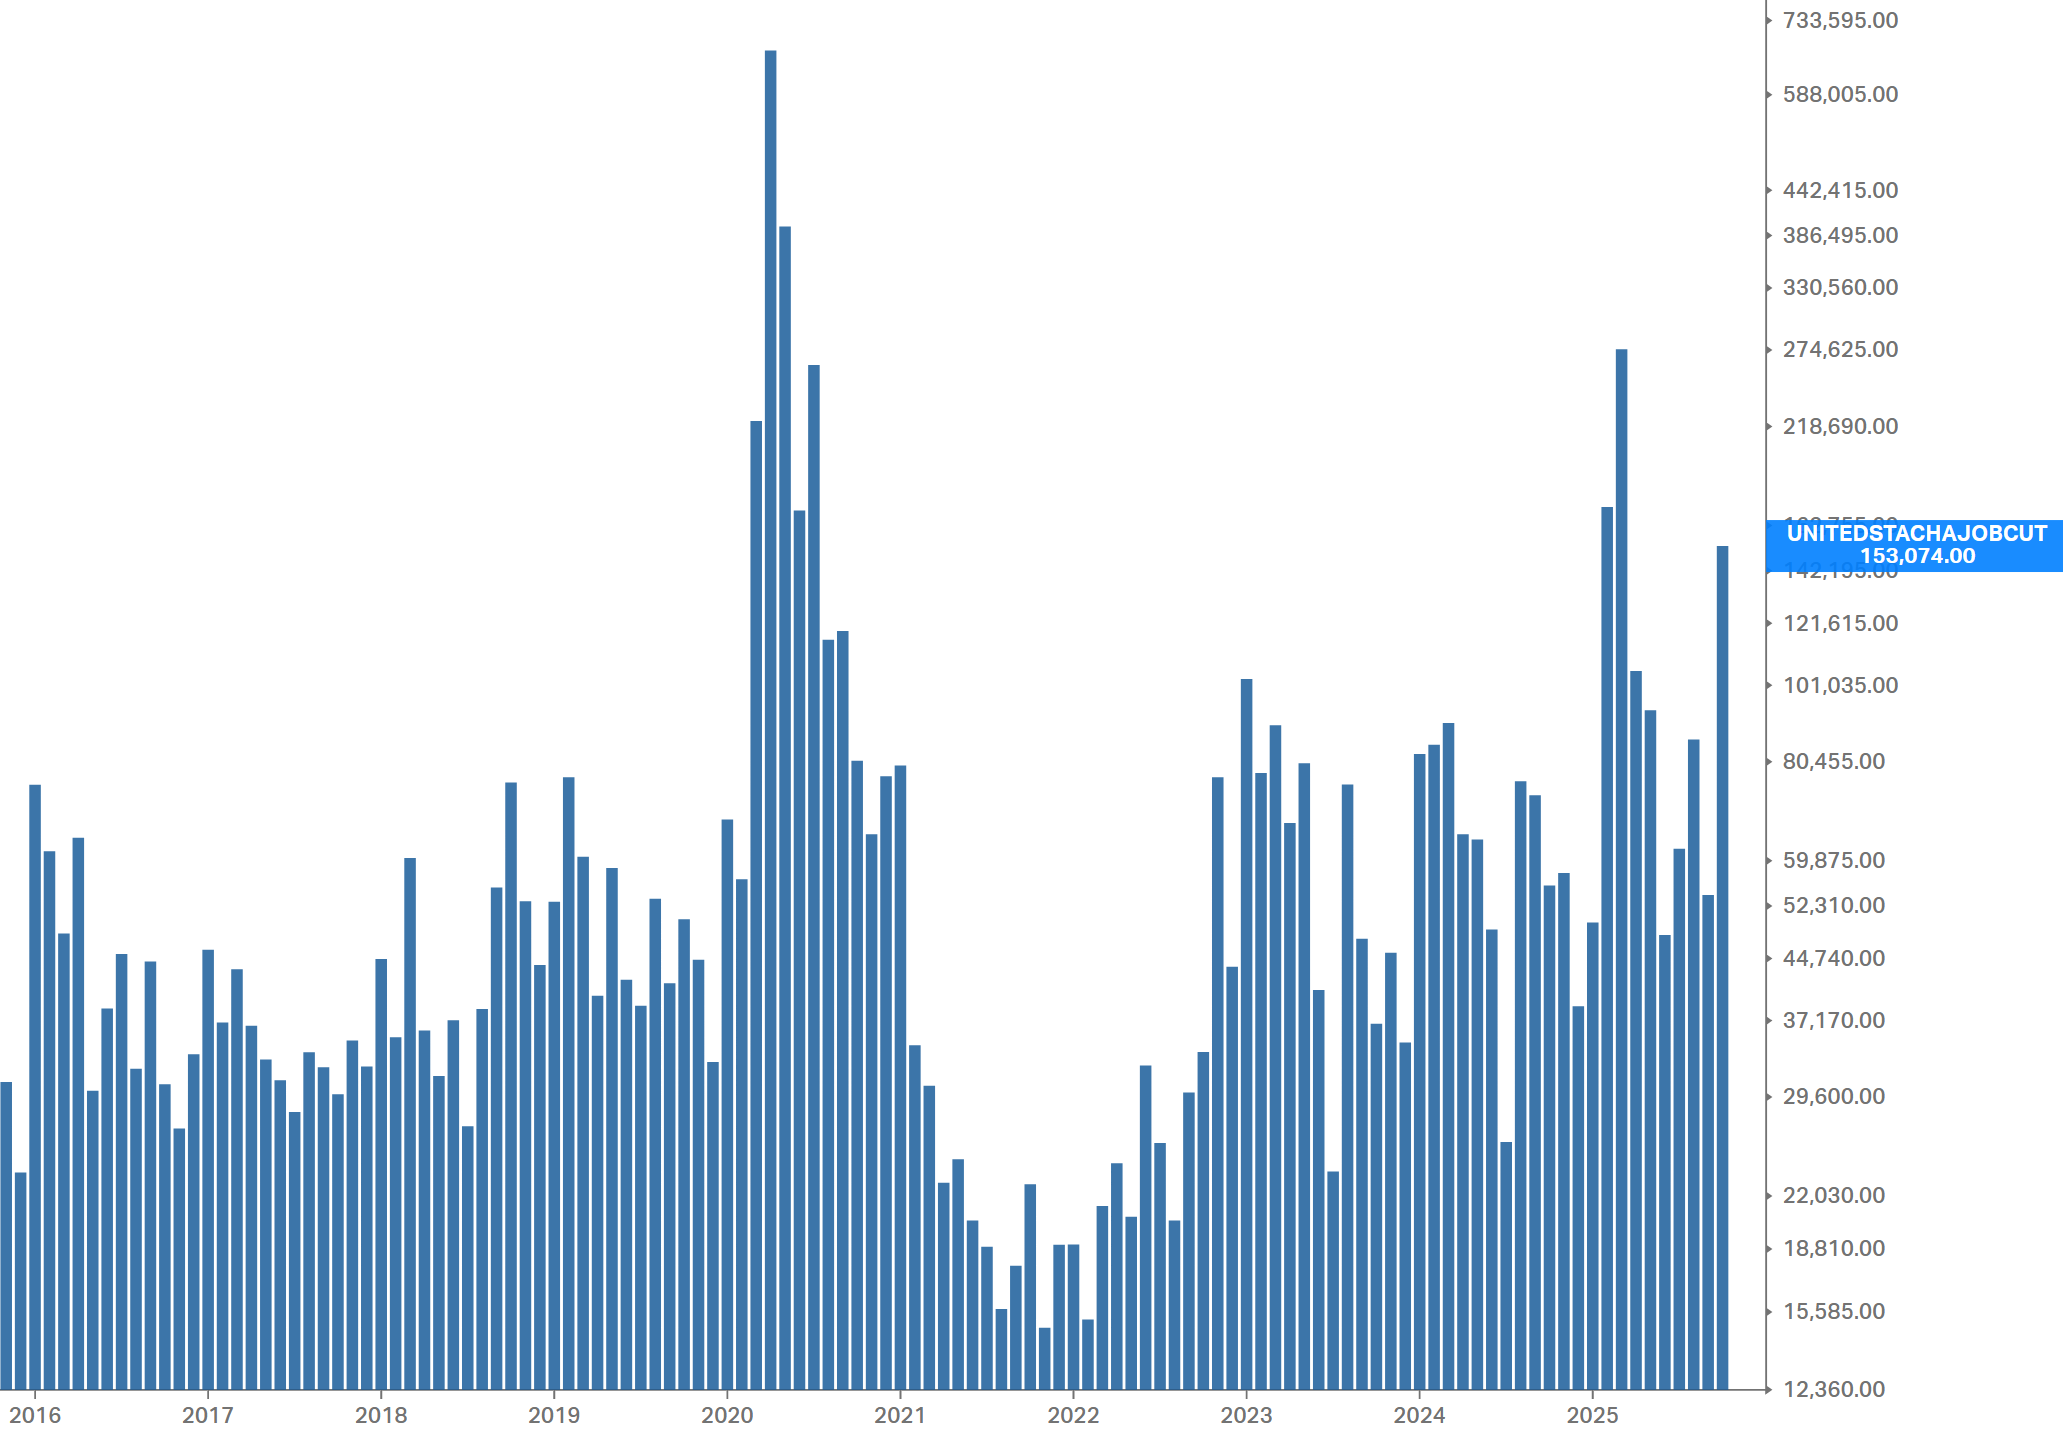
Source: Ai Group Announced job cuts in the US Source: Challenger, Gray & Christmas, Koyfin Australia MSCI consensus annual earnings growth forecasts (weekly) Source: Yardeni Research US MSCI consensus annual earnings growth forecasts (weekly)
Source: Yardeni Research Bank of America private client equity holdings as % of AUM
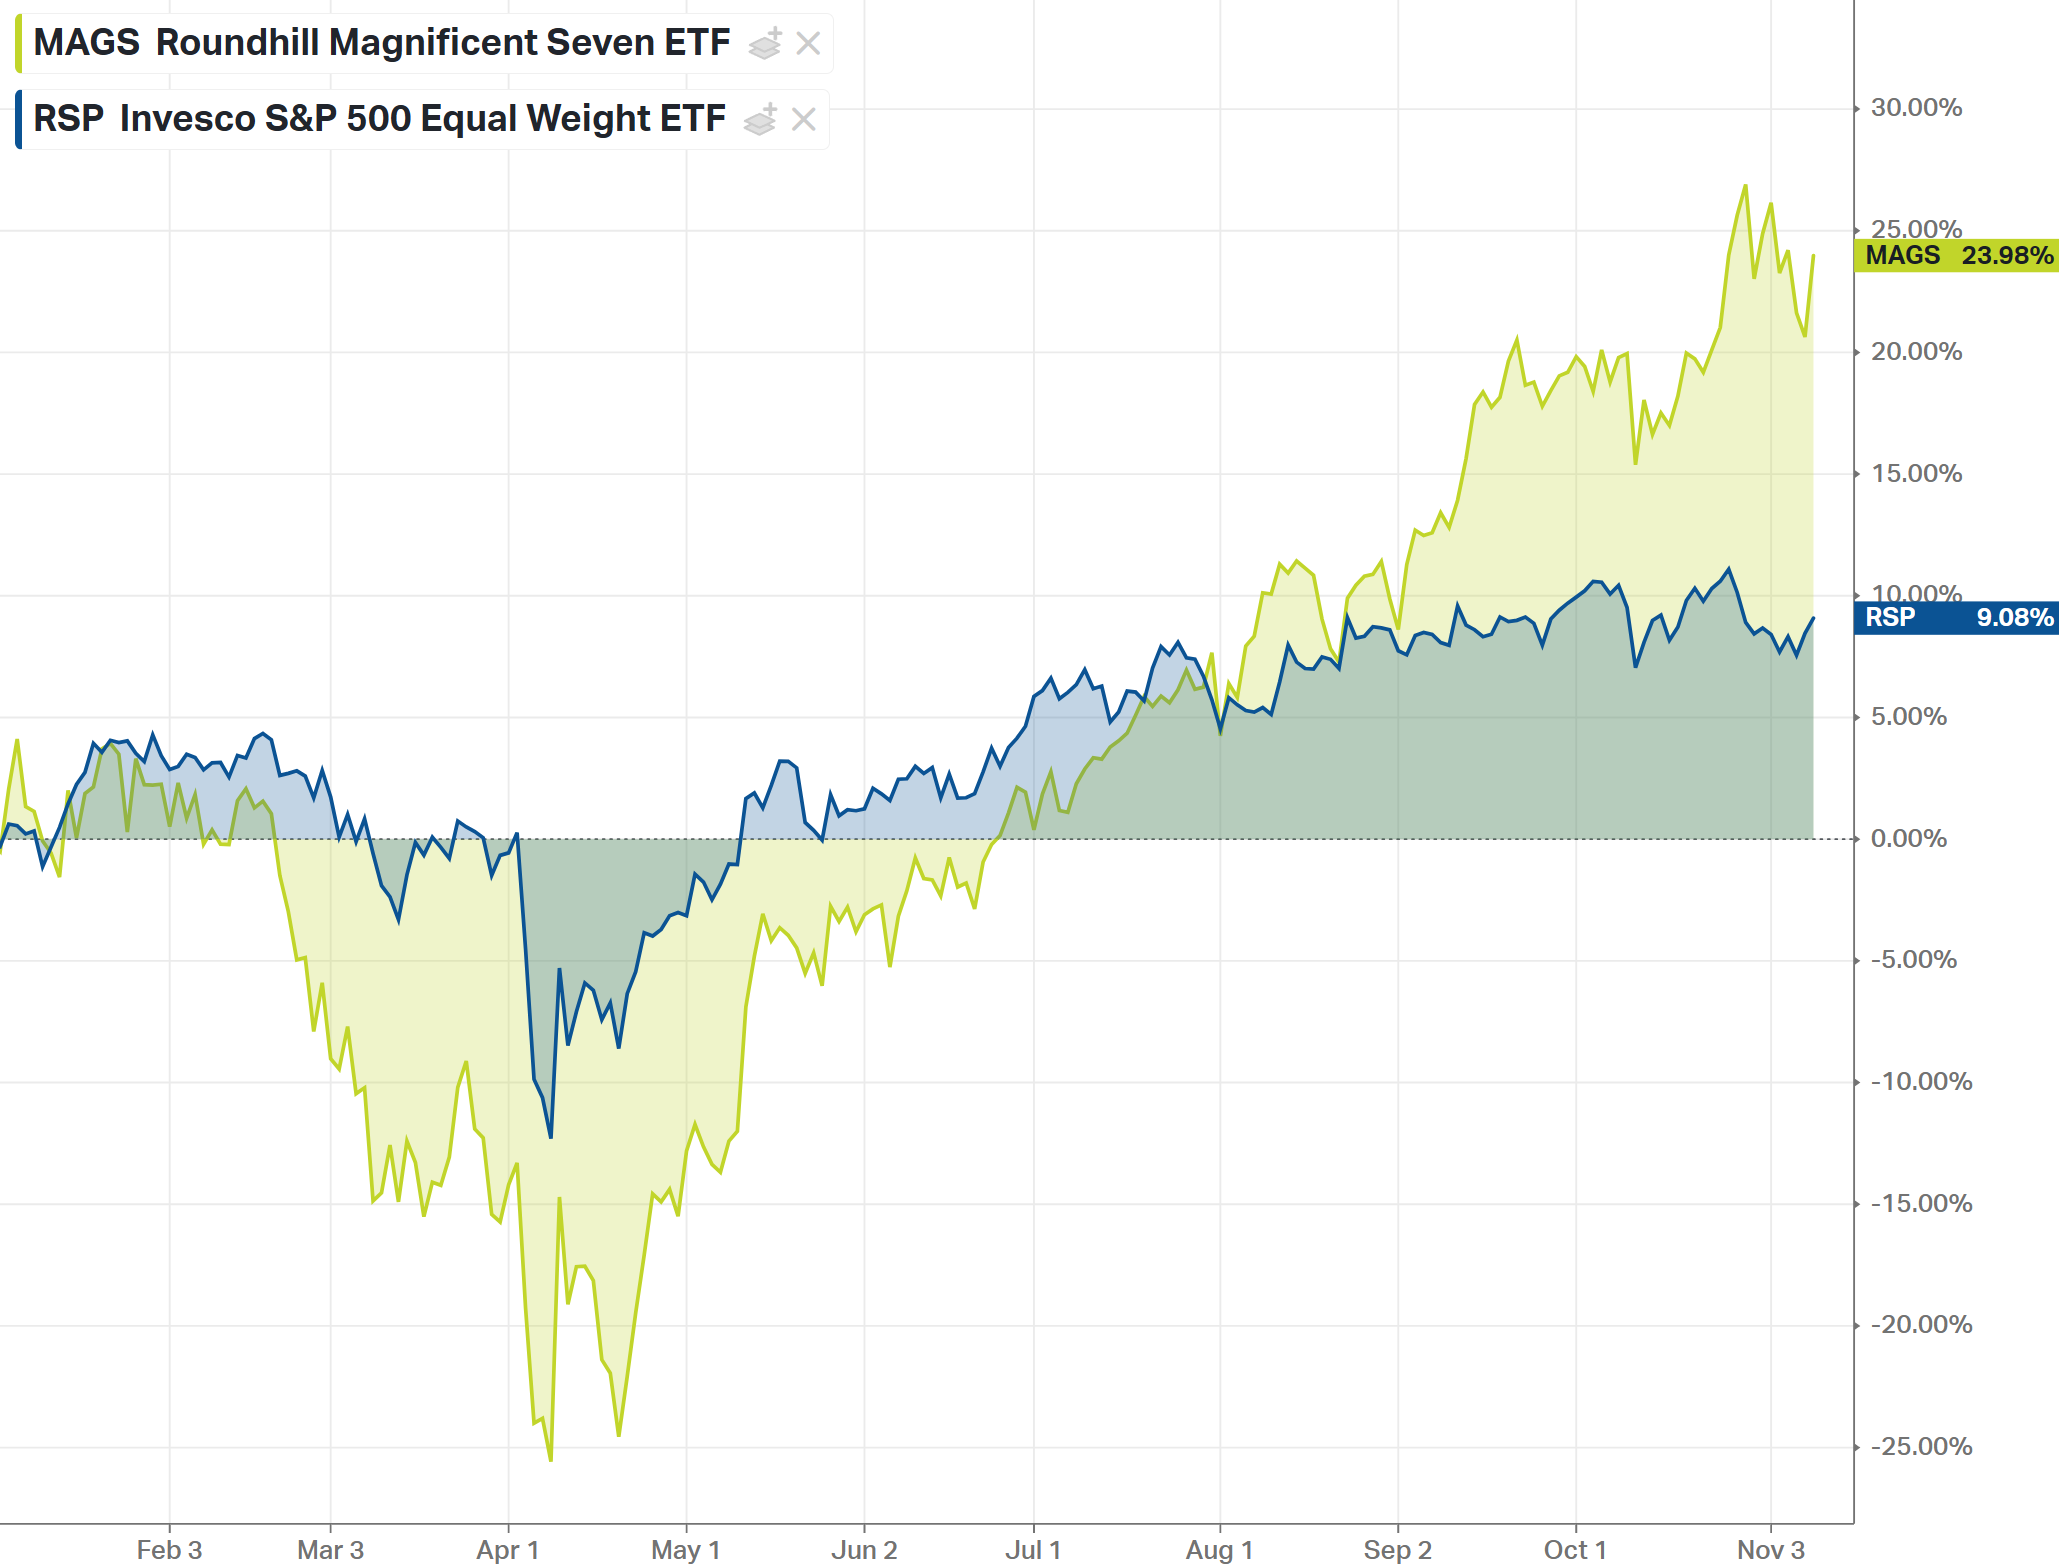
Source: Bank of America Extreme divergence between the "Magnificent Seven" and the average S&P 500 component
Source: Koyfin Small cap takeover premiums 2023 - 2025 (ASX industrials)
Source: Pure Asset Management Distribution of "SAFE" round valuation caps in the US
Source: Carta Aged Care v. Health as a proportion of total building work done in Australia
Source: Bolton Clarke, based on ABS data Funds operated by this manager: Equitable Investors Dragonfly Fund Disclaimer Past performance is not a reliable indicator of future performance. Fund returns are quoted net of all fees, expenses and accrued performance fees. Delivery of this report to a recipient should not be relied on as a representation that there has been no change since the preparation date in the affairs or financial condition of the Fund or the Trustee; or that the information contained in this report remains accurate or complete at any time after the preparation date. Equitable Investors Pty Ltd (EI) does not guarantee or make any representation or warranty as to the accuracy or completeness of the information in this report. To the extent permitted by law, EI disclaims all liability that may otherwise arise due to any information in this report being inaccurate or information being omitted. This report does not take into account the particular investment objectives, financial situation and needs of potential investors. Before making a decision to invest in the Fund the recipient should obtain professional advice. This report does not purport to contain all the information that the recipient may require to evaluate a possible investment in the Fund. The recipient should conduct their own independent analysis of the Fund and refer to the current Information Memorandum, which is available from EI. |


1 Dec 2025 - New Funds on Fundmonitors.com
|
New Funds on FundMonitors.com |
|
Below are some of the funds we've recently added to our database. Follow the links to view each fund's profile, where you'll have access to their offer documents, monthly reports, historical returns, performance analytics, rankings, research, platform availability, and news & insights. |
 |
|||||||||||||||||||||
| SPARX Japan Focus All Cap Australian Feeder Fund - Wholesale Accumulating | |||||||||||||||||||||
|
|||||||||||||||||||||
| View Profile | |||||||||||||||||||||
|
SPARX Japan Focus All Cap Australian Feeder Fund - Wholesale Distributing |
|||||||||||||||||||||
|
|||||||||||||||||||||
|
Want to see more funds? |
|||||||||||||||||||||
|
Subscribe for full access to these funds and over 900 others |

28 Nov 2025 - Markets Brace for Patchy US Data and Policy Uncertainty
|
Markets Brace for Patchy US Data and Policy Uncertainty JCB Jamieson Coote Bonds November 2025 (3-min read) The latest official U.S. macroeconomic data readings, to be imminently released, are front of mind for central banks and global financial markets. The U.S. federal government shutdown has had the effect of delaying several significant data releases on inflation, labour markets and economic activity. However, with the shutdown ending, many anticipate a flurry of data. Global markets are closely watching the imminent release of delayed official macroeconomic statistics from the Bureau of Economic Analysis, the Bureau of Labor Statistics and other key agencies. That said, the scope of the releases is yet to be determined, and some data may never be released, perhaps due to the lack of staffing to conduct surveys and collect information. In the latest developments, the White House has indicated that the October consumer prices index and employment situation reports (which includes the critical figures on the change in non-farm payroll employment) likely will not be released. This leaves policymakers and markets in a quandary - does the U.S. administration have something to hide, or is it simply not possible or feasible to produce retrospective data during the circumstances of a record government shutdown? There are a range of views on what might transpire in the months ahead. Some surmise that the U.S. economy is poised to pick up, with private sector measures of payroll growth slowing but remaining resilient. On this view, sticky services prices and goods reflation are driving persistent upside risks relative to the U.S. Federal Reserve's inflation target. Asset prices are adding fuel to the engine of growth - exuberant stock market and credit valuations are buoying confidence and driving a continuation of U.S. dynamism and exceptionalism. Others highlight that U.S. economic activity remains remarkably concentrated in capital expenditures relating to the AI sector, without which the U.S. is either staring down a recession or has already entered one. Pervasive and widespread downside risks to the labour market are seen as the justification for further policy easing to support a fragile and fractured heartland, with the American dream only barely alive for many lower and middle-class families facing hardship and an uncertain future. Caught somewhere in the middle between these polarised narratives, markets are nervously awaiting official readings on the underlying pulse of U.S. macroeconomic conditions, and the likely policy responses from the Federal Reserve and U.S. Administration. Sound risk management principles suggest that U.S. fiscal and monetary policymakers are likely to discount individual data points on employment growth and core inflation �' even if they prove benign �' in order to sure up consumer and investor confidence. This is an oft-repeated dynamic at times of heightened uncertainty - policymakers tend to focus on their (admittedly subjective and error-prone) interpretation of the underlying momentum and pulse from the data. Markets don't necessarily fare any better. Pricing often over-reacts on immediate attention-grabbing headlines. The unambiguously strong domestic employment figures for October are another manifestation of this phenomenon, and followed an unquestionably weak print in September. The RBA will undoubtedly be encouraged by the fact that, inflation aside, its near-term forecasts have been progressively realised to date, as markets reprice away from further policy easing. As always, the truth is somewhere in the middle of all of these competing forces, and it pays to take out insurance against tail risks being realised. Following the same principles of risk management and least regret alluded to above, investors searching for stability in these uncertain times may wish to consider defensive allocations as part of their investment strategy, while staying grounded in fundamentals and attentive to policy signals to make informed, confident decisions. Funds operated by this manager: CC Jamieson Coote Bonds Active Bond Fund (Class A) , CC Jamieson Coote Bonds Dynamic Alpha Fund |

27 Nov 2025 - Unlocking Indonesia's growth potential: low leverage, rich in resources, and market inflection
|
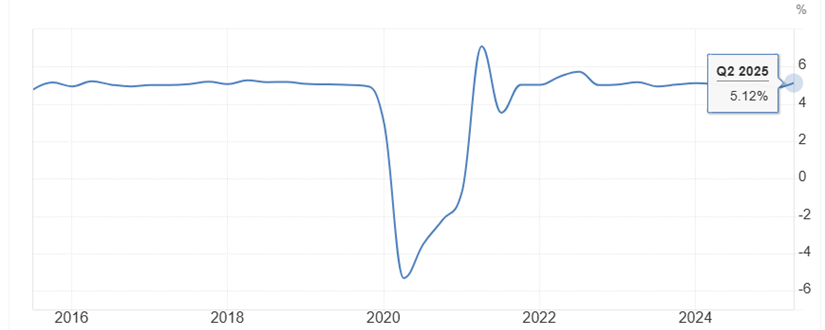
Unlocking Indonesia's growth potential: low leverage, rich in resources, and market inflection in 2026? Ox Capital November 2025 Indonesia's President Prabowo Subianto has an ambitious target to reach 8% annualised GDP growth by 2029. This would represent a sharp acceleration from an annual growth rate of ~5% for most of the past decade. Chart 1: Indonesia's annualised GDP growth
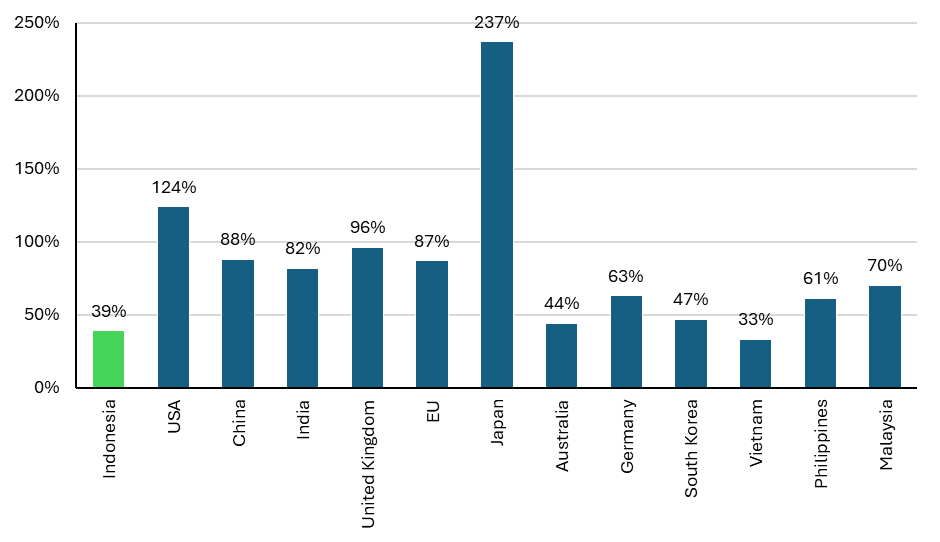
Source: Trading Economics. Unlike other economies, however, Indonesia is one of the least leveraged countries in the world. With government debt-to-GDP below 40%, there is ample room to spend to lift economic growth. Chart 2: 2024 government debt-to-GDP for selected countries
Source: Trading Economics. Typical of years following the election of new Indonesian presidents, government spending and economic activity has been weak in 2025. This presents the potential for a rebound in 2026 as newly installed government ministers and SOE leadership teams begin to execute on key programs and strategies. To support this growth agenda, a new growth-focused Minister of Finance, Purbaya Yudi Sadewa, took office in September 2025. We are beginning to see the initial impacts of his changes to monetary and fiscal policy, with money supply growth jumping from mid-single digits in August to nearly 20% YoY in September. This will likely help to kick-start the economy into next year. Chart 3: BI adjusted M0 growth versus M2 versus loans growth (% YoY)
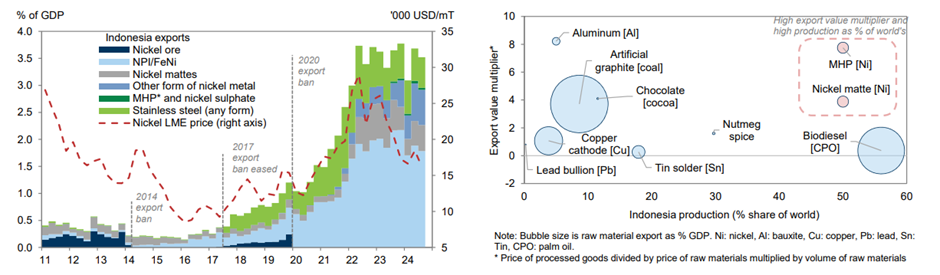
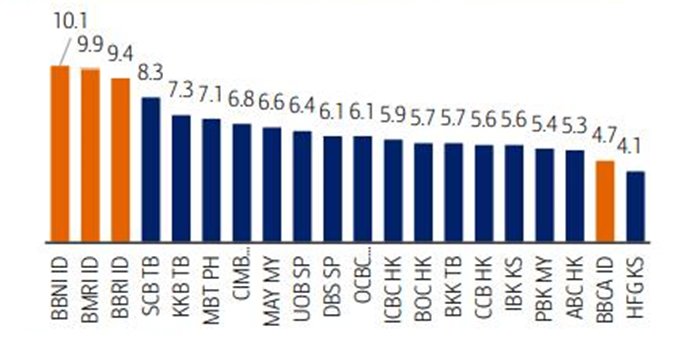
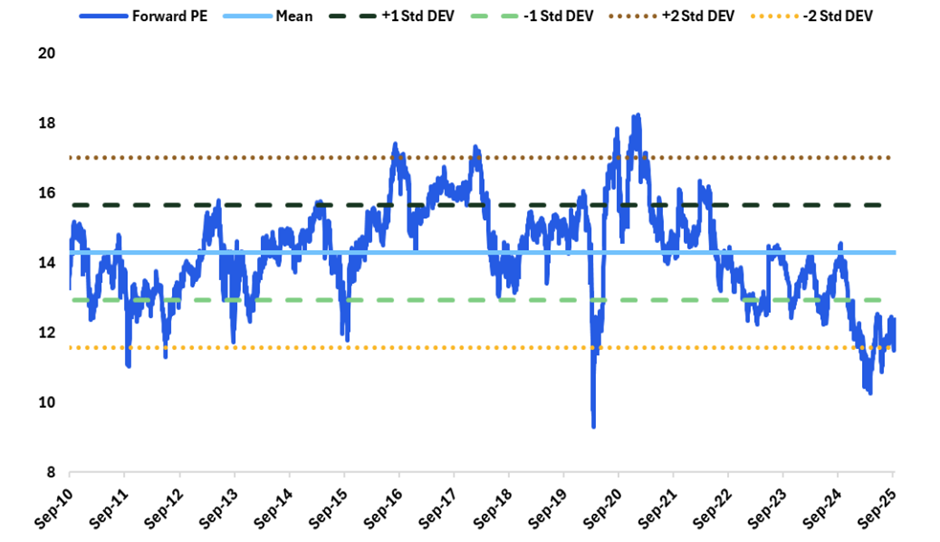
Source: BofA Global Research. In addition to low leverage, Indonesia is rich in natural resources, notably critical minerals such as nickel. In an inflationary world, these resources represent assets to the Indonesian economy which can continue to fetch ever-higher prices, supporting a stronger current account. Chart 4: Indonesia plays a significant role in the global supply of some mineral and agricultural goods Source: International Trade Center, Ministry of Energy and Mineral Resources, USGS, CEIC, Goldman Sachs Global Investment Research. Indonesia's downstream verticalisation strategy to add value to its "rocks in the ground" has dramatically increased the export value of nickel-based products. As it moves up the value chain in different commodities, this can add material upside to the GDP growth outlook. Chart 5: Nickel-related products export value increased ~8-fold since 2013 (left); Indonesia is a major producer of nickel, whose derivatives have high export value multiplier (right) Source: International Trade Center, Haver Analytics, Goldman Sachs Global Investment Research (left); International Trade Center, Ministry of Energy and Mineral Resources, USGS, CEIC, Goldman Sachs Global Investment Research (right). In light of temporary sluggishness in the domestic economy in 2025, we are finding highly attractive opportunities to own leading quality franchises in Indonesia. Some of these companies are generating dividend yields above 10% and delivering ROE approaching 20%, all while trading at discounted valuations. Chart 6: Top yielding large cap APAC banks - FY25E yield (%) Source: BofA Global Research. Indonesia represents an exciting emerging economy, with a huge population of more than 285 million, rich in sought-after resources. This can support strong economic activity and business earnings into the future, particularly in an inflationary world. Trading at depressed levels of <12x forward P/E, nearly 2 standard deviations below the 15-year mean, and with strong dividend yields in leading larger corporates, now is the time for investors to reconsider Indonesia. These kinds of valuations do not come around often! Chart 7: Indonesia MSCI Index forward P/E Source: Citi Research, Bloomberg. Funds operated by this manager:
|


26 Nov 2025 - Glenmore Asset Management - Market Commentary
|
Market Commentary - October Glenmore Asset Management November 2025 (1 min read) Global equity markets continued their strong run in October. US indices led the charge, buoyed by sustained strength in the 'Magnificent Seven', which saw the NASDAQ and S&P 500 rise +4.7% and 2.3%, respectively. This included Nvidia's market cap surpassing the US$5 trillion valuation. Interestingly, approximately 20% of the S&P 500's YTD increase has been attributable to Nvidia. Outside of the US, the FTSE and Euro Stoxx 50 followed suit, rising +3.9% and 2.4%, respectively. Domestic markets were more muted than their international counterparts, with the ASX All Ordinaries Accumulation index rising +0.5%. During the month, inflation figures for the September 2025 quarter came in at 3.0% (YoY) vs 2.7% as at the end of the June 2025 quarter. These results were at the top-end of the RBA's target band (2-3%) and higher than expectations. As a result, financial markets have further tempered their rate cut expectations and are now factoring in less than 1 additional rate cut over the next 12 months. In bond markets, the US 10-year bond yield declined -7 basis points (bp) to 4.08%, whilst its Australian counterpart was largely unchanged at 4.30%. The Australian dollar declined marginally, closing at US$0.655, implying a decrease of 0.7 cents. Funds operated by this manager: |

25 Nov 2025 - Maybe it's not "just like1999"

24 Nov 2025 - Manager Insights | Magellan Investment Partners
|
Chris Gosselin speaks with Alan Pullen from Magellan Investment Partners about the philosophy behind the Magellan Global Opportunities Fund. Alan explains how the team focuses on high-quality global businesses, disciplined valuation, and long-term investing-especially important amid today's AI-driven market volatility.
Funds operated by this manager: Magellan Global Fund (Open Class Units) ASX:MGOC , Magellan Infrastructure Fund , Magellan Global Opportunities Fund No.2 , Magellan Infrastructure Fund (Unhedged) , Magellan Global Fund (Hedged) , Magellan Core Infrastructure Fund , Magellan Global Opportunities Fund Active ETF (ASX:OPPT) |