NEWS
23 Aug 2022 - Performance Report: Cyan C3G Fund
Report Date | |
Manager | |
Fund Name | |
Strategy | |
Latest Return Date | |
Latest Return | |
Latest 6 Months | |
Latest 12 Months | |
Latest 24 Months (pa) | |
Annualised Since Inception | |
Inception Date | |
FUM (millions) | |
Fund Overview | Cyan C3G Fund is based on the investment philosophy which can be defined as a comprehensive, clear and considered process focused on delivering growth. These are identified through stringent filter criteria and a rigorous research process. The Manager uses a proprietary stock filter in order to eliminate a large proportion of investments due to both internal characteristics (such as gearing levels or cash flow) and external characteristics (such as exposure to commodity prices or customer concentration). Typically, the Fund looks for businesses that fit one or more of the following criteria: a) under researched, b) fundamentally undervalued, c) have a catalyst for re-rating. The Manager seeks to achieve this investment outcome by actively managing a portfolio of Australian listed securities. When the opportunity to invest in suitable securities cannot be found, the manager may reduce the level of equities exposure and accumulate a defensive cash position. Whilst it is the company's intention, there is no guarantee that any distributions or returns will be declared, or that if declared, the amount of any returns will remain constant or increase over time. The Fund does not invest in derivatives and does not use debt to leverage performance. However, companies in which the Fund invests may be leveraged. |
Manager Comments | The Cyan C3G Fund has a track record of 8 years and has outperformed the ASX Small Ordinaries Total Return Index since inception in August 2014, providing investors with an annualised return of 11.96% compared with the index's return of 6.64% over the same period. On a calendar year basis, the fund has only experienced a negative annual return once in the 8 years since its inception. Over the past 12 months, the fund's largest drawdown was -25.43% vs the index's -23.88%, and since inception in August 2014 the fund's largest drawdown was -36.45% vs the index's maximum drawdown over the same period of -29.12%. The fund's maximum drawdown began in October 2019 and lasted 1 year and 4 months, reaching its lowest point during March 2020. The fund had completely recovered its losses by February 2021. The Manager has delivered these returns with 1.03% more volatility than the index, contributing to a Sharpe ratio which has fallen below 1 five times over the past five years and which currently sits at 0.64 since inception. The fund has provided positive monthly returns 86% of the time in rising markets and 38% of the time during periods of market decline, contributing to an up-capture ratio since inception of 65% and a down-capture ratio of 65%. |
More Information |
23 Aug 2022 - Are the businesses enjoying stock price rises today also the winners of tomorrow?
Are the businesses enjoying stock price rises today also the winners of tomorrow? Insync Fund Managers July 2022 Lately we are all experiencing one tectonic event after the next. Foundations of the political and economic framework that have dominated much of the world since the 1980s are now being challenged; the impacts on globalisation, the questioning of the USD central role, and previously deeply embedded structural relationships in the energy markets to name a few. Our approach is far less dependent than our peers are on these issues, including inflation and interest rates. The jury is still out on whether inflation will be a temporary or a longer-term phenomenon. Covid and the tragic invasion of Ukraine have created significant commodity, energy, and labour mobility pressures. Companies that:
These are the required factors for a business to continue delivering healthy returns in real terms and are thus the same attributes Insync seeks. Most companies are not able to do this. Those companies possessing the most levers to pull going into an inflationary period are also the most likely to protect and even thrive for their investors. There will likely be tougher times ahead, quality growth investors should find themselves better positioned than most to weather the storm and come out substantially ahead. Why earnings power is crucial A shy, humble investor living on a suburban street in a small mid-western US city is often cited for his quips. "In the short-term markets are a voting machine. In the long-term it's a weighing machine" Over shorter periods sentiment in markets can shift wildly depending on the narrative of the day. This is driven by perceptions of investors trying to gauge where we are in the economic cycle, the path of inflation and interest rates, the impact of a geopolitical crisis, and what style of investing will be best equipped for the future. These are impossible to predict with any degree of certainty or to do so consistently. The one thing that is more certain over time is that in the long-term, share prices follow the consistent growth in the earnings of a business. We know that the most profitable companies remain profitable even ten years later fuelled by the enduring, large megatrends. Megatrends are so predictable you can set your watch by them. This is whether it is the rising importance of the Gen Z'ers, the acceleration in the number of people aged 70+, GDP+ growth in spending on skin and beauty, or the insatiable desire to spend on experiences. A portfolio of the most profitable companies tied to megatrends provides consistency in earnings leading to strong stock price returns. They are also mostly impervious to interest rate settings, the state of the economy or current commodity prices. 3 portfolio examples of why Earnings Growth is good for investors The evidence shows it all. Here are 3 companies in our portfolio. The coloured line in each graph is the path of earnings over the past 10 years. The white line is the share price performance. Observe the strong correlation between the earnings growth and share price performance. From time to time the two lines deviate based on an 'event', as is the case now. Obviously, present prices present an outstanding opportunity to invest.
These highly profitable businesses benefitting from Insync's identified megatrends have become even more attractive due to recent price falls. This is because their ongoing and established earnings power remains intact. Such excellent buying opportunities do not often present themselves. Funds operated by this manager: Insync Global Capital Aware Fund, Insync Global Quality Equity Fund Disclaimer |
22 Aug 2022 - New Funds on Fundmonitors.com
New Funds on FundMonitors.com |
Below are some of the funds we've recently added to our database. Follow the links to view each fund's profile, where you'll have access to their offer documents, monthly reports, historical returns, performance analytics, rankings, research, platform availability, and news & insights. |
|
|||||||||||||||||||
IFP Global Franchise Fund | |||||||||||||||||||
|
|||||||||||||||||||
Macquarie Capital Stable Fund |
|||||||||||||||||||
|
|||||||||||||||||||
View Profile | |||||||||||||||||||
Macquarie Dynamic Bond Fund |
|||||||||||||||||||
|
|||||||||||||||||||
Macquarie Real Return Opportunities Fund |
|||||||||||||||||||
|
|||||||||||||||||||
View Profile | |||||||||||||||||||
Want to see more funds? |
|||||||||||||||||||
Subscribe for full access to these funds and over 700 others |
22 Aug 2022 - 10k Words
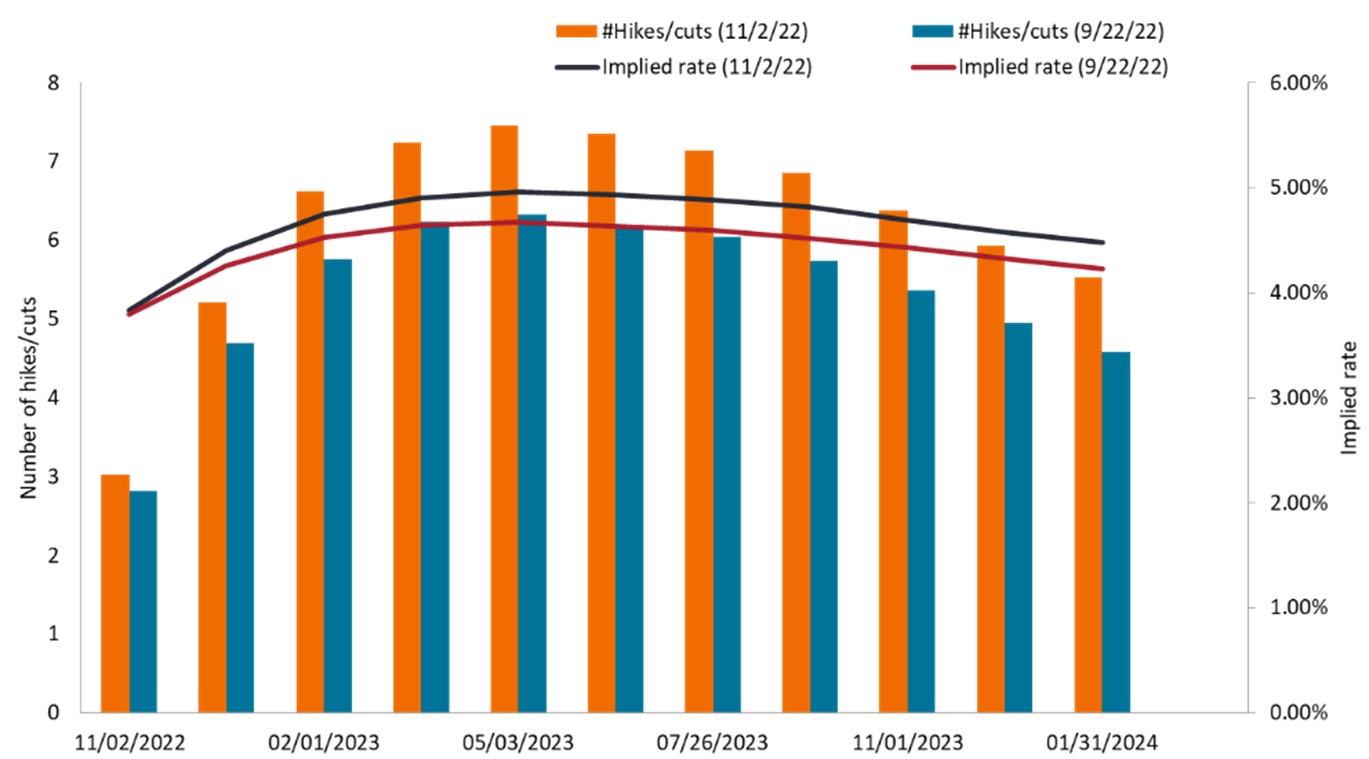
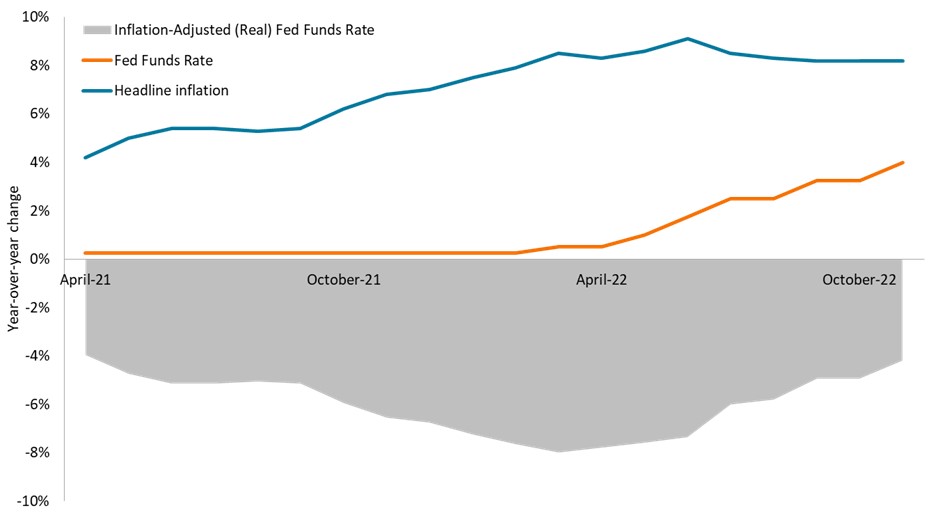
10k Words Equitable Investors August 2022 It is almost compulsory to discuss interest rates and inflation, so the first charts this time around give us inflation for advanced economies and Australia, via the RBA, then US yield curve inversion and inflation-adjusted interest rates, courtesy of Bloomberg and Axios. The same sources have served up some charts on the strength of the US job market. Then we get into the tech sector with CB Insights mapping out billion-dollar acquisitions while Equitable Investors compares the dollar amount of stock compensation against operating cash flow for Amazon and Atlassian. The global IPO market is down 74% year-to-date in CY2022 and the Australasian component of that market is down 88%, using dealogic data. Finally, we return to Bloomberg and its table highlighting the world-beating frequency with which Australasian airlines have been cancelling flights.
Inflation in advanced economies Source: RBA US yield curve v equities Source: Bloomberg 5 year inflation-adjusted interest rate (US) Source: Axios No. of US unemployed for 15 weeks or more Source: Axios Change in employed from US payroll data Source: Bloomberg Billion dollar acquisitions Source: CB Insights Amazon's stock compensation relative to its operating cash flow Source: Equitable Investors, TIKR Atlassian's stock compensation relative to its operating cash flow Source: Equitable Investors, TIKR Total Global IPOs by quarter in US dollars
Source: WSJ, Dealogic Total Australasian IPOs by quarter in US dollars
Source: WSJ, Dealogic Australasian airlines cancelling flights most frequently Source: Bloomberg August Edition Funds operated by this manager: Equitable Investors Dragonfly Fund Disclaimer Nothing in this blog constitutes investment advice - or advice in any other field. Neither the information, commentary or any opinion contained in this blog constitutes a solicitation or offer by Equitable Investors Pty Ltd (Equitable Investors) or its affiliates to buy or sell any securities or other financial instruments. Nor shall any such security be offered or sold to any person in any jurisdiction in which such offer, solicitation, purchase, or sale would be unlawful under the securities laws of such jurisdiction. The content of this blog should not be relied upon in making investment decisions. Any decisions based on information contained on this blog are the sole responsibility of the visitor. In exchange for using this blog, the visitor agree to indemnify Equitable Investors and hold Equitable Investors, its officers, directors, employees, affiliates, agents, licensors and suppliers harmless against any and all claims, losses, liability, costs and expenses (including but not limited to legal fees) arising from your use of this blog, from your violation of these Terms or from any decisions that the visitor makes based on such information. This blog is for information purposes only and is not intended to be relied upon as a forecast, research or investment advice. The information on this blog does not constitute a recommendation, offer or solicitation to buy or sell any securities or to adopt any investment strategy. Although this material is based upon information that Equitable Investors considers reliable and endeavours to keep current, Equitable Investors does not assure that this material is accurate, current or complete, and it should not be relied upon as such. Any opinions expressed on this blog may change as subsequent conditions vary. Equitable Investors does not warrant, either expressly or implied, the accuracy or completeness of the information, text, graphics, links or other items contained on this blog and does not warrant that the functions contained in this blog will be uninterrupted or error-free, that defects will be corrected, or that the blog will be free of viruses or other harmful components. Equitable Investors expressly disclaims all liability for errors and omissions in the materials on this blog and for the use or interpretation by others of information contained on the blog |
22 Aug 2022 - Investment Perspectives: 12 charts we're thinking about right now
19 Aug 2022 - Hedge Clippings |19 August 2022
|
|
Hedge Clippings | Friday, 19 August 2022
This week in review: Scomo..... what was he thinking? Let's not go there... Neither in our view should further time and money be wasted on having an inquisition. It would seem nothing Scomo did was actually illegal, but the lack of transparency defies logic, and will define Scomo for ever. If nothing else, it at least shows the dangers of having a popularly elected President - if Donald hasn't already proven that. Moving onwards and upwards - hopefully in more ways than one... Markets bounced in July, with the ASX200 Accumulation Index rising 5.75%, after falling 8.77% in a horror June, while the S&P500 bounced 9.22% to make up for its June fall of 8.25%. Funds generally enjoyed the ride, with 80% of the funds on FundMonitors.com having reporting their July results, with those hit hardest in June enjoying the best of July. Having been on the nose in June (and if it comes to that for the past 6-8 months) growth stocks, and the funds investing in them, were the big winners, although in many cases they have a long way to catch up to their previous highs. There's no doubt there was some irrational selling, particularly in the small/mid cap space, as stretched valuations, gearing, year end tax selling etc., saw some companies trading close to or below cash backing. While we (and others) tend to focus on "performance" and top performing funds, there's a risk doing so at the expense of looking at risk and drawdowns. When the ASX200 fell 8.77% in June, 72% of equity based funds outperformed (i.e. fell less than the index). In July's market rally of 5.75%, only 40% of equity based funds managed to outperform the ASX200. Over the past few weeks we have been publishing our "Spotlight" series of articles exploring quantitative assessment of funds' returns to create a top performing portfolio. For those of you who have been following these articles, chasing top performing funds over the short term (say 1 year) is not the solution. The problem is that taking a longer term view (say 3-5 years) involves a variety of economic and market conditions, when funds with different styles, (for example growth or value) and strategies, perform very differently. In the past 3 years alone we've had 2 "bear" or negative equity markets. Extend that further, and the Global Equity Index benchmark (effectively the MSCI) was in negative territory on a cumulative basis from late 1999 through to the start of 2014 as shown by the chart below of Platinum's International Share Fund (blue) vs. the Global Equity Index (red), showing the effects of the dot com bubble of the late 1990s, the resultant "tech wreck" in 2000, and then the GFC in 2007-08. By comparison, the recent downturn (so far) puts things in perspective.
There's a lesson in this for markets - a bubble always bursts, and the bigger or longer the bubble, the greater the burst. As for fund selection the lesson is equally clear: Protecting the downside through active risk management should, over time, result in good long-term performance. This week Hedge Clippings attended the Portfolio Construction Forum, as always expertly managed and MC'd by Graham Rich, with the addition of a variety of excellent speakers and panels covering (as one would expect) Portfolio Construction. The underlying theme over the two days was "The future ain't what it used to be". Given the above chart showing the variable market conditions experienced over the past 25 years, it's no surprise that asset allocation decisions (equities, bonds, alternatives, etc) are vital, but that requires a crystal ball. Having set asset allocations according to forward looking projections, the actual stock (or in our case fund) selection for a diversified portfolio is made based on backward looking history, namely the fund's track record. Nearly every advisor and fund manager we know (understandably) relies on past performance, but if "the future ain't what it used to be" is correct, it doesn't make fund selection, or portfolio construction, any easier! Of the many speakers at the forum, one of the most insightful was Marko Papic, Partner and Chief Strategist of the Clocktower Group in Santa Monica, who challenged the view often held in Australia that conflict over Taiwan was inevitable. His view (as my takeaway) was that the cost to China, and not just in economic terms, would far outweigh the strategic or geographic benefit of a military outcome. We hope he's correct, otherwise the future's not only not going to be what it was, but it's looking decidedly uncomfortable. News & Insights New Funds on FundMonitors.com 4D podcast: interest rates, inflation and infrastructure | 4D Infrastructure A look at the poster child for Owner-Managed | Airlie Funds Management Is the sky really falling in? | Insync Fund Managers |
|
July 2022 Performance News Digital Asset Fund (Digital Opportunities Class) Delft Partners Global High Conviction Strategy Glenmore Australian Equities Fund |
|
If you'd like to receive Hedge Clippings direct to your inbox each Friday
|
19 Aug 2022 - Performance Report: Digital Asset Fund (Digital Opportunities Class)
Report Date | |
Manager | |
Fund Name | |
Strategy | |
Latest Return Date | |
Latest Return | |
Latest 6 Months | |
Latest 12 Months | |
Latest 24 Months (pa) | |
Annualised Since Inception | |
Inception Date | |
FUM (millions) | |
Fund Overview | The Fund offers a choice of three investment classes, each of which adopts a different investment strategy: - The Digital Opportunities Class identifies and trades low risk arbitrage opportunities between different exchanges and a number of digital assets; - The Digital Index Class tracks the performance of a basket of digital assets; - The Bitcoin Index Class tracks the performance of Bitcoin. Digital Opportunities Class: This class appeals to investors seeking an active exposure to the digital asset markets with no directional bias. The Digital Opportunities Class employs a high frequency inspired Market Neutral strategy trading 24/7 which uses a systematic approach designed to offer uncorrelated returns to the underlying highly volatile cryptocurrency markets. The strategy systematically exploits low-risk arbitrage opportunities across the most liquid and active digital asset markets on the most respected exchanges. When appropriate the Fund may obtain leverage, including through borrowing cash, securities and other instruments, and entering into derivative transactions and repurchase agreements. DAFM has a currency hedging policy in place for the Units in the Fund. Units in the Fund will be hedged against exposure to assets denominated in US dollars through a trading account with spot, forwards and options as directed by DAFM. |
Manager Comments | The Digital Asset Fund (Digital Opportunities Class) has a track record of 1 year and 3 months and therefore comparison over all market conditions and against its peers is limited. However, the fund has outperformed the S&P Cryptocurrency Broad Digital Market Index since inception in May 2021, providing investors with an annualised return of 44.42% compared with the index's return of -46.91% over the same period. Over the past 12 months, the fund hasn't had any negative monthly returns and therefore hasn't experienced a drawdown. Over the same period, the index's largest drawdown was -71.98%. Since inception in May 2021, the fund's largest drawdown was 0% vs the index's maximum drawdown over the same period of -71.98%. The Manager has delivered these returns with 54.96% less volatility than the index, contributing to a Sharpe ratio for performance over the past 12 months of 3.6 and for performance since inception of 1.68. The fund has provided positive monthly returns 100% of the time in rising markets and 100% of the time during periods of market decline, contributing to an up-capture ratio since inception of 6% and a down-capture ratio of -49%. |
More Information |
19 Aug 2022 - Performance Report: Bennelong Long Short Equity Fund
Report Date | |
Manager | |
Fund Name | |
Strategy | |
Latest Return Date | |
Latest Return | |
Latest 6 Months | |
Latest 12 Months | |
Latest 24 Months (pa) | |
Annualised Since Inception | |
Inception Date | |
FUM (millions) | |
Fund Overview | In a typical environment the Fund will hold around 70 stocks comprising 35 pairs. Each pair contains one long and one short position each of which will have been thoroughly researched and are selected from the same market sector. Whilst in an ideal environment each stock's position will make a positive return, it is the relative performance of the pair that is important. As a result the Fund can make positive returns when each stock moves in the same direction provided the long position outperforms the short one in relative terms. However, if neither side of the trade is profitable, strict controls are required to ensure losses are limited. The Fund uses no derivatives and has no currency exposure. The Fund has no hard stop loss limits, instead relying on the small average position size per stock (1.5%) and per pair (3%) to limit exposure. Where practical pairs are always held within the same sector to limit cross sector risk, and positions can be held for months or years. The Bennelong Market Neutral Fund, with same strategy and liquidity is available for retail investors as a Listed Investment Company (LIC) on the ASX. |
Manager Comments | The Bennelong Long Short Equity Fund has a track record of 20 years and 6 months and has outperformed the ASX 200 Total Return Index since inception in February 2002, providing investors with an annualised return of 12.68% compared with the index's return of 7.91% over the same period. On a calendar year basis, the fund has experienced a negative annual return on 3 occasions in the 20 years and 6 months since its inception. Over the past 12 months, the fund's largest drawdown was -23.38% vs the index's -11.9%, and since inception in February 2002 the fund's largest drawdown was -30.59% vs the index's maximum drawdown over the same period of -47.19%. The fund's maximum drawdown began in September 2020 and has lasted 1 year and 10 months, reaching its lowest point during June 2022. During this period, the index's maximum drawdown was -15.05%. The Manager has delivered these returns with 0.36% less volatility than the index, contributing to a Sharpe ratio which has fallen below 1 five times over the past five years and which currently sits at 0.74 since inception. The fund has provided positive monthly returns 64% of the time in rising markets and 60% of the time during periods of market decline, contributing to an up-capture ratio since inception of 4% and a down-capture ratio of -121%. |
More Information |
19 Aug 2022 - Tequila strategy pays off for Diageo
Diageo strategy pays off Magellan Asset Management July 2022 |
In the mid-2010s, UK-based distiller Diageo invested in proprietary technology tools to uncover growth opportunities and improve returns on marketing spending. The analysis revealed the US was a ripe market for premium tequila, an alcoholic brew made from the blue agave plant that flourishes around the town of Tequila in the western Mexican state of Jalisco. Tequila volumes in the US doubled from 2003 to 2015, as Hispanic influence took hold and millennials-come-mixologists began making margaritas or sipping the liquid straight. Diageo's key step in its campaign to penetrate the high-end US tequila market came in 2017 when the company spent US$1 billion (including a US$300-million 'earn-out' based on sales) to acquire Casamigos tequila, a company founded four years earlier by US actor George Clooney and two others. Casamigos, which translates to 'house of friends in Spanish, was the fastest-growing (40%+) 'super premium' tequila in the US. With the purchase, Diageo added Casamigos, which Clooney still promotes, to its tequila portfolio that includes complementary brands such as Don Julio. By 2021, the campaign's success was obvious. Diageo's 'organic net sales' of tequila in fiscal 2021 had soared 79% from the previous year, numbers that meant tequila sales comprised 8% of the company's organic net sales. (This sales measurement excludes the effects of currency translation and takeovers and divestments.) The company subsequently announced it would spend US$500 million to expand production in Jalisco where it has two tequila plants. Thanks to strategic portfolio adjustments such as this, Diageo has outperformed peers in the US, which accounts for nearly 60% of group operating profit. Globally, the owner of Baileys Irish Cream liqueur, Captain Morgan rum, Johnnie Walker whisky, Tanqueray gin and Smirnoff vodka posted sales of 12.7 billion pounds in fiscal 2021, an increase of 12% from the year earlier. Diageo, whose spirits hold the No. 1 spot in six of the nine biggest spirit categories, extends beyond spirits. The company brews beer including Guinness, makes wine and offers ready-to-drink (pre-mixed) options. All up, the company boasts more than 200 global, local, and luxury brands that are sold in more than 180 countries. Through a 34% stake in LVMH's Moët Hennessy, Diageo stretches into the high-end cognac and champagne categories. Spirits represent about 80% of Diageo's revenue - scotch generates 25% of Diageo sales, while vodka accounts for 10%. Beer brings in about 15% of sales while other categories such as ready-to-drink products and wine generate the remainder. In terms of locations, the company sources about 40% of sales in North America, 20% in Europe (including Turkey) and another 20% in Asia Pacific. The modern history of Diageo, which can trace its start to 1759 when Arthur Guinness leased a brewery in Ireland, began in 1997 when Guinness and GrandMet merged. This union and subsequent bolt-on acquisitions have created a company with three key competitive advantages. The first is that Diageo owns the best brands for which consumers are prepared to pay a premium. Spirits variants are distinguishable in terms of flavour, production process, provenance, and vintage. Such points of differentiation allow distillers to charge higher prices for luxury categories. Johnnie Walker's 18-years-to-produce Black Label scotch, for instance, sells at 3.7 times the price of Johnnie Walker Red Label whisky. Diageo's second competitive advantage is that it has secured superior access to distribution channels. Bars, bottle shops, pubs, restaurants and supermarkets have finite space to display drinks. They favour brands that sell quickly and deliver higher margins. They want brands that can be supplied and restocked by a reputable and reliable company such as Diageo. The third advantage is Diageo has the turnover to achieve economies of scale in advertising, data analytics, distribution, manufacturing, research and development and procurement of ingredients. Lower average costs mean competitive pricing and higher margins. Diageo's three key advantages mean that the company is likely to generate superior returns for the foreseeable future, the attribute that stocks must possess to enter the Magellan global portfolio. To be sure, Diageo faces challenges. Hot categories such as tequila inevitably attract competition. Celebrities Dwayne Johnson (the Rock) and Kendall Jenner have launched tequila brands in recent years that they promote via their widely followed Instagram accounts. There is a risk that this could dent category returns, as new brands take market share and prompt existing players to increase their marketing spending. The counterargument to this point is that new celebrity-backed brands generate buzz for the category, and they typically compete based on product differentiation rather than unhealthy price competition. Diageo must be quick to adapt to fresh competitive threats and new industry trends, as the company did when it stormed the top end of the tequila category in the US in 2017. Sources: Dunn & Bradstreet, company filings and Bloomberg. |
Funds operated by this manager: Magellan Global Fund (Hedged), Magellan Global Fund (Open Class Units) ASX:MGOC, Magellan High Conviction Fund, Magellan Infrastructure Fund, Magellan Infrastructure Fund (Unhedged), MFG Core Infrastructure Fund Important Information: This material has been delivered to you by Magellan Asset Management Limited ABN 31 120 593 946 AFS Licence No. 304 301 ('Magellan') and has been prepared for general information purposes only and must not be construed as investment advice or as an investment recommendation. This material does not take into account your investment objectives, financial situation or particular needs. This material does not constitute an offer or inducement to engage in an investment activity nor does it form part of any offer documentation, offer or invitation to purchase, sell or subscribe for interests in any type of investment product or service. You should read and consider any relevant offer documentation applicable to any investment product or service and consider obtaining professional investment advice tailored to your specific circumstances before making any investment decision. A copy of the relevant PDS relating to a Magellan financial product or service may be obtained by calling +61 2 9235 4888 or by visiting www.magellangroup.com.au. Past performance is not necessarily indicative of future results and no person guarantees the future performance of any strategy, the amount or timing of any return from it, that asset allocations will be met, that it will be able to be implemented and its investment strategy or that its investment objectives will be achieved. This material may contain 'forward-looking statements'. Actual events or results or the actual performance of a Magellan financial product or service may differ materially from those reflected or contemplated in such forward-looking statements. This material may include data, research and other information from third party sources. Magellan makes no guarantee that such information is accurate, complete or timely and does not provide any warranties regarding results obtained from its use. This information is subject to change at any time and no person has any responsibility to update any of the information provided in this material. Statements contained in this material that are not historical facts are based on current expectations, estimates, projections, opinions and beliefs of Magellan. Such statements involve known and unknown risks, uncertainties and other factors, and undue reliance should not be placed thereon. Any trademarks, logos, and service marks contained herein may be the registered and unregistered trademarks of their respective owners. This material and the information contained within it may not be reproduced, or disclosed, in whole or in part, without the prior written consent of Magellan. |
18 Aug 2022 - Performance Report: Glenmore Australian Equities Fund
Report Date | |
Manager | |
Fund Name | |
Strategy | |
Latest Return Date | |
Latest Return | |
Latest 6 Months | |
Latest 12 Months | |
Latest 24 Months (pa) | |
Annualised Since Inception | |
Inception Date | |
FUM (millions) | |
Fund Overview | The main driver of identifying potential investments will be bottom up company analysis, however macro-economic conditions will be considered as part of the investment thesis for each stock. |
Manager Comments | The Glenmore Australian Equities Fund has a track record of 5 years and 2 months and has outperformed the ASX 200 Total Return Index since inception in June 2017, providing investors with an annualised return of 22.05% compared with the index's return of 7.79% over the same period. On a calendar year basis, the fund hasn't experienced any negative annual returns in the 5 years and 2 months since its inception. Over the past 12 months, the fund's largest drawdown was -16.18% vs the index's -11.9%, and since inception in June 2017 the fund's largest drawdown was -36.91% vs the index's maximum drawdown over the same period of -26.75%. The fund's maximum drawdown began in October 2019 and lasted 1 year and 1 month, reaching its lowest point during March 2020. The fund had completely recovered its losses by November 2020. The Manager has delivered these returns with 7.53% more volatility than the index, contributing to a Sharpe ratio which has fallen below 1 four times over the past five years and which currently sits at 0.97 since inception. The fund has provided positive monthly returns 90% of the time in rising markets and 38% of the time during periods of market decline, contributing to an up-capture ratio since inception of 239% and a down-capture ratio of 102%. |
More Information |