
NEWS

9 Oct 2024 - Trip Insights: LatAm (Part 1)

8 Oct 2024 - New Funds on Fundmonitors.com
|
New Funds on FundMonitors.com |
|
Below are some of the funds we've recently added to our database. Follow the links to view each fund's profile, where you'll have access to their offer documents, monthly reports, historical returns, performance analytics, rankings, research, platform availability, and news & insights. |
 |
||||||||||||||||||||||
| Dimensional Two-Year Sustainability Fixed Int. Trust AUD Class | ||||||||||||||||||||||
|
||||||||||||||||||||||
| View Profile | ||||||||||||||||||||||
| Dimensional World Allocation 70/30 Trust | ||||||||||||||||||||||
|
||||||||||||||||||||||
| View Profile | ||||||||||||||||||||||
| Dimensional World Allocation 30/70 Trust | ||||||||||||||||||||||
|
||||||||||||||||||||||
| Dimensional World Allocation 50/50 Trust | ||||||||||||||||||||||
|
||||||||||||||||||||||
| Dimensional Sustainability World Allocation 70/30 Trust | ||||||||||||||||||||||
|
||||||||||||||||||||||
| View Profile | ||||||||||||||||||||||
 |
||||||||||||||||||||||
| Magellan Core Global Fund | ||||||||||||||||||||||
|
||||||||||||||||||||||
| View Profile | ||||||||||||||||||||||
|
Want to see more funds? |
||||||||||||||||||||||
|
Subscribe for full access to these funds and over 850 others |

4 Oct 2024 - Hedge Clippings | 04 October 2024
|
|
|
|
Hedge Clippings | 04 October 2024 The seasonally adjusted August Household Spending Indicator results released by the ABS earlier today - produced from source data of credit card spending from participating banks, supermarket transactions, and new vehicle sales - were unchanged month on month, with the July and June results re-adjusted downwards to -0.5% and -0.1% respectively. Given recent wage increases, energy assistance, and Stage III Tax cuts, all the indications are that consumers are keeping their hands in their pockets - at least when it comes to reaching for the plastic, or doing the weekly grocery shop. Over 12 months the number was +1.7% - best described as muted, particularly given annual inflation is running at double that figure, depending on which number (Seasonally adjusted, excluding volatile items or annual trimmed mean) one looks at. Household spending has been declining from a post COVID induced high of 29% in August 2022, with the latest figure particularly driven by goods (-0.3%) vs. services, including air travel, catering, and accommodation (+0.4%). Peering through the breakdown, it seems Australia's two speed economy, or two speed demographics is real. Those doing it tough are doing without, while those that can afford travel, catering and accommodation are still doing OK. As the ABS numbers are only "experimental" and cover credit card spending and supermarket data it will have to wait until the next set of Retail Trade numbers are released on 31 October, a day after the next CPI result. The RBA will then have a few days to consider the numbers prior to their next meeting scheduled for the 4th and 5th of November, the second day of which inconveniently clashes with the Melbourne Cup. With the RBA announcement at 2:30 and the Cup starting at 3:00, there are going to be some conflicts of attention, except of course in Melbourne itself when Race Day is marked by a Public Holiday. Prior to that, and starting next week, there are multiple speeches, remarks and panel appearances from various RBA members, including Deputy Governor Hauser, and Assistant Governors Christopher Kent and Sarah Hunter, which are only likely to maintain the Bank's current stance - inflation is the number one game, and they won't be hurried into cutting rates until they're certain it's been put back in the bottle. Over in the US it looks as if inflation might have been tamed, with market watchers waiting to see the US jobs report for September, due to be released overnight tonight to gauge if the Fed's next cut will be another 0.5%. The median forecast is for 150,000 new jobs in September, leaving the unemployment rate at 4.2%, in which case the Fed might only cut 0.25%. While the US economy seems on the right track, a combination of the port workers' strike which started this week, and critical escalation of the conflict between Israel, Hamas, Hezbollah, and Iran, could derail that. Meanwhile, the Trump and Harris camps continue to trade claim and counter claim, while spending untold millions on advertising in what looks like a photo finish for the White House - also on Cup Day, November 5th - which from a distance looks too close to call. News & Insights New Funds on FundMonitors.com 10k Words | Equitable Investors August 2024 Performance News Delft Partners Global High Conviction Strategy |
|
|
If you'd like to receive Hedge Clippings direct to your inbox each Friday |

4 Oct 2024 - Performance Report: Insync Global Quality Equity Fund
[Current Manager Report if available]

4 Oct 2024 - The Rate Debate - Ep51 The rest of the world is changing, so why aren't we?
|
The Rate Debate - Ep51 The rest of the world is changing, so why aren't we? Yarra Capital Management September 2024 The big question remains: will Australia follow the Fed's lead or stick to its current path? In Episode 51 of The Rate Debate, Co-Head of Fixed Income Darren Langer and Investment Manager Jessica Ren unpack the Fed's recent decision, explore the chances of rate cuts before Australia's next federal election, and debate the importance and reliability of employment data for the RBA. They also take a closer look at inflation pressures, from petrol prices and energy rebates to rising service costs. |
|
Funds operated by this manager: Yarra Australian Equities Fund, Yarra Emerging Leaders Fund, Yarra Enhanced Income Fund, Yarra Income Plus Fund |

3 Oct 2024 - Performance Report: ECCM Systematic Trend Fund
[Current Manager Report if available]

3 Oct 2024 - Emerging Markets are offering one of the biggest opportunities in a lifetime
|
Emerging Markets are offering one of the biggest opportunities in a lifetime Ox Capital (Fidante Partners) September 2024 The term "BRICS" was coined in 2001, and it refers to a collection of developing countries - Brazil, Russia, India, China and South Africa. Since then, the BRICS nations' share of global GDP (based on purchasing power parity) has surpassed that of developed economies, contributing to over ~60% of global GDP. China for example, grew its share of world GDP (PPP) to ~19% from ~8% in 2001. While China's growth is more mature, many other emerging economies are poised to continue the economic catch-up, as these economies still have relatively low-income per capita levels, and growth is driven by sound economic policies. 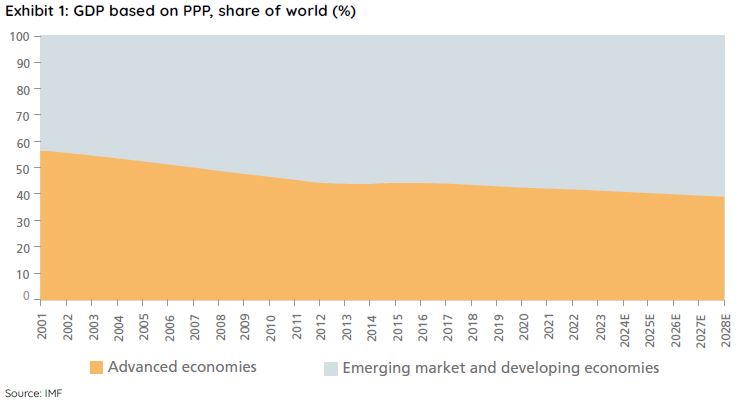 Notably, emerging markets equities are at a multi-decade low in price to earnings and price to book valuations compared to that of developed markets. It is an important fact given EM equities have historically outperformed developed market over the long-term. A general lack of interest has led to extraordinarily appealing valuations. We are looking at an attractive entry point with forward price to earnings multiples at depressed levels for quality companies with sustainable long-term growth and a backdrop supportive of outperformance. Moreover, many EM economies are undergoing continued economic development and political reforms. The economic fundamentals are much better than in prior years. Inflation is trending lower in many EMs allowing central banks to cut rates. A slowing developed markets economy is set to benefit emerging economies as we believe a slowdown in growth for the US will lead to interest rate cuts. Additionally, a declining US dollar and official interest rates are set to benefit emerging market equities. 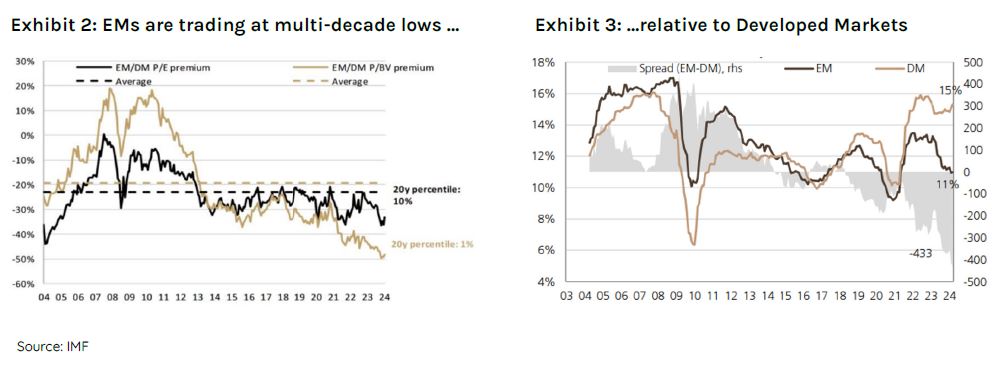 The recent period of underperformance for emerging markets, is an outlier in our view. EM economies were much more indebted and starting valuations were high over a decade ago. The present outlook is vastly different. Fiscal balances are healthy while debt to GDP ratios are at stable levels. Corporates are in a healthy position. Moreover, many EM regions are rich in key commodities for the upcoming Net Zero energy transition. We remain optimistic on emerging markets and believe the fundamentals are in place for EMs to outperform developed economies. Our proprietary quant model (the MOAT) is pointing to a very difficult environment for many developed markets into 2H2024 into 2025 including the US, versus an improving outlook for many EM countries, including China. Ox Capital is positioned now to benefit by investing in quality companies with sustained growth at attractive valuations across EM countries. In a volatile environment such as the one we are in; it is important to try to hedge the volatility. Ox has the capability to manage the portfolio dynamically that has reduced volatility in the past. Theme 1: A weaker USDThe US interest rate hikes by the central bank (Federal Reserve) has driven a stronger US Dollar. The recent strength of the "greenback" has been a headwind for emerging economies. This is logical as a stronger dollar can impact capital flows, trade, direct investment, and can impact credit growth. We believe the eventual decline in the USD will provide a tailwind for emerging market equities as returns are typically higher when the USD is declining in value. Historically, EMs outperformed the market by ~20% on average over the period since 2003. 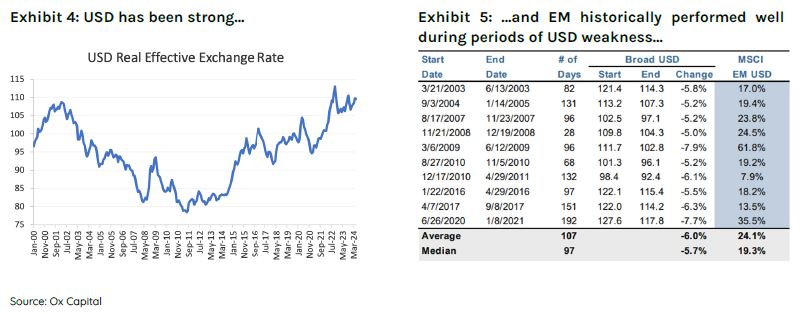 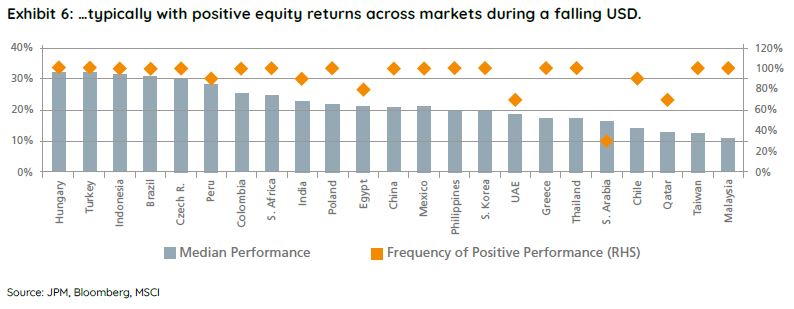 Theme 2: Rate CutsThe US federal funds rate has peaked and the FOMC is likely to cut rates as inflation moderates within its targets range. EM markets have historically performed well when the US cuts interest rate. Moreover, local central banks have been fiscally responsible. Many central banks have already started to cut official interest rates as inflation has trended back towards many central bank targets. Rate policy looks too restrictive, and cuts are likely to continue. 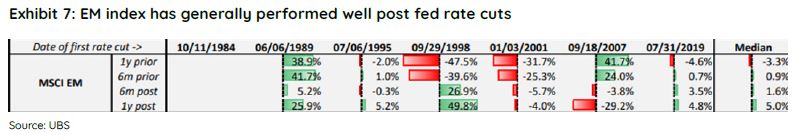 Theme 3: Supply chain reconfiguration and nearshoring.A reconfiguration of global supply chains will boost economic growth for a number of economies, especially nearshoring in ASEAN and LATAM, boosting GDP growth through foreign direct investments. Vietnam is a notable beneficiary of this trend. Greater foreign direct investment into an ever more open and market driven economy, with some of the most comprehensive free trade agreements in place globally, is providing strong employment opportunities for this young and vibrant country. As such, we believe this backdrop provides a foundation for alpha generating opportunities. 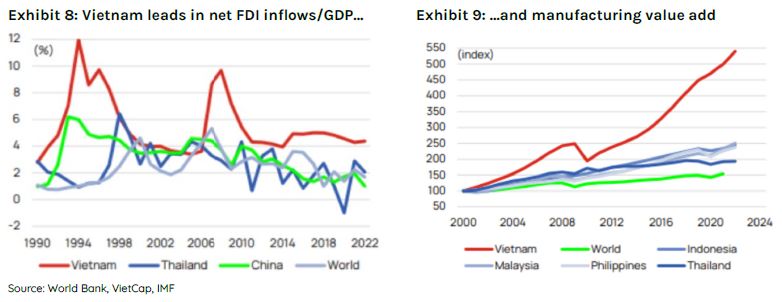 Moreover, nearshoring is a significant opportunity for the LATAM region in the coming years based on their geographical proximity to North America, and relatively cheap skilled labour. Nearshoring could add US$78 billion per annum in additional export revenue in LATAM in the coming years with Mexico being the primary beneficiary. Trade is especially important for Mexico. Mexico relies heavily on its industrial sectors for exports, with the manufacturing sector representing >80% total exports. Mexico's manufacturing sector has grown and matured over the years. Most recently, the top three export categories include auto-components, electronics, and machineries. Mexico is well placed with its long-established export capabilities to fulfil manufacturing orders for an increasing number of international companies. Mexico's relationship with the US is already well-established, as it is the largest exporter to the US. The country's ~15% share of US imports has now surpassed China's ~14%. 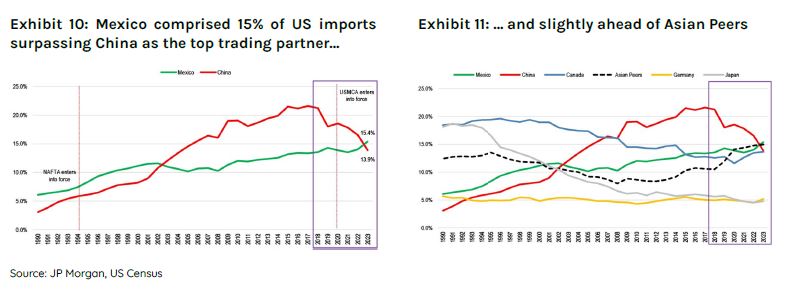 Growth in developed economies is expected to slow as rates have likely peaked. In contrast, despite recent economic challenges, the Chinese economy is expected to grow faster than the US, Japan, and Euro Area. Although China's growth is lower than in recent years, its economy is showing signs of bottoming, on the back of the Chinese authorities showing a willingness to stimulate and support the economy. Keep in mind that interest rates in China are low with minimal inflation relative to the rest of the developed world. A positive set up for equities in the year ahead. Moreover, Emerging countries make up the bulk of global growth, contributing to over ~60% of global GDP, but is under appreciated by global investors. Funds operated by this manager: Ox Capital Dynamic Emerging Markets Fund Important Information: This material has been prepared by Ox Capital Management Pty Ltd (Ox Cap) (ABN 60 648 887 914) Ox Cap is the holder of an Australian financial services license AFSL 533828 and is regulated under the laws of Australia. This document does not relate to any financial or investment product or service and does not constitute or form part of any offer to sell, or any solicitation of any offer to subscribe or interests and the information provided is intended to be general in nature only. This should not form the basis of, or be relied upon for the purpose of, any investment decision. This document is not available to retail investors as defined under local laws. This document has been prepared without taking into account any person's objectives, financial situation or needs. Any person receiving the information in this document should consider the appropriaten |
2 Oct 2024 - Performance Report: Insync Global Capital Aware Fund
[Current Manager Report if available]

2 Oct 2024 - Why the coming downturn is good for credit investors
|
Why the coming downturn is good for credit investors Janus Henderson Investors September 2024 Jay Sivapalan, Head of Australian Fixed Interest, discusses the current state of credit markets and explores how active management strategies, mixed with nuanced credit investing, can lead to positive returns for investors. As monetary policy works its way through various economies reducing final demand it has, by design, the dual outcomes of softening labour markets and lowering corporate profitability. The world has changed, and the price of money, in our view, is now at much healthier levels whilst the availability of credit becomes more discerning. Funding costs for corporates have normalised, not just from the abnormally easy conditions during the pandemic, but also versus the decade of cheap money between the Global Financial Crisis and the pandemic. For investors, the late stage of this economic cycle has arrived and this brings the normal advent of rising delinquencies, re-structures and defaults. Whilst ordinarily this phase of the cycle would spell caution for investors, we believe ultimately it is a healthy development and that taking a nuanced approach to credit investing will likely deliver investors strong risk adjusted returns over the period ahead. Key considerations for investors include:
Starting point mattersAs the economic and business cycle nears the latter stages, any slowdown in economic growth, softening of labour markets will inevitably impact corporate earnings adversely. This cycle will be no different. However, the starting point is worth assessing for different segments of the corporate debt market. To provide some context, corporates in Australia and abroad were healthy, making adequate profits prior to the pandemic. During the pandemic, these very companies shifted upward to making abnormally high profits, aided by both monetary and fiscal policy as well as a resumption of demand. Inflation on nominal revenues also assisted the larger, stronger companies in gaining market share and achieving margin expansion. Meanwhile, highly-levered consumer cyclical and small-medium enterprise (SME) segment survived and in some cases temporarily thrived during the pandemic. However, this segment was never fundamentally strong nor sustainable and is now facing the reality of falling demand and higher funding costs. A different cycleFor the most part investment grade companies today remain well funded with debt termed out and highly profitable. From a fundamentals perspective, they remain relatively resilient to an economic growth slowdown. We see profits as moderating rather than falling precipitously. The same cannot necessarily be said for the SME segment. Nor for highly leveraged and/or cyclical, consumer centric businesses. A default cycle has commenced in loans, and pockets of high yield and private credit across the globe. Domestically this was most visible in SME delinquencies. It was initially centred around the property construction sector, but is now widening to hospitality, domestic tourism, recreational goods and services, and other consumer segments. Business models reliant on ongoing cheap debt or easy re-financing with little or no revenue is in the grips of a reality check, likely with harsh ramifications. A nuanced approach to credit investingNot all default cycles end in a crisis for credit markets. This cycle would suggest that defaults in investment grade companies should remain quite low by historical standards, but may be elevated in higher yielding segments. Importantly, rather than a uniform spike of defaults, we are more likely to see a rotation of defaults from industry to industry within lower quality credit. This will, in turn, keep the default rate rolling over multiple years. Recovery rates in these lower quality segments are being realised at lower levels than the past. Of course, market dislocations can occur with concerns around defaults lower down in credit markets, and cause mark to market underperformance in higher quality credit segments. We would assess these events as opportunities to add to investment grade credit without fear, rather than one to be cautious about. Outsized credit returns availableOverall, higher quality credit in the investment grade space remains the sweet spot for delivering healthy yields. However, to assess relative value, the sticker yields of lower credit quality, higher yielding segments need to be adjusted down for defaults and loss. The relative value of higher beta segments of the credit market currently remains less compelling in our assessment but a widening of credit spreads in this area would be valuable entry points for investors.
With the exception of a left field event, the most probable scenario points to strong prospective relative performance of credit, with investment grade credit being the sweet spot for investors on a risk adjusted basis. For the brave, the loans segment is potentially shaping up to be an opportunity, albeit security selection will be critical given the expected higher defaults and lower recoveries. A beta exposure is not recommended. Cheap ways to invest in credit and hedge tail risksTail ends of economic and market cycles have always been volatile, with investors seeking duration, quality risk-free assets and high compensation for default risk. Liquidity can also become fleeting in an environment of uncertainly. In order to preserve capital and also extract good returns in this environment, one must not passively sit on the sidelines; this is the wrong part of the cycle to be beholden to benchmarks. To ensure portfolios retain their defensive attributes, levers such as active management of duration, yield curve positioning and credit protection through the Credit Default Swap (CDS) market can be invaluable. We are confident dislocations will occur and opportunities will emerge. Again, actively utilising the full spectrum of inflation linked bonds, bond/swap and bond/semi-government spreads, corporate and asset backed betas (such as global loans, high yield and emerging market debt) can further drive return outcomes. Individual industry positioning will become important if markets dislocate more meaningfully. Today, both CDS protection and duration are cheap and effective tools that can be relied upon whilst fully utilising the prospective value in investment grade credit. We assess this as a great way for investors to enhance overall portfolio outcomes on a risk adjusted basis. Author: Jay Sivapalan, CFA |
|
Funds operated by this manager: Janus Henderson Australian Fixed Interest Fund, Janus Henderson Australian Fixed Interest Fund - Institutional, Janus Henderson Cash Fund - Institutional, Janus Henderson Conservative Fixed Interest Fund, Janus Henderson Conservative Fixed Interest Fund - Institutional, Janus Henderson Diversified Credit Fund, Janus Henderson Global Equity Income Fund, Janus Henderson Global Multi-Strategy Fund, Janus Henderson Global Natural Resources Fund, Janus Henderson Tactical Income Fund This information is issued by Janus Henderson Investors (Australia) Institutional Funds Management Limited (AFSL 444266, ABN 16 165 119 531). The information herein shall not in any way constitute advice or an invitation to invest. It is solely for information purposes and subject to change without notice. This information does not purport to be a comprehensive statement or description of any markets or securities referred to within. Any references to individual securities do not constitute a securities recommendation. Past performance is not indicative of future performance. The value of an investment and the income from it can fall as well as rise and you may not get back the amount originally invested. Whilst Janus Henderson Investors (Australia) Institutional Funds Management Limited believe that the information is correct at the date of this document, no warranty or representation is given to this effect and no responsibility can be accepted by Janus Henderson Investors (Australia) Institutional Funds Management Limited to any end users for any action taken on the basis of this information. All opinions and estimates in this information are subject to change without notice and are the views of the author at the time of publication. Janus Henderson Investors (Australia) Institutional Funds Management Limited is not under any obligation to update this information to the extent that it is or becomes out of date or incorrect. |

1 Oct 2024 - Performance Report: Delft Partners Global High Conviction Strategy
[Current Manager Report if available]