
NEWS

18 Oct 2024 - Performance Report: Cyan C3G Fund
[Current Manager Report if available]

18 Oct 2024 - Global Investment Committee's outlook: low risk no longer
|
Global Investment Committee's outlook: low risk no longer Nikko Asset Management October 2024 As the Global Investment Committee (GIC) convened on 26 September, our Q2 outlook for resilient though somewhat softer US growth had materialised. However, our US EPS growth estimates (consistent with strong but softer GDP growth) remained slightly more conservative than market estimates. Going forward, we perceive heightened risk to both growth (two-way) and inflation (upside) compared to our Q2 guidance. Nevertheless, our central near-term scenario remains for slowing but positive growth in the US, alongside slowly moderating prices. Key takeaways are as follows:
Q3 2024 in review: the "great dispersion" in stocks and bondsOver the course of Q3, the market experienced a change of course on several factors. Following a surprise rate hike from the Bank of Japan (BOJ) in July (the central bank took overnight rates to 25 bps), a downside surprise in US non-farm payroll data triggered speculation of imminent Fed rate cuts. This, in turn, led to the unwinding of speculative yen-funded "carry trades", triggering both a sudden drop in dollar-yen as well as unexpected volatility in Japanese equities--the target investments of short-term overseas investors utilising borrowed yen. Markets recovered quickly from the volatility, although dollar-yen appears to have corrected decisively lower from highs above 160. Domestic investors went bargain hunting as Japanese indices sold off and Japanese corporates used their large cash balances to buy back their shares at lower prices. Underweight institutional investors accumulated domestic equities to rebalance their portfolios while households, unfazed by speculative selling, continued to exercise the tax advantages that accrued to them under the New NISA. We convened an Extraordinary GIC at the time and shifted our guidance, primarily to allow for greater volatility. Aware that volatility tends to cluster and that markets may be at the threshold of a new volatility regime, we widened our ranges for both US GDP and the FOMC to admit downside risks. We also implemented new ranges for valuation (P/E) alongside existing earnings ranges for Japanese indices. Meanwhile, on the eve of the GIC on 26 September, markets had received news of surprise stimulus from China, on the heels of a larger-than-expected 50 bp rate cut from the FOMC on 19 September which had prompted bond markets to price in a succession of significant US rate cuts. Equity markets subsequently broke to new highs, even as bonds priced in a sombre macroeconomic scenario, though they barely reacted to the Fed's move on 19 September as the market had already priced in multiple 50 bp interest rate cuts. Meanwhile, toward the end of Q3, both Japanese stock markets and dollar-yen were influenced by speculation that Japan's ruling Liberal Democratic Party (LDP) would elect a new Abenomics-inspired leader (and thus prime minister). However, the LDP leadership vote on 27 September resulted in disappointment for the markets, which had to lower their expectations for the BOJ to end or indefinitely postpone its interest rate hike cycle. The LDP elected Shigeru Ishiba as its new leader and prime minister, who subsequently called a snap election for 27 October. However, as we noted in our insight, "Less may be more in Japan's LDP leadership contest", the situation is very different now than at the start of the Abenomics era when inflation struggled to turn positive. In Q3, we not only saw Japanese Q2 corporate earnings remain consistently strong but we also witnessed incipient signals of stronger consumption demand, backed by the advent of positive year-on-year (YoY) real wage growth. Global macro: growth risks persist, inflation tamer vs. Q2 on surfaceUS: From a macroeconomic standpoint, there is not enough clear motivation from underlying economic indicators to price in an imminent US recession, even despite softening data. Although the GIC foresees US GDP growth dipping below the 2% level, our outlook is for YoY growth to remain above 1.5% in the year to September 2025. The US consumer has remained resilient, even despite a softer job market, with consumption among higher-income households assisted by the "wealth effect" of gains in US stocks. While much slower than in early 2024, the US continues to add over two million jobs to non-farm payrolls YoY (see "What the Fed's rate cut tells us about current financial conditions"), which is stronger than job growth typically tends to be immediately prior to a US recession. That said, the unemployment rate has triggered the Sahm rule (typically a forward indicator of recession), due in part due to the widening disparity between the household survey (which shows YoY job growth already in contraction), and based on which the unemployment rate is calculated and the establishment survey, which tabulates non-farm payrolls. Chart 1: Employment conditions in the US 
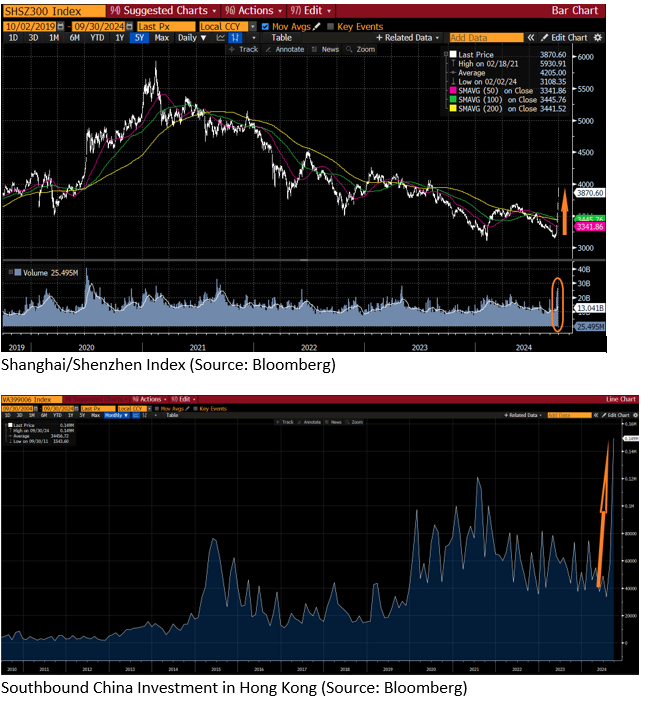
Source: Nikko AM, BLS Motivating the divide in part are disperse conditions between higher income households (where both job conditions and investment income are more supportive) and lower-income households, which are a higher proportion of the household survey than the establishment survey. Meanwhile, we see inflation as likely to stay on a gradual downward trajectory, although our median US core PCE outlook is for prices to show above 2% YoY growth over the course of the year to September 2025. Meanwhile, our voter survey shows a less dispersed central tendency for both headline and US inflation compared to Q2 as inflation subsides gradually. Notwithstanding, several members cite heightened inflationary tail risks. Many of the risks cited by voters have the potential to extend beyond the one-year outlook horizon. Macro vs. forward-looking financial market indicators: We are carefully observing the "great dispersion" of scenarios priced into financial markets, particularly in equities and bonds. We are unconvinced that the circular logic of aggressively lower rates could justify ever-higher equity valuations. This is particularly so given the messaging from the Fed. Although the FOMC did comply with market expectations for a "jumbo" cut in July, Fed Chair Jerome Powell continues to warn against assuming this would be the "new pace" of monetary easing in the absence of clear deterioration of economic conditions. Meanwhile, should economic conditions deteriorate (which is the bond market's signal) we are doubtful that the optimistic scenarios priced into the equity markets would indeed come to pass. Japan: Despite financial volatility in August, Japanese GDP appears to be on a trajectory to continue growing above-trend (potential GDP has been estimated at around 0.6% by the BOJ). Nonetheless, the median GIC voter offers more conservative estimates of Japanese GDP growth than in Q2 (no longer above 2% YoY) thanks in part to slower--albeit positive--growth in the US and other export markets. Meanwhile although headline CPI is foreseen dipping below 2% as early as the September quarter of 2025 with imported price inflation allayed by a slowly strengthening yen, our median GIC outlook is for ex-food inflation to remain above 2% over the year to September 2025. Euro area: The median GIC voter meanwhile foresees Eurozone GDP growth as likely to break above 1% YoY and remain at these levels over the year to September 2025, although both headline and core inflation are likely to remain stubbornly in excess of the European Central Bank (ECB)'s 2% medium-term target. However, immediate upside inflationary risks have been somewhat downgraded since the Q2 GIC, when much greater upside dispersion was seen among voters' estimates of future European inflation in both headline and core HICP. China: were it not for China's recent fiscal and monetary stimulus packages, GIC voters would have likely downgraded their GDP growth outlook, which they expect to still remain in the upper 4% range (but under 5%) over the year to September 2025. According to GIC voters, compared to the beginning of Q3, when stimulus was not priced in, moves by the Fed and the People's Bank of China (PBOC) have shifted the growth outlook. At the beginning of Q3, growth was perceived to come from abroad while now there is much more focus on domestic recovery. Meanwhile, communication between the PBOC and the government, which had previously been much more compartmentalised, now demonstrates greater coordination and a tone of shared urgency among Chinese officials. Their aim extends beyond simply stemming the decline in the housing market, focusing instead on stimulating domestic demand growth. Voters note that Chinese stimulus has been delivered at a time when markets are particularly sensitive to easing, though the size is half of what was delivered in 2009 (CNY 4 trillion vs. CNY 2 trillion in debt-funded fiscal easing in 2024) when the economy was one-third the size it is now. GDP growth is now less likely to falter near the 4% level (compared to the 5% target), particularly in the near-term--specifically, in the fourth quarter of 2024 and the first quarter of 2025. That the package also includes consumption coupons issued by an administration that once eschewed what it deemed "welfarism" underscores the priority for China to keep social unrest at bay given its sluggish domestic economy. Nonetheless, the outlook for headline CPI remains on the 1% handle, with core CPI still foreseen below 1% YoY over the year to September 2025. This is because voters perceive difficulties for China in lifting prices successfully; rather, attempts to date to allay weakness in the much greater consumer economy with investment in industry and export could potentially mean some degree of exportation of deflationary price pressures on exported Chinese goods. However, the impact of such pressures on trade partners could be limited in comparison to the early 2000s given today's higher relative price levels, reduced global trade openness and rise in trade barriers. That said, exported deflationary pressures are not always persistent. Though many Chinese firms do compete on price to gain market share, once gained, price increases often follow in an attempt to expand margins. Interest rates: the power of financial markets, a double-edged swordFOMC: In line with our relatively softer growth and inflation guidance over the year to September 2025, we have also downgraded our FOMC outlook relative to Q2. As mentioned in the "macro" section, softer indicators--particularly pertaining to US jobs--reinforce the need for further rate normalisation, as also apparent in the FOMC's own downgraded "dot plots" for growth, inflation and rates. The median GIC voter took the Fed's own forecast at face value to bring rates another 50 bp lower by the end of 2024. This is less dovish than the outlook currently priced into the bond market, which foresees potential for up to 75 bps in cuts by the end of 2024. Subsequently, the GIC foresees roughly 25 bps of easing per quarter, with a median outlook of 3.7% and an interquartile range between 3.45% and 3.95% by the end of September 2025. BOJ overnight rates: In Q2, we had priced in a partial but not a full probability of a July rate hike, which we saw as a modest surprise. However, following our August review, we saw little risk of the BOJ following up its surprise July hike with immediate additional tightening prior to gauging the impact of its move in Q3. Moreover, the BOJ called out both financial markets volatility as well as uncertainty abroad (e.g. in US growth) as one reason to remain on hold in September. Much like the influence that the markets appear to have had on the Fed's "pre-emptive" 50 bp cut, we see the BOJ's stance as being much more market-conscious than it was prior to the volatility experienced in early August. We do foresee potential for another rate hike before year-end, but such a move would most likely come after the October inflation data is published. According to the media, consumers will face price hikes on 2,900 food and drink items in the month of October (the broadest price increase in 2024 so far), as firms pass along higher raw material costs to consumers. GIC voters are therefore pricing in prospects of another hike prior to year-end (with the median guidance at 0.3%). There remains the risk that if financial market volatility resurges, the BOJ may remain on hold--all else being equal--at any point over the coming year. Conversely, if inflation surprises to the upside, there is also the risk that the BOJ could deliver a larger hike; our voters attribute a 25% or less chance that rates may rise to 0.45% before the year-end. Subsequently, the median GIC voter foresees rates as likely to rise to 50 bp by June 2025, and to 75 bps by September 2025. ECB: After the Q2 median guidance of 3.65% for the September-end refinancing rate came in close to the actual outcome, the GIC modestly downgraded its ECB outlook for the coming year. The Fed's larger-than-expected rate cut in September may have opened the door for more aggressive easing by the ECB. The median GIC voter predicts that it is somewhat likely for the ECB to reduce overnight rates before the year-end, with the interquartile range by the end of December 2025 at 3.075% to 3.575%). Nonetheless, given persistent services inflation, especially in Europe, the rate cut outlook is more conservative compared to the FOMC. Our median voter foresees a further 75 bps of cuts as likely in 2025. This compares to the FOMC's 80 bps foreseen for 2025, in addition to the 50 bps of cuts in Q4 2024. 10-year interest rates: Despite the uncomfortable positive correlation between equities and 10-year bond prices (with long-term bonds affording insufficient diversification from market risk), it is hard for participants in the bond market to "fight the Fed" given the apparently strong influence financial markets have on policy. This may paradoxically dilute the power of financial market indicators, including term structures of interest rates, as forward indicators of economic activity. Moreover, the positive correlation across geographies in longer-term bond markets is also apparent, even despite disparate policy trajectories. For example, in spite of improved prospects for near-term BOJ hikes since Q2 as priced into the short end of the JGB yield curve, the term structure of Japanese yields has flattened modestly since July, possibly influenced by Fed easing. Meanwhile, long-term US Treasury yields have declined even though the inversion between the 2- and 10-year benchmark Treasury yield has corrected. GIC voters foresee limited movement in 10 year Treasury yields from their current levels, even despite additional FOMC cuts, due to many of the cuts already being priced into the bond curve. Likewise, voters' central scenario is for little movement in 10-year Bunds over the coming year. One significant caveat--though not a central scenario among voters that inflation will disrupt the Fed's rate cut trajectory-- inflationary surprises and fiscal risk have registered higher than in Q2 in both probability and impact among voters' tail risks (see "Risks to Our Outlook* below). Foreign exchange: gradual yen appreciationFollowing volatility in August, we adjusted our outlook on the Japanese yen to allow for greater appreciation by the currency, as did the market as a whole. Partly responsible for this outlook adjustment was the prospect for narrowing yield differentials as the Fed eased and the BOJ tightened. Also, after observing one round of carry-trade unwinding and observing that market volatility tends to cluster, we upgraded the potential for volatile moves; volatility tends to come alongside yen appreciation. Meanwhile, the dollar's prospects have been downgraded modestly across currencies. The downgrade is less pronounced against the euro, pound and Australian dollar compared to the yen. Noting that the September 2024 BOJ Tankan survey released on 1 October references a fiscal year-end dollar-yen rate of 144.31, which is reasonably close to the spot rate at the time of writing, additional appreciation may impact exporters' overseas revenues, which we cover in the Japanese equities section. Mild upside to commodities, dispersed view on gold and oilIn line with the downward adjustment in oil prices thanks to supply and demand factors, the GIC downgraded its Q2 assumptions on Brent crude, foreseeing oil to remain below USD 80 per barrel for the year to September 2025. Any upside surprise, meanwhile, may result in an upgrade to inflation expectations. While this is not our central scenario, we do see rising tail risks connected to geopolitics, including violence in the Middle East. As its central scenario the GIC foresees mild upside to commodity prices over the coming year. Meanwhile, we expect the quest for diversification away from market risk, along with the inconvenient positive correlation between equities and US Treasuries (a traditional risk haven) will prove very supportive for gold in the coming year. Although the market prices a correction to near USD 2,500 per ounce over the next year, the GIC median voter sees potential for gold to rise above USD 2,700, with a 25% chance of the precious metal climbing to USD 2,800 or higher over the year to September 2025. Earnings growth and equity valuation: making way for higher asset volatilityOver the immediate horizon, the Fed's pre-emptive rate cut has had positive effects. Ongoing stimulus may continue to offer potential for resilient earnings growth from US stocks over the year to September 2025. We foresee double-digit YoY earnings growth still remaining intact over the year to September 2025. However, we also flag risks associated with ongoing market concentration (see "Risks to Our Outlook" below). Although our earnings outlook remains roughly in line with consensus, we foresee the potential for valuations to overshoot near-term due to Fed stimulus, and then gradually moderate over the course of the year to September 2025. We also anticipate potential for rebounds in lower-valued indices, such as the STOXX and Hang Seng. We believe that the latter can capitalise on its recent trough as Chinese stimulus takes effect and earnings growth recovers. But we expect valuations to remain on a downtrend for the STOXX, while we see earnings recovering over the course of the year to September 2025. Japan equities: low valuation + earnings growth + volatility = opportunityAlthough we foresee a rising trend in Japanese earnings and some adjustments in valuation over time, we expect volatility and dips in price creating significant opportunities for new purchases among longer-term investors. Notwithstanding the volatility, we see potential for broad-based Japanese corporate earnings growth, plus significant ability for the index to regain ground after sharp dips. This is due not only to comparatively reasonable valuation relative to US stocks, whose P/E ratios are well above their historical 20-year range, but also Japan's strong structural growth backdrop. This is evidenced by the gathering momentum of domestic consumption and investment alongside improving governance among corporates. We also note the presence of structural buyers in the form of domestic corporates buying back their own shares, institutions topping up domestic shareholdings to meet allocations and households exercising the tax advantages inherent in the new NISA. However, we do not discount the potential for interim negative surprises, particularly among large exporters, given the smaller buffer that current yen rates provide to exporters in terms of overseas revenues and investment income windfalls. Broader price ranges reflecting reactions to earnings surprises and valuation shifts: In August, we had introduced ranges not only for EPS growth but also for P/E ratios. We calculate price ranges taking into account the combined maximum and minimum impacts of earnings growth and valuation shifts. The highs within the price range represent our anticipated upper end of index fluctuations due both to earnings surprises and valuations, which we believe will experience bouts of interim volatility so long as market trading remains dominated by foreign investors (who on aggregate trade more frequently than domestic investors) even though many classes of domestic investors are likelier to buy and hold. Chart 2: Percentage of total TSE trading volume by foreigners 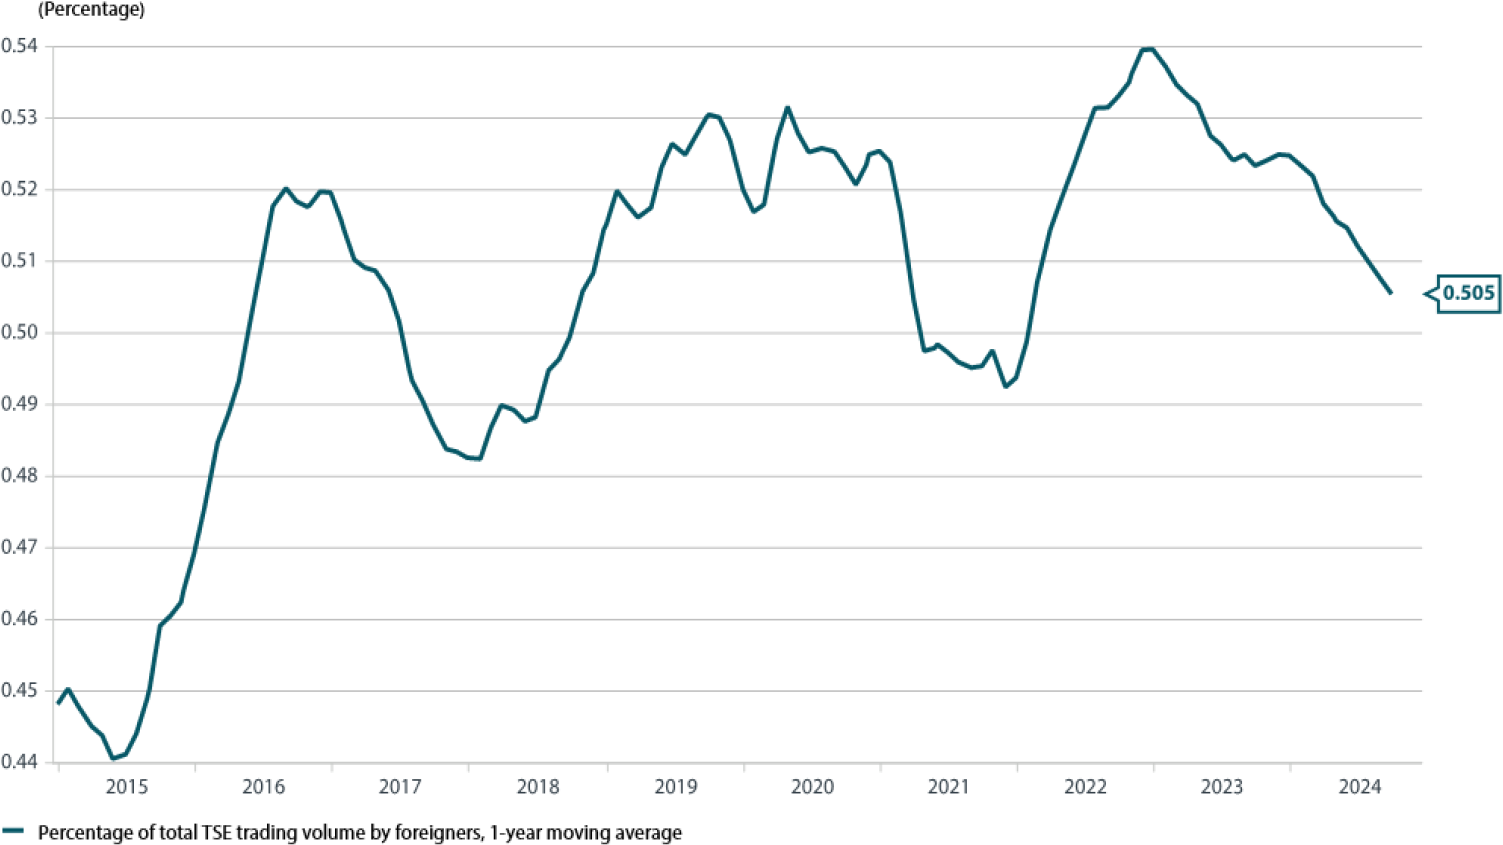
Source: Nikko AM, Tokyo Stock Exchange Risks to our outlook: harbingers of inflationDespite the generally benign outlook to global growth and inflation, our voters cited the following heightened risks that were biased toward the inflationary upside:
Investment strategy conclusion: stay invested, insure against inflationOur anticipated economic outlook remains benign. Although we anticipate a slowdown in US growth, we do not foresee recession as imminent, with the Fed's pre-emptive rate cut already contributing to accommodative financial conditions due to its anticipatory impact on financial markets. Accommodative financial conditions remain supportive near-term. Meanwhile, though it remains difficult to anticipate the timing of market-related corrections, we also signal heightened tail risks associated with policy uncertainty surrounding elections in the US as well as the potential for even small disappointments in economic data and policy to exercise a greater impact on asset markets and therefore growth in the future. We see the risks as biased toward the inflationary, and also foresee the disparity in outlooks priced in by the US bond and stock markets as ultimately unsustainable. In the event of upside risks to inflation, holding stocks (however volatile) may help protect the future purchasing power of investors, while upside may be limited for bonds, even if central banks do deliver easing as anticipated. For this reason, we continue to see demand for assets that are typically resilient to inflation that may also provide diversification hedges against US market risk. We favour gold and increasing exposure to Japanese domestic demand, which is showing signs of sustainable structural recovery and is less correlated with US growth and stimulus than export-oriented firms. The GIC's guidance ranges may be found in Appendix 1 of this document. A note on changes to the Global Investment Committee Process: In June 2024, we made changes to the Global Investment Committee, as to align our quarterly Outlook more closely with the views underlying our portfolio investments. In lieu of forecasts, we have chosen to provide guidance ranges for indicators and indices that we feel most closely relate to the asset classes we manage. In place of forecasts the Global Investment Committee now provide aggregate guidance at the median for our central outlook, and at the 25th and 75th percentiles. The asset classes represented in our Outlook can change over time, depending on what is most representative of our active investment views. In the event full ranges are not available, this may be interpreted as to mean that the asset class is not a central focal point for our highest conviction investment views. Appendix 1: GIC Outlook guidanceGlobal macro indicators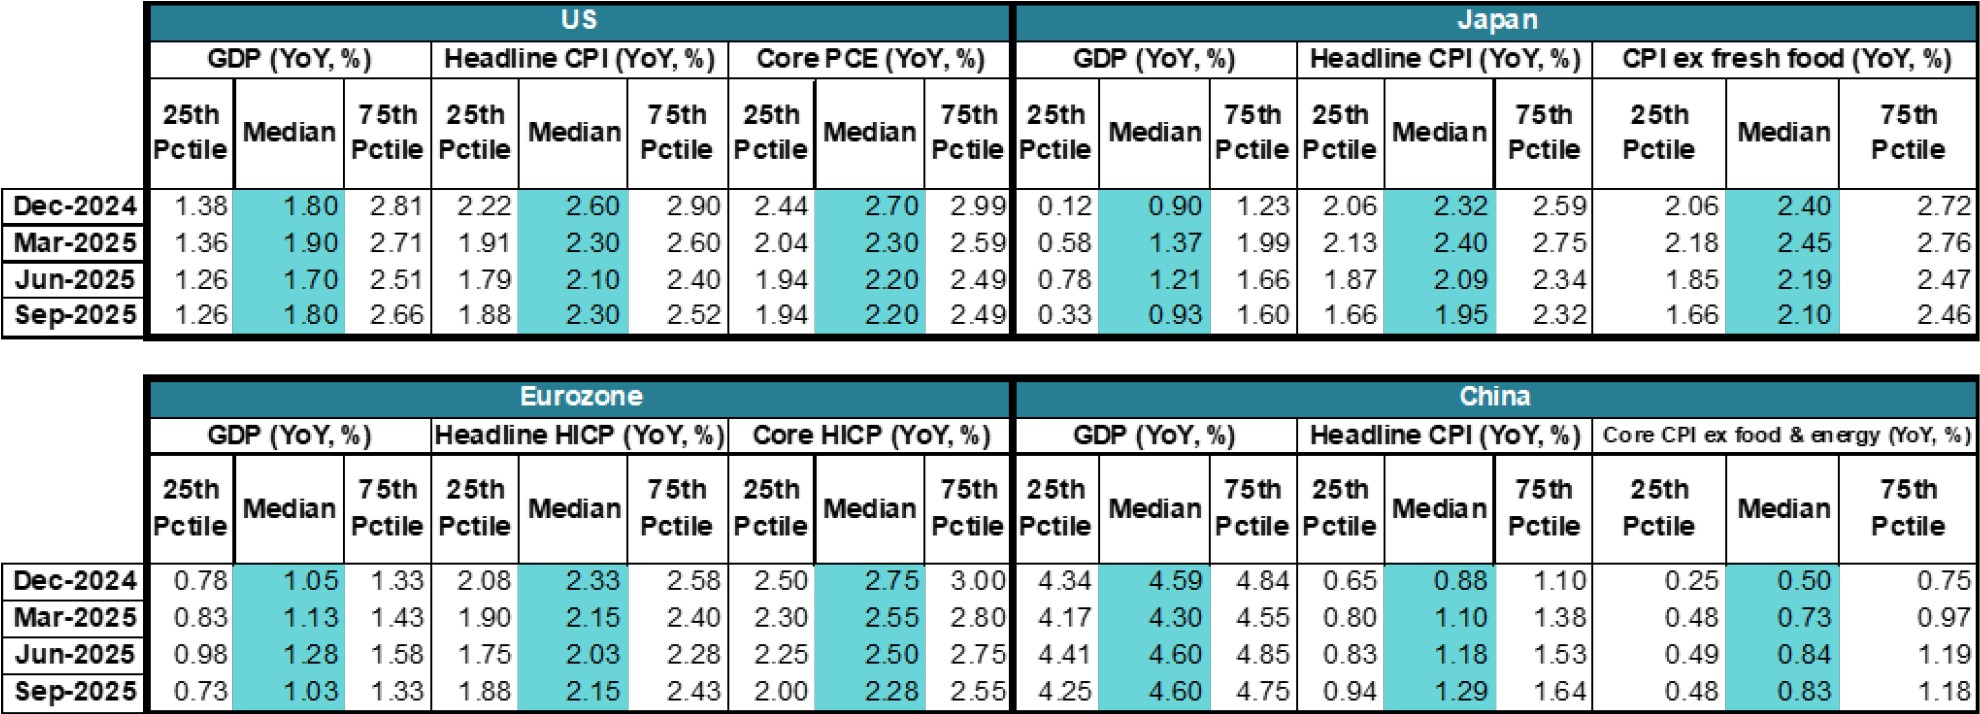
Central bank rates, forex, fixed income and commodities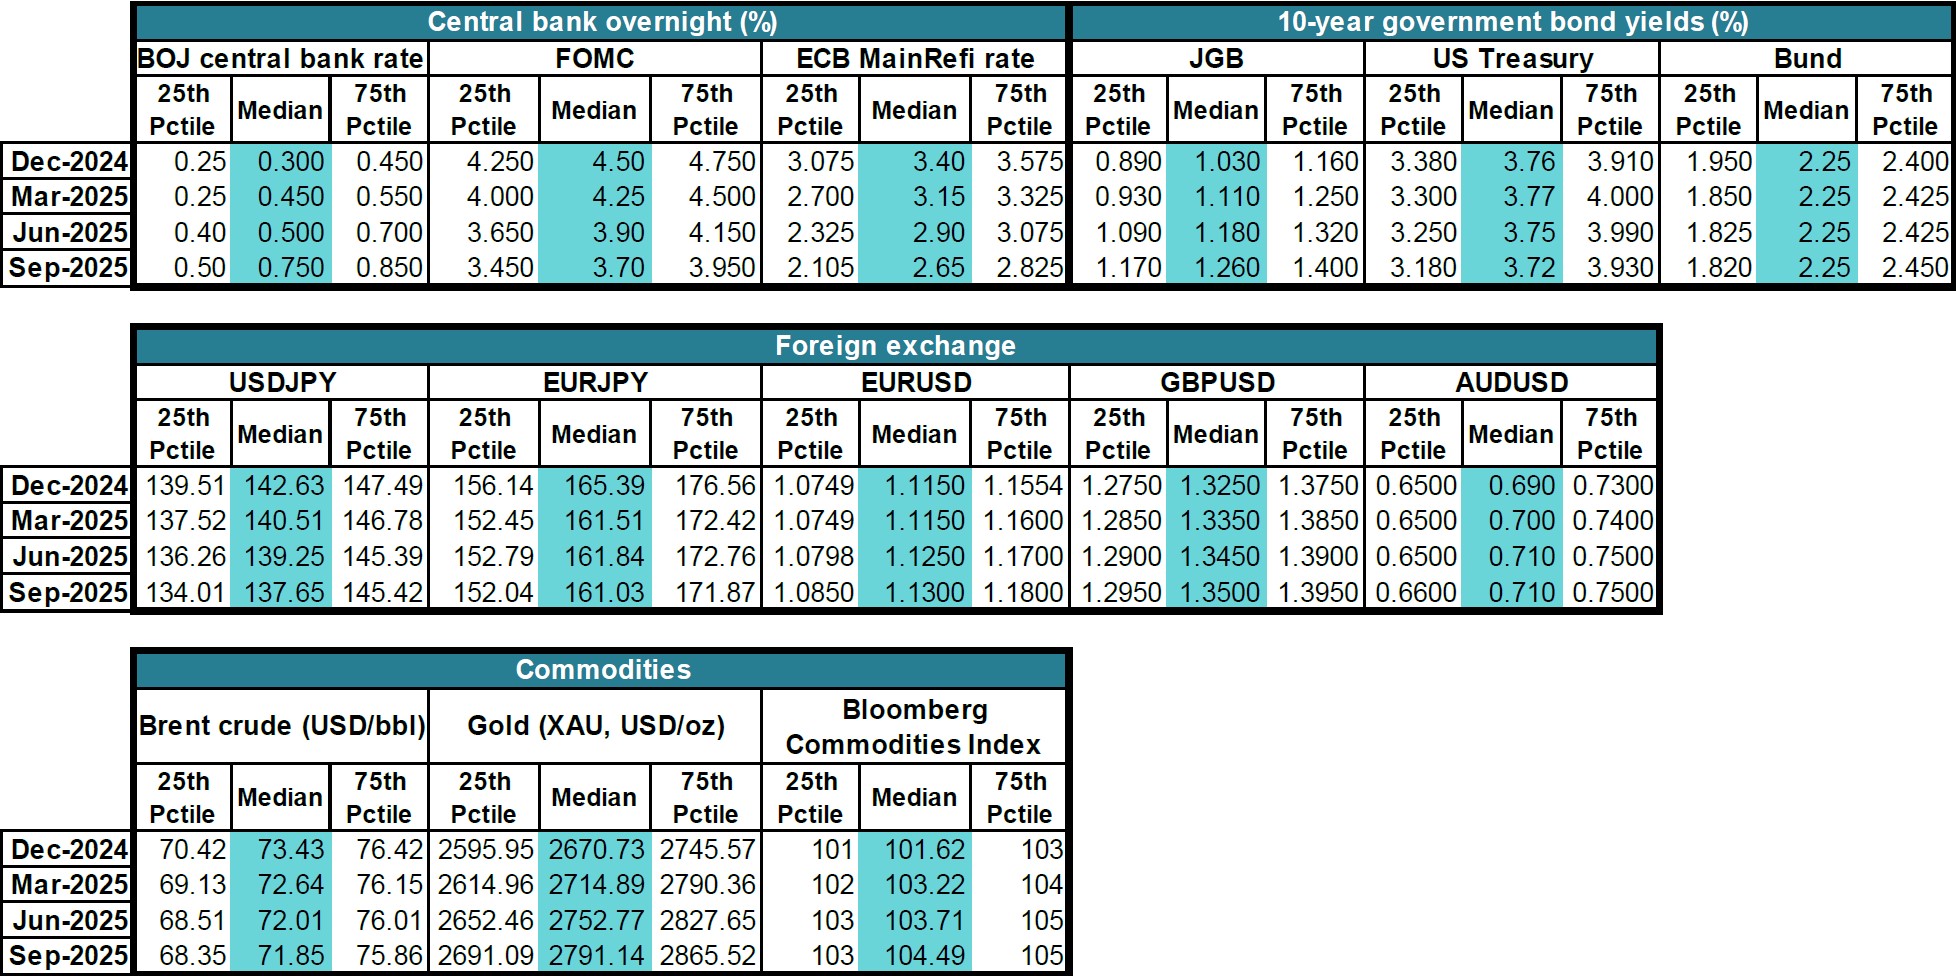
Equities
Funds operated by this manager: Nikko AM ARK Global Disruptive Innovation Fund, Nikko AM Global Share Fund Important disclaimer information Please note that much of the content which appears on this page is intended for the use of professional investors only. |


17 Oct 2024 - Performance Report: Skerryvore Global Emerging Markets All-Cap Equity Fund
[Current Manager Report if available]

17 Oct 2024 - The China Pivot: This Time Is Different
|
The China Pivot: This Time Is Different Ox Capital (Fidante Partners) October 2024 Ox Capital has always believed the "perceived" structural problems in China are well discounted by the cheap valuations of Chinese stocks. Furthermore, the underlying issues are less severe than commonly believed for a few reasons.
At Ox, we believe this time is different. The authorities are addressing the important issues.
In addition, there are more policies being considered.
While China has some structural issues, not unlike most other major economies, we have always believed that the key drag to the HK/China share market was a lack of willingness to sufficiently relax policies to tackle the deflationary impulse resulted from property market adjustment. It appears that the direction and magnitude of these new measures can potentially address these challenges. The stock market related measures have the potential to re-invigorate the market and so far the impact is encouraging with share market trading volume in both the Mainland and HK surging with rising stock prices. The property market relaxation policies should stabilise prices. If the authorities follow up by tackling some of the longer-term issues, such as local government finances and income distribution (via taxes and direct transfers), this can improve the fiscal sustainability, defuse risks for the economy and boost end consumption demand. This pivot from the authorities can ignite the long-awaited Chinese economy reflation. Given the extremely attractive valuations, upside from here can be highly rewarding. Funds operated by this manager: Ox Capital Dynamic Emerging Markets Fund Important Information: This material has been prepared by Ox Capital Management Pty Ltd (Ox Cap) (ABN 60 648 887 914) Ox Cap is the holder of an Australian financial services license AFSL 533828 and is regulated under the laws of Australia. This document does not relate to any financial or investment product or service and does not constitute or form part of any offer to sell, or any solicitation of any offer to subscribe or interests and the information provided is intended to be general in nature only. This should not form the basis of, or be relied upon for the purpose of, any investment decision. This document is not available to retail investors as defined under local laws. This document has been prepared without taking into account any person's objectives, financial situation or needs. Any person receiving the information in this document should consider the appropriaten |

16 Oct 2024 - Performance Report: Airlie Australian Share Fund
[Current Manager Report if available]

16 Oct 2024 - Glenmore Asset Management - Market Commentary
|
Market Commentary - September Glenmore Asset Management October 2024 Globally, equity markets were broadly positive in September. In the US, the S&P 500 rose +2.0%, the Nasdaq increased +2.7%, whilst in the UK, the FTSE declined -1.7%. In Australia, the All Ordinaries Accumulation Index outperformed, rising +3.5%. The top performing sectors on the ASX were resources and technology, whilst healthcare was the worst performer. Resources was boosted by news of stimulus from the Chinese government, following a period of weak economic growth, whilst technology benefited from lower bond rates as the US Federal Reserve commenced its easing cycle. Notably, small caps outperformed large caps on the ASX (ASX small ords increased +5.1%) as investor risk appetite improved. As discussed, a key event for equity markets in September was the US Federal Reserve cutting interest rates by 0.5% due to inflation reaching acceptable levels and a slowing economy. Whilst the event was expected by the markets, it is still an important milestone for equities, particularly small/mid cap stocks. Currently, Australia is not as close to rate cuts as the US, however we believe some easing in monetary policy is likely in the next 9-12 months. In bond markets, the US 10 year government bond yield fell -8 basis points to 3.78%, whilst in Australia the 10 year bond rate was flat at 3.97%. Funds operated by this manager: |
15 Oct 2024 - Performance Report: Glenmore Australian Equities Fund
[Current Manager Report if available]

15 Oct 2024 - Performance Report: Bennelong Concentrated Australian Equities Fund
[Current Manager Report if available]

15 Oct 2024 - New Funds on Fundmonitors.com
|
New Funds on FundMonitors.com |
|
Below are some of the funds we've recently added to our database. Follow the links to view each fund's profile, where you'll have access to their offer documents, monthly reports, historical returns, performance analytics, rankings, research, platform availability, and news & insights. |
 |
||||||||||||||||||||||
| Dimensional Global Core Equity Trust (AUD Hedged Class) - Active ETF | ||||||||||||||||||||||
|
||||||||||||||||||||||
| View Profile | ||||||||||||||||||||||
| Dimensional Global Core Equity Trust (Unhedged Class) - Active ETF | ||||||||||||||||||||||
|
||||||||||||||||||||||
| View Profile | ||||||||||||||||||||||
| Dimensional Emerging Markets Sustainability Trust | ||||||||||||||||||||||
|
||||||||||||||||||||||
| Dimensional Emerging Markets Value Trust | ||||||||||||||||||||||
|
||||||||||||||||||||||
| Dimensional Global Large Company Trust | ||||||||||||||||||||||
|
||||||||||||||||||||||
| View Profile | ||||||||||||||||||||||
 |
||||||||||||||||||||||
| Vanguard Balanced Index Fund | ||||||||||||||||||||||
|
||||||||||||||||||||||
| View Profile | ||||||||||||||||||||||
|
Want to see more funds? |
||||||||||||||||||||||
|
Subscribe for full access to these funds and over 850 others |

14 Oct 2024 - Performance Report: Quay Global Real Estate Fund (Unhedged)
[Current Manager Report if available]