
NEWS

30 Oct 2024 - Performance Report: Insync Global Capital Aware Fund
[Current Manager Report if available]

30 Oct 2024 - Stock Story: Medibank
|
Stock Story: Medibank Airlie Funds Management October 2024 |
|
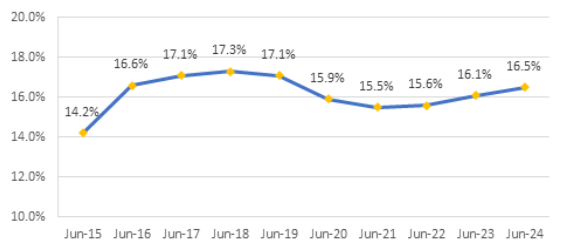
Playing a pivotal role in Australia's health transition. The Medibank and ahm private health insurance brands serve over 4.2m customers and play a vital role in funding medical care in Australia. In the most recent financial year, Medibank paid out $6.3bn in health insurance claims, taking a significant burden off the public healthcare system. Yet recently, the sector has come under fire from both the government and hospitals accused of making too much profit. In this article, we explore this regulatory tension and why we think Medibank looks an attractive investment opportunity. Private hospital profits affected by new models of careThere is no doubt the past few years have been challenging for hospitals - labour shortages have affected service levels and inflation has been rampant. Private hospital operators have responded by launching a campaign against the health insurers and pressuring the government for a bailout. While additional payments or a tax may provide short-term relief to hospitals, they do not solve the structural issues facing the sector and ultimately would drive up the cost of healthcare and premiums for millions of Australians. To build a sustainable private healthcare system, all participants must work together to find efficiencies and drive down the overall cost of care. Medibank is doing its part to lower costs by investing in new models of care away from overnight stays in expensive acute care hospitals to virtual, short-stay hospitals and home care. Without this transition, Medibank estimates the government will need to spend 50% more on healthcare as a percentage of GDP in forty years. While this transition does come at the expense of hospitals that typically earn more for longer in-hospital stays, it is beneficial for the wider healthcare system. Higher hospital costs would simply translate to higher premiums, which are likely to push more members out of private health insurance and place further strain on an already stretched public healthcare system. It is for this reason the Federal Health Minister following a review has conceded, "There's no silver bullet from Canberra or funding solution from taxpayers to deal with what are essentially private pressures in the system". Ultimately, it is not the government's job to prop up unprofitable business models and in some cases it is healthy for some private hospitals to shut where there is overcapacity in the system. Has Medibank profited at the expense of hospitals? Medibank has stuck to its promise not to profit from the pandemic and returned a total of $1.46bn in givebacks to customers for permanent claims savings due to COVID-19. This is evident in the chart below which shows Medibank's health insurance gross profit margin is still below FY19 levels.
Source: Company filings
|

29 Oct 2024 - Performance Report: TAMIM Fund: Global High Conviction Unit Class
[Current Manager Report if available]
29 Oct 2024 - Performance Report: Insync Global Quality Equity Fund
[Current Manager Report if available]

29 Oct 2024 - Magellan Global Quarterly Update
|
Magellan Global Quarterly Update Magellan Asset Management October 2024 |
|
Arvid Streimann, Nikki Thomas and Alan Pullen discuss key market themes and how the global strategy is positioned to capitalise on emerging opportunities, whilst monitoring the risks. Arvid also discusses the potential market impacts of the upcoming US election based on various possible outcomes. |
|
Funds operated by this manager: Magellan Global Fund (Hedged), Magellan Global Fund (Open Class Units) ASX:MGOC, Magellan High Conviction Fund, Magellan Infrastructure Fund, Magellan Infrastructure Fund (Unhedged), MFG Core Infrastructure Fund, Magellan Core ESG Fund Important Information: Important Information: This material has been delivered to you by Magellan Asset Management Limited ABN 31 120 593 946 AFS Licence No. 304 301 ('Magellan') and has been prepared for general information purposes only and must not be construed as investment advice or as an investment recommendation. This material does not take into account your investment objectives, financial situation or particular needs. This material does not constitute an offer or inducement to engage in an investment activity nor does it form part of any offer documentation, offer or invitation to purchase, sell or subscribe for interests in any type of investment product or service. You should obtain and consider the relevant Product Disclosure Statement ('PDS') and Target Market Determination ('TMD') and consider obtaining professional investment advice tailored to your specific circumstances before making a decision about whether to acquire, or continue to hold, the relevant financial product. A copy of the relevant PDS and TMD relating to a Magellan financial product may be obtained by calling +61 2 9235 4888 or by visiting www.magellangroup.com.au. Past performance is not necessarily indicative of future results and no person guarantees the future performance of any financial product or service, the amount or timing of any return from it, that asset allocations will be met, that it will be able to implement its investment strategy or that its investment objectives will be achieved. This material may contain 'forward-looking statements'. Actual events or results or the actual performance of a Magellan financial product or service may differ materially from those reflected or contemplated in such forward-looking statements. This material may include data, research and other information from third party sources. Magellan makes no guarantee that such information is accurate, complete or timely and does not provide any warranties regarding results obtained from its use. This information is subject to change at any time and no person has any responsibility to update any of the information provided in this material. Statements contained in this material that are not historical facts are based on current expectations, estimates, projections, opinions and beliefs of Magellan. Such statements involve known and unknown risks, uncertainties and other factors, and undue reliance should not be placed thereon. No representation or warranty is made with respect to the accuracy or completeness of any of the information contained in this material. Magellan will not be responsible or liable for any losses arising from your use or reliance upon any part of the information contained in this material. Any third party trademarks contained herein are the property of their respective owners and Magellan claims no ownership in, nor any affiliation with, such trademarks. Any third party trademarks that appear in this material are used for information purposes and only to identify the company names or brands of their respective owners. No affiliation, sponsorship or endorsement should be inferred from the use of these trademarks. This material and the information contained within it may not be reproduced, or disclosed, in whole or in part, without the prior written consent of Magellan. |

28 Oct 2024 - New Funds on Fundmonitors.com
|
New Funds on FundMonitors.com |
|
Below are some of the funds we've recently added to our database. Follow the links to view each fund's profile, where you'll have access to their offer documents, monthly reports, historical returns, performance analytics, rankings, research, platform availability, and news & insights. |
 |
||||||||||||||||||||||
| Dimensional Sustainability World Equity Trust | ||||||||||||||||||||||
|
||||||||||||||||||||||
| View Profile | ||||||||||||||||||||||
| Dimensional World Equity Trust | ||||||||||||||||||||||
|
||||||||||||||||||||||
| View Profile | ||||||||||||||||||||||
 |
||||||||||||||||||||||
| TAMIM Australia All Cap | ||||||||||||||||||||||
|
||||||||||||||||||||||
 |
||||||||||||||||||||||
| EQT Nexus Fund (AUD) | ||||||||||||||||||||||
|
||||||||||||||||||||||
| View Profile | ||||||||||||||||||||||
 |
||||||||||||||||||||||
| Realm Strategic Income Fund | ||||||||||||||||||||||
|
||||||||||||||||||||||
| View Profile | ||||||||||||||||||||||
|
Want to see more funds? |
||||||||||||||||||||||
|
Subscribe for full access to these funds and over 850 others |

25 Oct 2024 - Hedge Clippings | 25 October 2024
|
|
|
|
Hedge Clippings | 25 October 2024 It's going down to the wire, and seemingly too close to call. The US election is now less than two weeks away, and with it will come all the drama, speculation, and, of course, the potential for significant economic consequences across the globe, and potentially social upheaval in the US itself. Here in Australia we're no strangers to feeling the ripple effects of US political shifts. If Donald Trump regains the presidency, we may be looking at a return to the good (or not so good) old days of trade tensions and tariffs, particularly with China. This could spell trouble for our commodities sector and create turbulence for market confidence - after all, the last thing our economy needs is another round of "trade war" antics. Meanwhile, back at home, the Reserve Bank of Australia and Treasurer Jim Chalmers are not exactly on the same page about inflation. Chalmers has been cautiously optimistic, pointing to the halving of inflation since Labor took office. But the RBA, led by Deputy Governor Andrew Hauser, isn't ready to declare victory just yet. The RBA remains wary, maintaining that inflation is still proving to be a persistent thorn, and it'll take a while before we can truly say it's tamed. The cash rate, held at 4.35% for eleven months now, is staying put - the RBA wants more evidence before even considering an ease in rates. And it's no wonder they're being cautious. Global uncertainties, including the turmoil in the Middle East, are pushing investors into safe-haven assets like gold, which has reached record highs. The financial world might be feeling "spectacularly optimistic," but Hauser has made it clear that the RBA isn't buying into the hype just yet. Inflation forecasts from the RBA and the IMF are now closely aligned, underscoring the complexity of the current situation. Chalmers might be waving the flag of optimism, but the RBA is sticking to a message of patience - steady does it, until they're sure the inflation beast is fully under control. One thing's for sure: there's no shortage of interesting times ahead for the world, and with it, the Australian economy. News & Insights New Funds on FundMonitors.com Investment Perspectives: 10 charts that recently caught our eye | Quay Global Investors September 2024 Performance News Digital Income Fund (Digital Income Class) Equitable Investors Dragonfly Fund Bennelong Twenty20 Australian Equities Fund |
|
|
If you'd like to receive Hedge Clippings direct to your inbox each Friday |

25 Oct 2024 - Performance Report: Digital Income Fund (Digital Income Class)
[Current Manager Report if available]

25 Oct 2024 - Why Australians Are Embracing ETFs
|
Why Australians Are Embracing ETFs Janus Henderson Investors September 2024 From liquidity to diversification, ETFs provide a valuable opportunity for both newcomers and seasoned investors. Discover five reasons why ETFs are becoming increasingly popular among Australian investors. Exchange Traded Funds (ETFs) are pooled investment securities that trade on exchanges like the ASX (Australian Securities Exchange) and are becoming increasingly popular among investors in Australia and around the world. These funds offer flexibility, cost-effectiveness and broad market exposure, making them an attractive option for investors of all levels of experience. Here are five reasons why investors are increasingly drawn to ETFs: 1. ETFs are liquidLiquidity is one of the most important features investors are seeking in a fund. Investors are attracted to ETFs because they generally have high liquidity, meaning they are usually easier to buy and sell compared with some other funds and asset classes. An indicator as to whether an ETF is highly liquid is its bid-ask spread, or the difference between what price buyers are prepared to pay and what price sellers are prepared to accept. Generally a lower spread indicates higher liquidity (i.e. greater demand to buy and sell). As a unit holder in an ETF, it is important to note that the fund manager owns the underlying shares. On rare occasions an ETF can have liquidity issues when the manager cannot sell the underlying shares or doesn't believe there's fair value in the event of selling its shares. 2. DiversificationETFs also provide built-in diversification due to the way the product is designed. You have probably heard the old saying 'don't put all your eggs in one basket.' An ETF automatically avoids this by allocating your holdings across several assets, depending on the type of ETF. For those who are newer to investment markets, ETFs can help simplify the investment process by bundling assets such as shares or bonds into a single fund, offering investors instant diversification. For example, an ETF that tracks the ASX200 includes shares from 200 different companies that are listed on the Australian exchange. This reduces the impact of any single company's poor performance, helping new investors manage risk more effectively. In some cases, investors can buy an ETF that will cover thousands of different companies across the world, while others will be more asset or sector specific. 3. Demystify investing for new investorsInvesting in managed funds can seem overwhelming to beginners, with intricate forms and fee structures and high minimum investments that can be confusing for those without a strong financial background. However, investing in an ETF is like investing in ordinary shares. No complex forms or convoluted fee structures allows an investor at any level to easily access sharemarkets.
4. Low costAdditionally, ETFs can be cost effective. Some passive ETFs have lower fees compared with managed funds and can be bought and sold on major stock exchanges throughout the trading day, just like individual stocks. The downside to these passive ETFs is they will produce the average return for the market. An active ETF, which might have a higher fee, can outperform its benchmark, depending on the skills of the fund manager. This accessibility and affordability make ETFs an attractive option for new investors looking to start investing without a significant upfront cost. Although costs will vary depending on the structure and type of ETF, if you are looking to understand the fees on a particular ETF, you can read the product disclosure statement which will outline all the relevant information. 5. Access benefits of global marketsETFs also make it easier for investors to access numerous types of investment markets. Whether it is investing in international share markets, bonds, currencies, commodities or even crypto assets, there is an ETF that will suit your needs. The aim of buying ETFs across various parts of the world is it can be a useful diversification tool because you are reducing the impact of market volatility in any single location. The Australian market represents only a small portion of the global market capitalisation (less than 2%) and the Australian market is also heavily concentrated in financials and materials sectors, which may limit your overall diversification and potential growth opportunities. Investing globally helps spread your risk across different economies and regions, reducing the impact of any single country's market fluctuations on your portfolio. ETFs are also run by professional investment managers, with each typically giving investors the type of exposures they would otherwise struggle to find themselves. Janus Henderson Active ETFs provide investors with access to the expertise of our professional investment managers globally, with a deep-rooted research culture underpinned by our 90-year track record of investing. An example of how ETFs can provide greater access for investors can be found when buying globally diversified bonds. Traditionally, these have been reserved for more affluent Australians, with the minimum buy in usually starting out at $500,000. But with ETFs, you get access to the same fund managers, but at a much lower starting point. |
|
Funds operated by this manager: Janus Henderson Australian Fixed Interest Fund, Janus Henderson Australian Fixed Interest Fund - Institutional, Janus Henderson Cash Fund - Institutional, Janus Henderson Conservative Fixed Interest Fund, Janus Henderson Conservative Fixed Interest Fund - Institutional, Janus Henderson Diversified Credit Fund, Janus Henderson Global Equity Income Fund, Janus Henderson Global Multi-Strategy Fund, Janus Henderson Global Natural Resources Fund, Janus Henderson Tactical Income Fund All opinions and estimates in this information are subject to change without notice and are the views of the author at the time of publication. Janus Henderson is not under any obligation to update this information to the extent that it is or becomes out of date or incorrect. The information herein shall not in any way constitute advice or an invitation to invest. It is solely for information purposes and subject to change without notice. This information does not purport to be a comprehensive statement or description of any markets or securities referred to within. Any references to individual securities do not constitute a securities recommendation. Past performance is not indicative of future performance. The value of an investment and the income from it can fall as well as rise and you may not get back the amount originally invested. Whilst Janus Henderson believe that the information is correct at the date of publication, no warranty or representation is given to this effect and no responsibility can be accepted by Janus Henderson to any end users for any action taken on the basis of this information. |


24 Oct 2024 - Performance Report: Equitable Investors Dragonfly Fund
[Current Manager Report if available]