NEWS

8 Nov 2024 - Artificial Intelligence will change the world (eventually)
|
Artificial Intelligence will change the world (eventually) Alphinity Investment Management October 2024
|
|
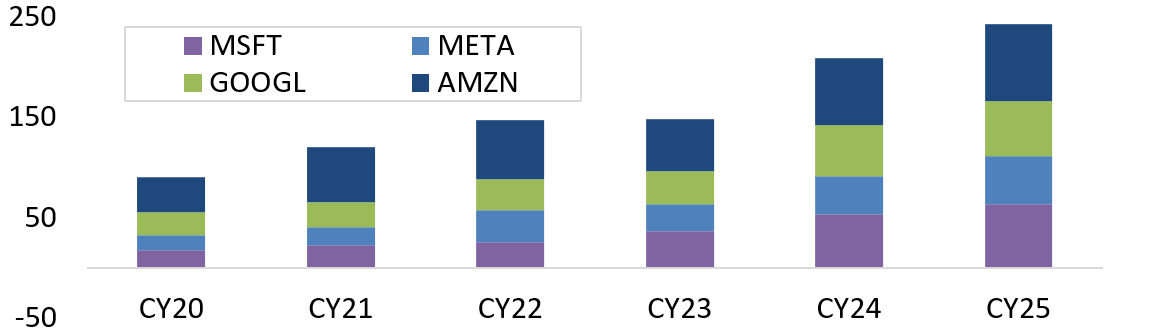
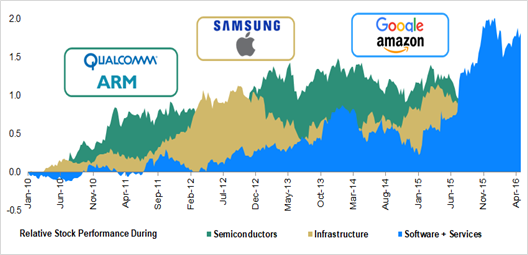
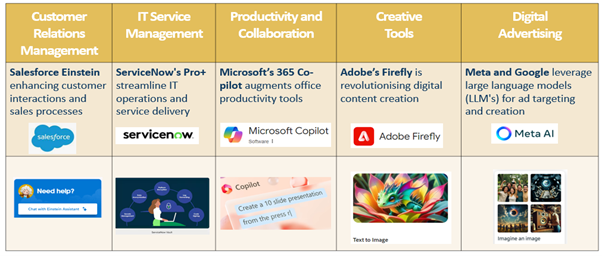
"The risk of underinvesting is dramatically greater than the risk of overinvesting" (Sundar Pichai, Alphabet CEO, 23rd July 2024). This quote from the Alphabet CEO during the Alphabet 2Q earnings call amplified investor concerns around the current Artificial Intelligence ("AI") investment landscape. The technology industry appears to be engaged in a high-stakes race to develop AI infrastructure, while the potential returns on these massive investments remain ambiguous. Given the substantial market share and valuation premiums now commanded by AI-focused companies, there's mounting pressure for these firms to demonstrate tangible returns on their AI investments. Investors are increasingly looking for concrete evidence that the massive capital inflows into AI infrastructure and development will translate into sustainable revenue streams and long-term profitability. Despite market impatience, we are observing encouraging signs of AI's impact starting to emerge from both the revenue and expense sides of businesses. Substantial returns will however take time to materialise. Given the current market dynamics, we remain nimble with our AI exposure in the short term, but unequivocally convinced on the longevity and scale of the AI opportunity over the long term. Where are the returns?Market concerns around overinvesting in AI are not without precedent given the technology sector's history of several technology boom-and-bust cycles: From the 1990's internet era exuberance leading to the dot.com crash, to the recent hype around the metaverse (virtual worlds), Web 3 (decentralised internet vision), and even non-fungible tokens (NFT's). These examples serve as cautionary tales, illustrating how technology hype can outpace real-world applications, leaving a trail of poor returns and crushed share prices in their wake. Current investment levels into AI architecture are extraordinary. Hyperscaler (Microsoft (NASDAQ: MSFT), META (NASDAQ: META), Alphabet (NASDAQ: GOOGL) & Amazon (NASDAQ: AMZN)) capex will rise more than 40% in CY24 and is expected to rise further in CY25 to levels 2.5x what they were in CY20. This level of investment is starting to have an impact on financial returns for these companies, both in terms of cash flow returns and on margins as higher depreciation flowing from this investment begins to bite in the P&L. Hyperscaler Capex ($bn) Returns take time to materialiseIn any major technological transition - be it internet, cloud computing, or the current wave of generative AI, there is a consistent pattern: infrastructure development precedes widespread application and the realisation of value. The internet evolution provides a compelling case study, where the true value from end applications and the resultant share price movements only started to emerge after 3 years and really gathered momentum after 5 years. Internet Cycle Stock Performance We can see a similar phenomenon play out with generative AI. Cloud AI services are beginning to inflect, as evidenced by recent results showing a reacceleration in cloud demand but several cutting-edge AI applications such as Edge AI, Smart Robots and Multi-Agent Systems are still in development and yet to reach widespread commercial deployment. Where are the end applications?Contrary to the notion that end applications of AI are not yet visible, we're witnessing a robust proliferation of AI-powered solutions across various sectors already emerging just ~20 months after the emergence of GEN AI. While these applications are in their initial phases and will take time to scale, their market potential is substantial. Take for example the M365 co-pilot example: a US$30 subscription fee per month across their 160m high value commercial users, could add $58bn revenue annually (a +23% lift to FY24 revenue). Expansion to the remaining 200m commercial users and integration into broader product offerings offer additional upside. Returns from "efficiencies"The impact of generative AI on business efficiency and productivity is emerging as a transformative force, with potential returns far exceeding initial revenue gains. This trend, while significant, remains underappreciated due to public concerns about AI-driven job displacement. However, real-world applications are already demonstrating substantial benefits across diverse industries. Companies are implementing AI with measurable success. For example:
Importantly, companies are beginning to qualify these benefits well beyond the bounds of tech:
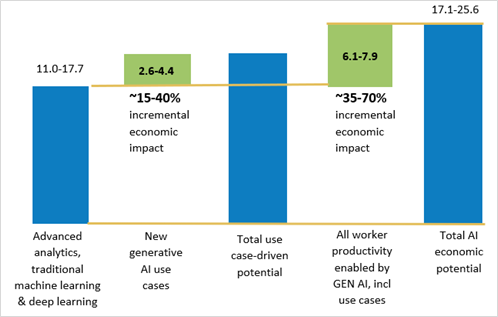
The list goes on. The adoption of generative AI is rapidly expanding, with companies across various sectors reporting emerging and expanding use cases. How to quantify these returnsQuantifying the actual returns from generative AI can be a difficult exercise. For example, disaggregating how much of the Meta revenue acceleration comes from product enhancement due to Gen AI is complex, as is product augmentations flowing from its application to existing capabilities. Stepping back to a broader economic perspective, McKinsey undertook a study trying to piece together the incremental value that generative AI could bring. The total value was $6.1tr - $7.9tr annually across specific generative AI use cases and general productivity. Taking specific use cases, McKinsey's comprehensive analysis of generative AI applications provides a detailed roadmap of its potential impact across various business functions. McKinsey identified activities within business functions where generative AI could be applied and then calculated both the efficiency impact (as a % of functional spend) and the aggregate size of the opportunity. Remarkably, 75% of the generative AI impact was across a handful of functions spanning sales, marketing, product R&D, customer operations and software engineering, estimated to be a c$400-500bn impact across each function. Interestingly, we are beginning to get validation of some of these data points in our conversations with company management teams, for example in software engineering the efficiency/cost boost figure of c. 30% is now being discussed. Looking ahead, we will continue to monitor validation points of this return profile, but if this current trajectory of efficiency gains persists across various business functions, it suggests that the substantial investments in AI infrastructure are likely to be more than justified. |
|
Funds operated by this manager: Alphinity Australian Share Fund, Alphinity Concentrated Australian Share Fund, Alphinity Global Equity Fund, Alphinity Global Sustainable Equity Fund, Alphinity Sustainable Share Fund |

7 Nov 2024 - Debunking a myth about fossil fuels and sustainable fixed interest
|
Debunking a myth about fossil fuels and sustainable fixed interest Pendal October 2024 |
|
Exclusion of fossil fuels presents minimal challenges for sustainable bonds compared to other asset classes, writes Pendal head of credit and sustainable strategies, GEORGE BISHAY SUSTAINABLE funds typically screen out industries such as fossil fuels, tobacco, weapons, alcohol, gaming, pornography and uranium mining. This is generally with a revenue threshold, where companies with a certain level of revenue linked to a particular activity are screened out. Different asset classes have different potential exposures to fossil fuels. Fossil fuel companies typically make up a large part of equities indices (about 15 per cent of the ASX 300 in July 2024). By contrast, issuers involved in fossil fuel extraction, exploration or refining are a small component of the Australian fixed-income benchmark. Chart 1 below shows these issuers make up only about 0.1 per cent of the Australian fixed income benchmark, according to the rules applied to Pendal Sustainable Australian Fixed Interest Fund (see Chart 1 footnote below).

However, there can be variations in the exclusions of different funds.For example, in Australian equities a fund's revenue threshold can dictate whether a company such as BHP (at about 9% weight in the ASX300 index) is included or not. BHP's revenue includes coal mining. Other iron ore miners such as Fortescue Metals and Rio Tinto are not typically excluded. Notwithstanding these variations in exclusions, active performance in the average sustainable equity fund is influenced by changes in oil prices. As a result of these differing levels of benchmark exposure, sustainable fixed-income portfolios in Australia are less sensitive to the movements in oil prices than equity counterparts. What drives the active performance of Pendal Sustainable Fixed Interest Fund?Active credit management is the main driver of excess returns in Pendal Sustainable Australian Fixed Interest Fund. The green circles in the chart below highlight periods when the manager's active de-risking and re-risking of its credit exposures process led to strong outperformance. These returns are driven by active management and are delivered despite rising oil markets. The black circle highlights a period of rising inflation concerns due to Covid supply chain issues driving goods inflation and central bank hiking fears. This led to a risk-off event in credit markets which saw most active fixed-income funds underperform the benchmark.

Given the volatility of oil markets, Pendal Sustainable Australian Fixed Interest Fund has delivered consistent returns, outperforming its benchmark in 75%1 of months since inception to July 2024. The chart below illustrates the number of excess return months under different buckets of excess returns.

Social and environmental benefit + portfolio diversification benefitMany sustainable fixed-income investors are attracted to ESG-labelled bonds which aim to address green, social and sustainability issues. The proceeds of these bonds are usually ring-fenced for specific environmental or social projects to support climate stability and/or the underserved in society. The Australian ESG labelled fixed-income market was valued at some $A124 billion in August 2024, constituting 7.6% of the total Australian fixed-income benchmark. The ESG-labelled bond market offers sustainable Australian fixed interest managers exposure to an additional opportunity set beyond traditional fixed income - environmental and social projects across varying sectors, credit qualities and tenors. These labelled bonds can complement an overall fixed-income portfolio, bringing added diversification benefits. The credit spread on these bonds may not directly follow the credit spread on an equivalent vanilla bond issued by the same issuer. This arises from the different technical supply and demand factors affecting these types of bonds. These bonds are desirable and often in greater demand than vanilla counterpart bonds. The Australian fixed interest market has ESG labelled bonds in 13 of its 14 sub-sectors (transport is the only missing sector), providing investors with the ability to diversify across numerous sectors. In August 2024, the Pendal Sustainable Australian Fixed Interest fund held more than 66% in ESG-labelled securities. Sustainable fixed income as part of your core fixed income allocationUnlike sustainable equities, which may underperform during periods of rising oil prices, Australian sustainable fixed-income exhibits minimal sensitivity to oil markets or any other screened activities. This differentiation allows investors to integrate sustainable fixed income into their overall core fixed interest allocation with minimal additional benchmark risk. By incorporating Australian sustainable fixed income alongside other traditional assets, investors can achieve a robust portfolio while also supporting climate stability and/or the underserved in society. Author: George Bishay |
|
Funds operated by this manager: Pendal Global Select Fund - Class R, Pendal Horizon Sustainable Australian Share Fund, Pendal MicroCap Opportunities Fund, Pendal Multi-Asset Target Return Fund, Pendal Sustainable Australian Fixed Interest Fund - Class R, Pendal Sustainable Australian Share Fund, Regnan Credit Impact Trust Fund, Regnan Global Equity Impact Solutions Fund - Class R |
|
1 Pendal Sustainable Australian Fixed Interest outperformed the Bloomberg AusBond Composite 0+yr in 72 of 96 months from inception (Aug-16) to July 2024, gross of fees. This information has been prepared by Pendal Fund Services Limited (PFSL) ABN 13 161 249 332, AFSL No 431426 and is current as at December 8, 2021. PFSL is the responsible entity and issuer of units in the Pendal Multi-Asset Target Return Fund (Fund) ARSN: 623 987 968. A product disclosure statement (PDS) is available for the Fund and can be obtained by calling 1300 346 821 or visiting www.pendalgroup.com. The Target Market Determination (TMD) for the Fund is available at www.pendalgroup.com/ddo. You should obtain and consider the PDS and the TMD before deciding whether to acquire, continue to hold or dispose of units in the Fund. An investment in the Fund or any of the funds referred to in this web page is subject to investment risk, including possible delays in repayment of withdrawal proceeds and loss of income and principal invested. This information is for general purposes only, should not be considered as a comprehensive statement on any matter and should not be relied upon as such. It has been prepared without taking into account any recipient's personal objectives, financial situation or needs. Because of this, recipients should, before acting on this information, consider its appropriateness having regard to their individual objectives, financial situation and needs. This information is not to be regarded as a securities recommendation. The information may contain material provided by third parties, is given in good faith and has been derived from sources believed to be accurate as at its issue date. While such material is published with necessary permission, and while all reasonable care has been taken to ensure that the information is complete and correct, to the maximum extent permitted by law neither PFSL nor any company in the Pendal group accepts any responsibility or liability for the accuracy or completeness of this information. Performance figures are calculated in accordance with the Financial Services Council (FSC) standards. Performance data (post-fee) assumes reinvestment of distributions and is calculated using exit prices, net of management costs. Performance data (pre-fee) is calculated by adding back management costs to the post-fee performance. Past performance is not a reliable indicator of future performance. Any projections are predictive only and should not be relied upon when making an investment decision or recommendation. Whilst we have used every effort to ensure that the assumptions on which the projections are based are reasonable, the projections may be based on incorrect assumptions or may not take into account known or unknown risks and uncertainties. The actual results may differ materially from these projections. For more information, please call Customer Relations on 1300 346 821 8am to 6pm (Sydney time) or visit our website www.pendalgroup.com |

6 Nov 2024 - Anticipating the Future of Luxury
|
Anticipating the Future of Luxury Insync Fund Managers October 2024 Investing is more than data; it requires anticipating future trends. This is why relying on past performance is often risky. Generational shifts, rising geopolitical tensions, and evolving consumer behaviours demand excellence in trend spotting. Luxury goods, where China's rising affluent class is undergoing significant changes in spending preferences is a case in point. Whilst luxury has historically been a secular growth story, we believe that more nuanced factors are at play, making active stock picking essential. China's economic challenges have slowed luxury market growth. A notable shift is the rise of "quiet luxury"-- discreet, minimalist products reflecting a reluctance to display wealth. A recent survey revealed that 24.8% of Chinese consumers find Western brands less desirable, with younger generations increasingly favouring niche, culturally aligned local brands. Their younger demographic is now prioritizing experiences over luxury goods. Spending on travel, concerts, and cultural events are taking precedence. Whilst Luxury's long-term growth is supported by global affluence, future affluent consumer's evolving preferences make investing here more complex. China accounts for 23% of global luxury sales today, and 30%-40% of sales by 2030, so understanding their mindset is crucial in identifying the winners. Funds operated by this manager: Insync Global Capital Aware Fund, Insync Global Quality Equity Fund Disclaimer |

5 Nov 2024 - Quarterly State of Trend report - Q3 2024
|
Quarterly State of Trend report - Q3 2024 East Coast Capital Management October 2024 In this update, we present the quarterly State of Trend report for Q3, 2024. Our report covers the performance of Trend Following systems compared with traditional investments such as the S&P/ASX 200 Total Return index, and the Australia "60/40" portfolio. Trend Following provides exposure to a diverse pool of underlying instruments, and implements trading strategies systematically and without emotional biases. Challenger quarter for most trend following systems Although the majority of trend following systems were down for Q3 2024, ECCM's Systematic Trend Fund demonstrated strong positive divergence. Major equity and bond markets delivered positive returns for the quarter as several Central Banks commenced rate cuts. Commodity markets also performed strongly, particularly in agricultural sectors.
Featured chart - Rubber
Funds operated by this manager: |

4 Nov 2024 - New Funds on Fundmonitors.com
|
New Funds on FundMonitors.com |
|
Below are some of the funds we've recently added to our database. Follow the links to view each fund's profile, where you'll have access to their offer documents, monthly reports, historical returns, performance analytics, rankings, research, platform availability, and news & insights. |
 |
||||||||||||||||||||||
| Vanguard High Growth Index Fund | ||||||||||||||||||||||
|
||||||||||||||||||||||
| View Profile | ||||||||||||||||||||||
| Vanguard Growth Index Fund | ||||||||||||||||||||||
|
||||||||||||||||||||||
| View Profile | ||||||||||||||||||||||
| Vanguard Conservative Index Fund | ||||||||||||||||||||||
|
||||||||||||||||||||||
 |
||||||||||||||||||||||
| KKR Global Credit Opportunities Fund - Class A | ||||||||||||||||||||||
|
||||||||||||||||||||||
| View Profile | ||||||||||||||||||||||
|
|
||||||||||||||||||||||
| Canopy Global Small & Mid Cap Fund | ||||||||||||||||||||||
|
||||||||||||||||||||||
| View Profile | ||||||||||||||||||||||
|
Want to see more funds? |
||||||||||||||||||||||
|
Subscribe for full access to these funds and over 850 others |

1 Nov 2024 - Hedge Clippings | 01 November 2024
|
|
|
|
Hedge Clippings | 01 November 2024 The RBA finds itself in a bind yet again. Inflation has eased somewhat, with the September quarter number just 0.2%, or 2.8% annually, down from 3.8% in the June quarter, and taking it to a 3.5-year low. However, it's still running hot enough to make the RBA think twice about cutting rates. When the cash rate decision is announced next week, most experts are expecting rates to stay steady, much to the dismay of borrowers hoping for a bit of early festive cheer, and the Treasurer Jim Chalmers, desperate to claim the credit and hopefully another three years in office come election time next year. The RBA won't be fooled either by the overall number, or Jim Chalmers desire to claim "mission accomplished" George Bush style. Prices for most goods and services rose, offset by large falls for electricity and fuel. The trimmed mean number, which excludes both, was still 3.5%, albeit below June's 4.0 percent. Only government spending is keeping the economy in positive territory, and it's only government handouts that are seriously impacting inflation - for the present. Despite the overall figure, prices of essential items like rent, childcare, and insurance have kept upward pressure on households, with many services demonstrating a particularly stubborn streak. The RBA wants to keep inflation under control without being seen as stifling economic growth, but it's no easy feat. With inflation hovering in a state of "not dead yet," the central bank is likely to maintain its cautious approach. The possibility of a rate cut before year-end remains slim, and if that's the case, borrowers, and the Treasurer, will have to wait until February for any hope of a reprieve. Meanwhile if you hadn't noticed, the United States is gearing up for Election Day next week, with seemingly the rest of the world mesmerised by the spectacle, confused by the process, and concerned about the outcome. From where we sit, it's been a bizarre lead up, with Biden slipping up (literally) and then stepping down, Trump as popular as ever among the MAGA set, in spite of - or maybe because of - multiple indiscretions and crass behaviour or reminiscences from the golf club locker room. We have no idea based on the dead heat polls, but suggest voter turnout is expected to be the key factor when the dust settles (assuming it does). Historically, US voter turnout has fluctuated between just over 50% and 62.8% over the past six presidential elections. However it is unlikely to be the overall voter turnout that will determine the result: Most states are already won or lost, thanks to the winner take all approach by every state except Maine and Nebraska, leaving the result hinged on a handful of votes in the battleground or swing states. But given the personalities and issues at play, it's not the overall turnout that will determine the result. How big a part will Roe vs. Wade play? Or the situation in Gaza, Lebanon, and Israel? And even more recently, to what extent might the Hispanic turnout sway the result? For financial markets and global stability, the stakes are high, and the outcome will not only determine the next leader but also affect the ability to govern effectively, given the divided state of US politics. Questions surrounding inflation, federal debt, and the broader economic outlook have only added to the uncertainty. Yet amazingly, the result may come down to some little known, so-called comedian's off joke. Closer to home, in political news, Prime Minister Anthony Albanese has been hitting some turbulence (apologies for the pun) following claims that he sought free upgrades from Qantas. The story, which began with whispers, has escalated to full-blown denials, with frontbenchers clarifying that Albanese did not make any requests by phone, email, or any other means of communication. The whole affair has probably been blown out of all proportion - of course airlines upgrade politicians, and Qantas made an art form of it to curry political favour. The issue is not the upgrades or perks that are handed out - it is what influence is sought or exerted in return. In this case, what input did Albo or Albo's office have on the government's decision to block Qatar Airways application for an additional 28 flights a week into major Australian airports? A decision that massively benefited Qantas' traffic, passenger loads, market dominance and profitability, at the expense of the Australian traveling public. Alan Joyce's greed and arrogance eventually cost both he and his chairman their jobs. Might it also claim his old mate Albo's come election time? News & Insights New Funds on FundMonitors.com Magellan Global Quarterly Update | Magellan Asset Management Market Update | Australian Secure Capital Fund September 2024 Performance News TAMIM Fund: Global High Conviction Unit Class Insync Global Quality Equity Fund |
|
|
If you'd like to receive Hedge Clippings direct to your inbox each Friday |

1 Nov 2024 - Performance Report: PURE Resources Fund
[Current Manager Report if available]
1 Nov 2024 - Performance Report: PURE Income & Growth Fund
[Current Manager Report if available]

1 Nov 2024 - Australian Secure Capital Fund - Market Update
|
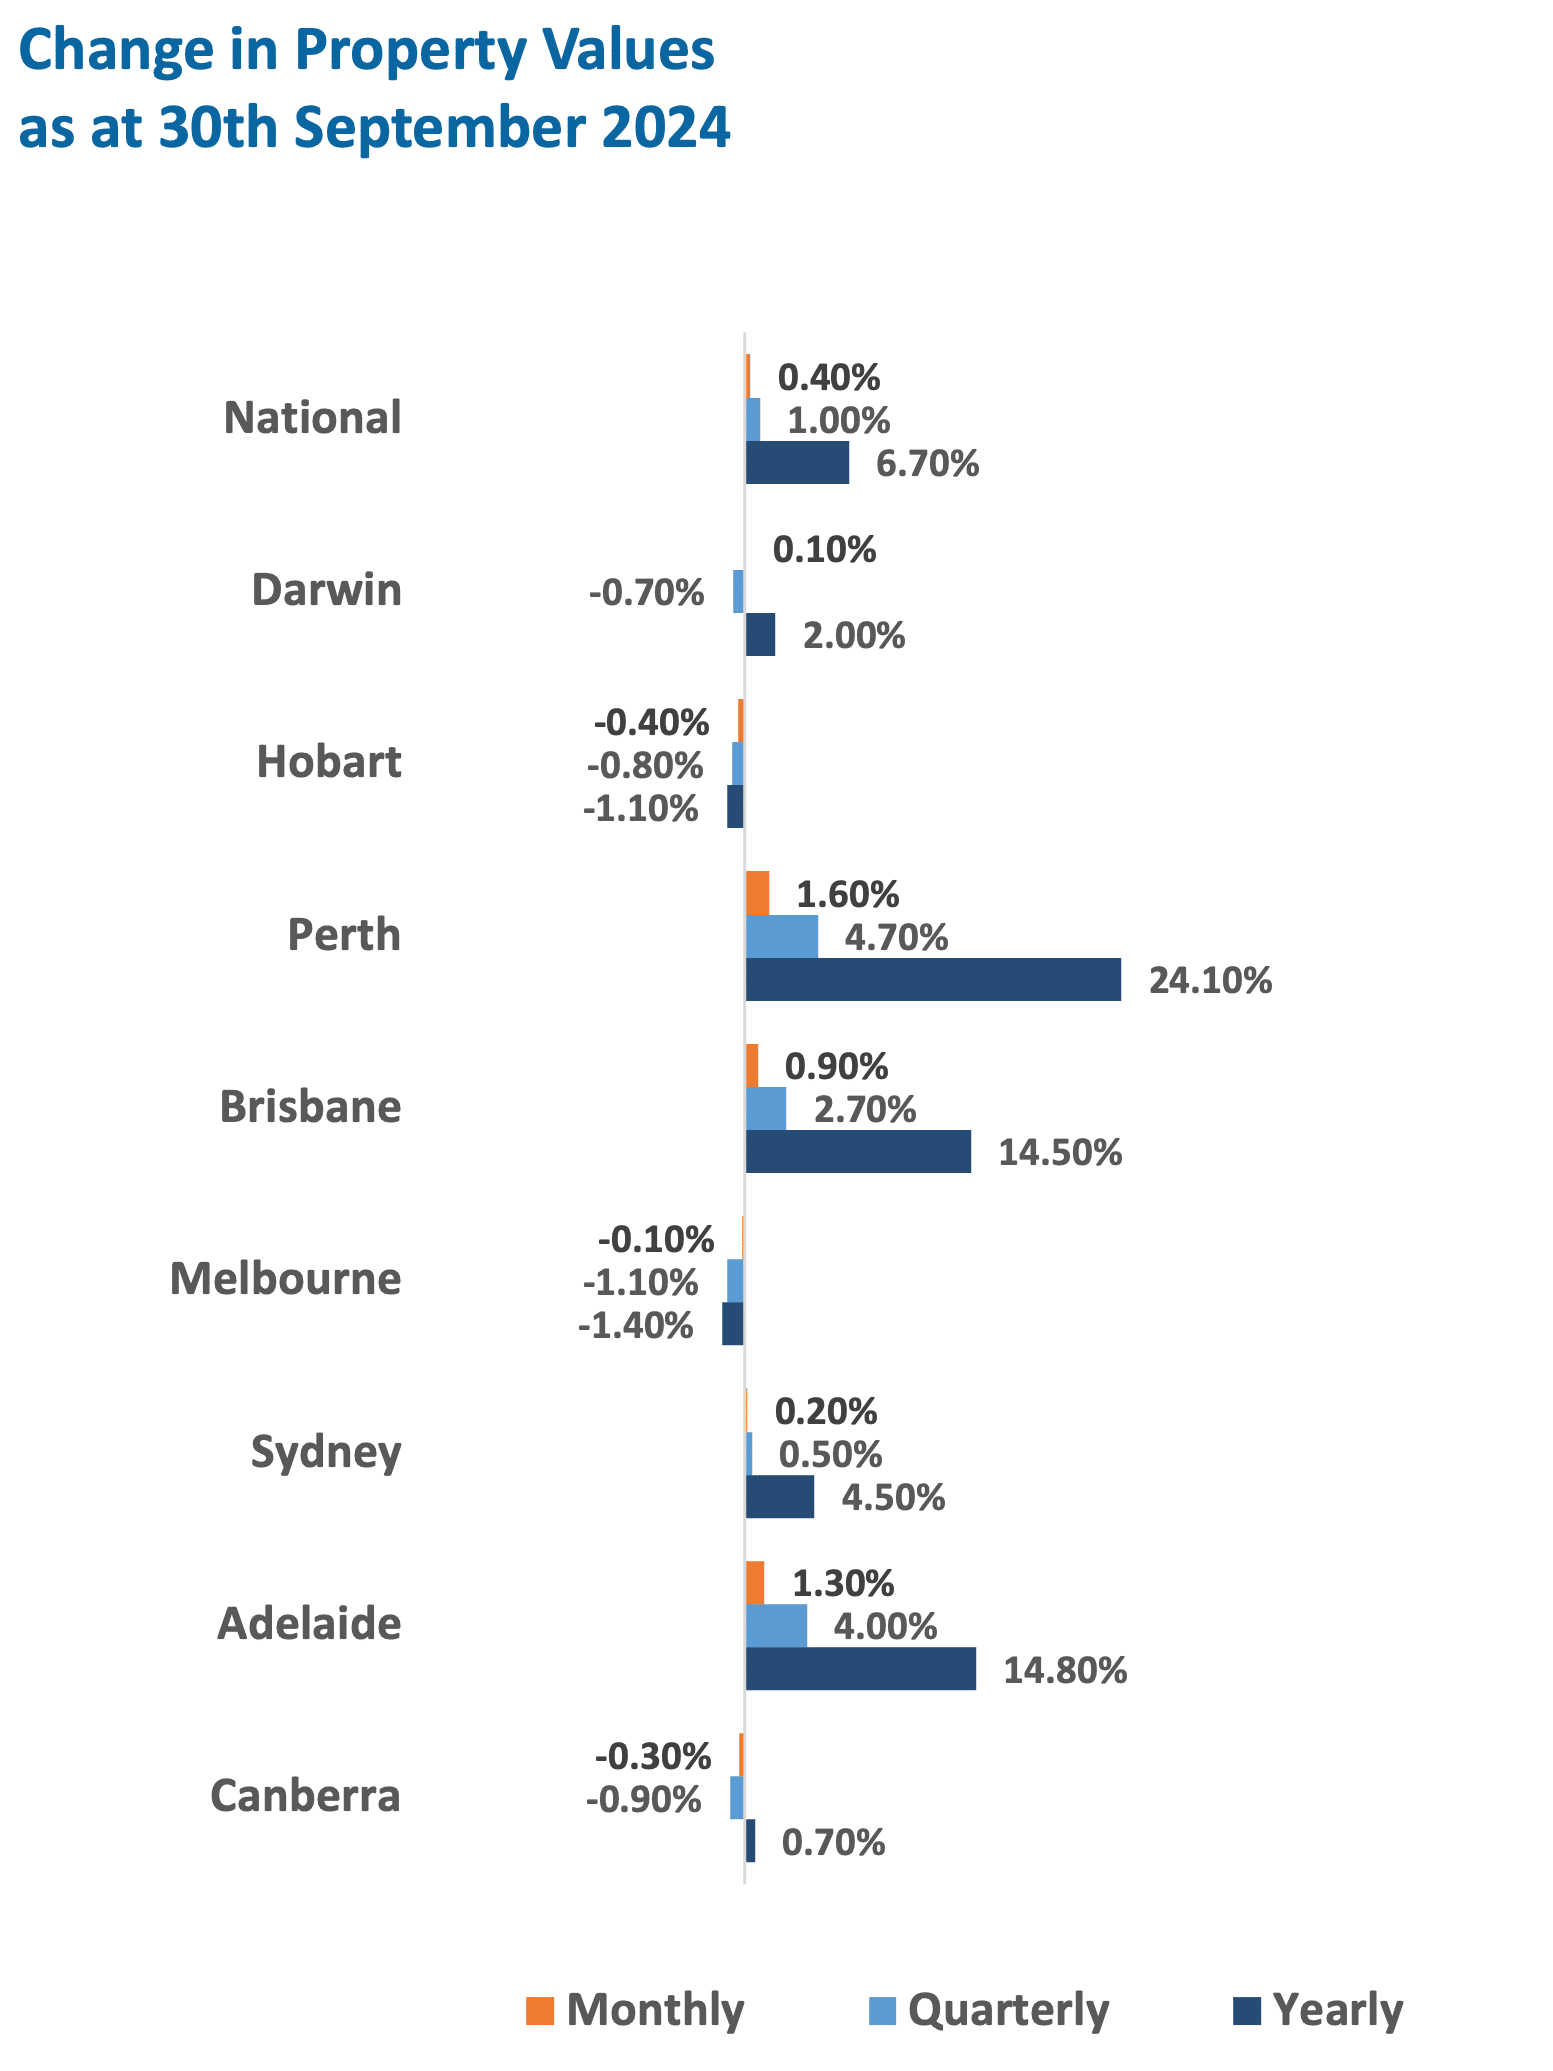
Australian Secure Capital Fund - Market Update Australian Secure Capital Fund October 2024 For the 20th consecutive month, headline national home values increased by a modest 0.4%, signalling that the strong momentum is beginning to leave the market. This is demonstrated by housing values rising just 1% for the September quarter, the lowest over a rolling three-month period since March 2023. Perth continues to be the strongest performer, growing by 1.6% for the month, followed by Adelaide and Brisbane with increases of 1.3% and 0.9%, respectively. Sydney and Darwin were the only other markets to see increases, rising by 0.2% and 0.1% for the month, while Melbourne, Canberra, and Hobart all saw housing values ease, with decreases of 0.1%, 0.3%, and 0.4%, respectively. Property Values as at 30th of September 2024
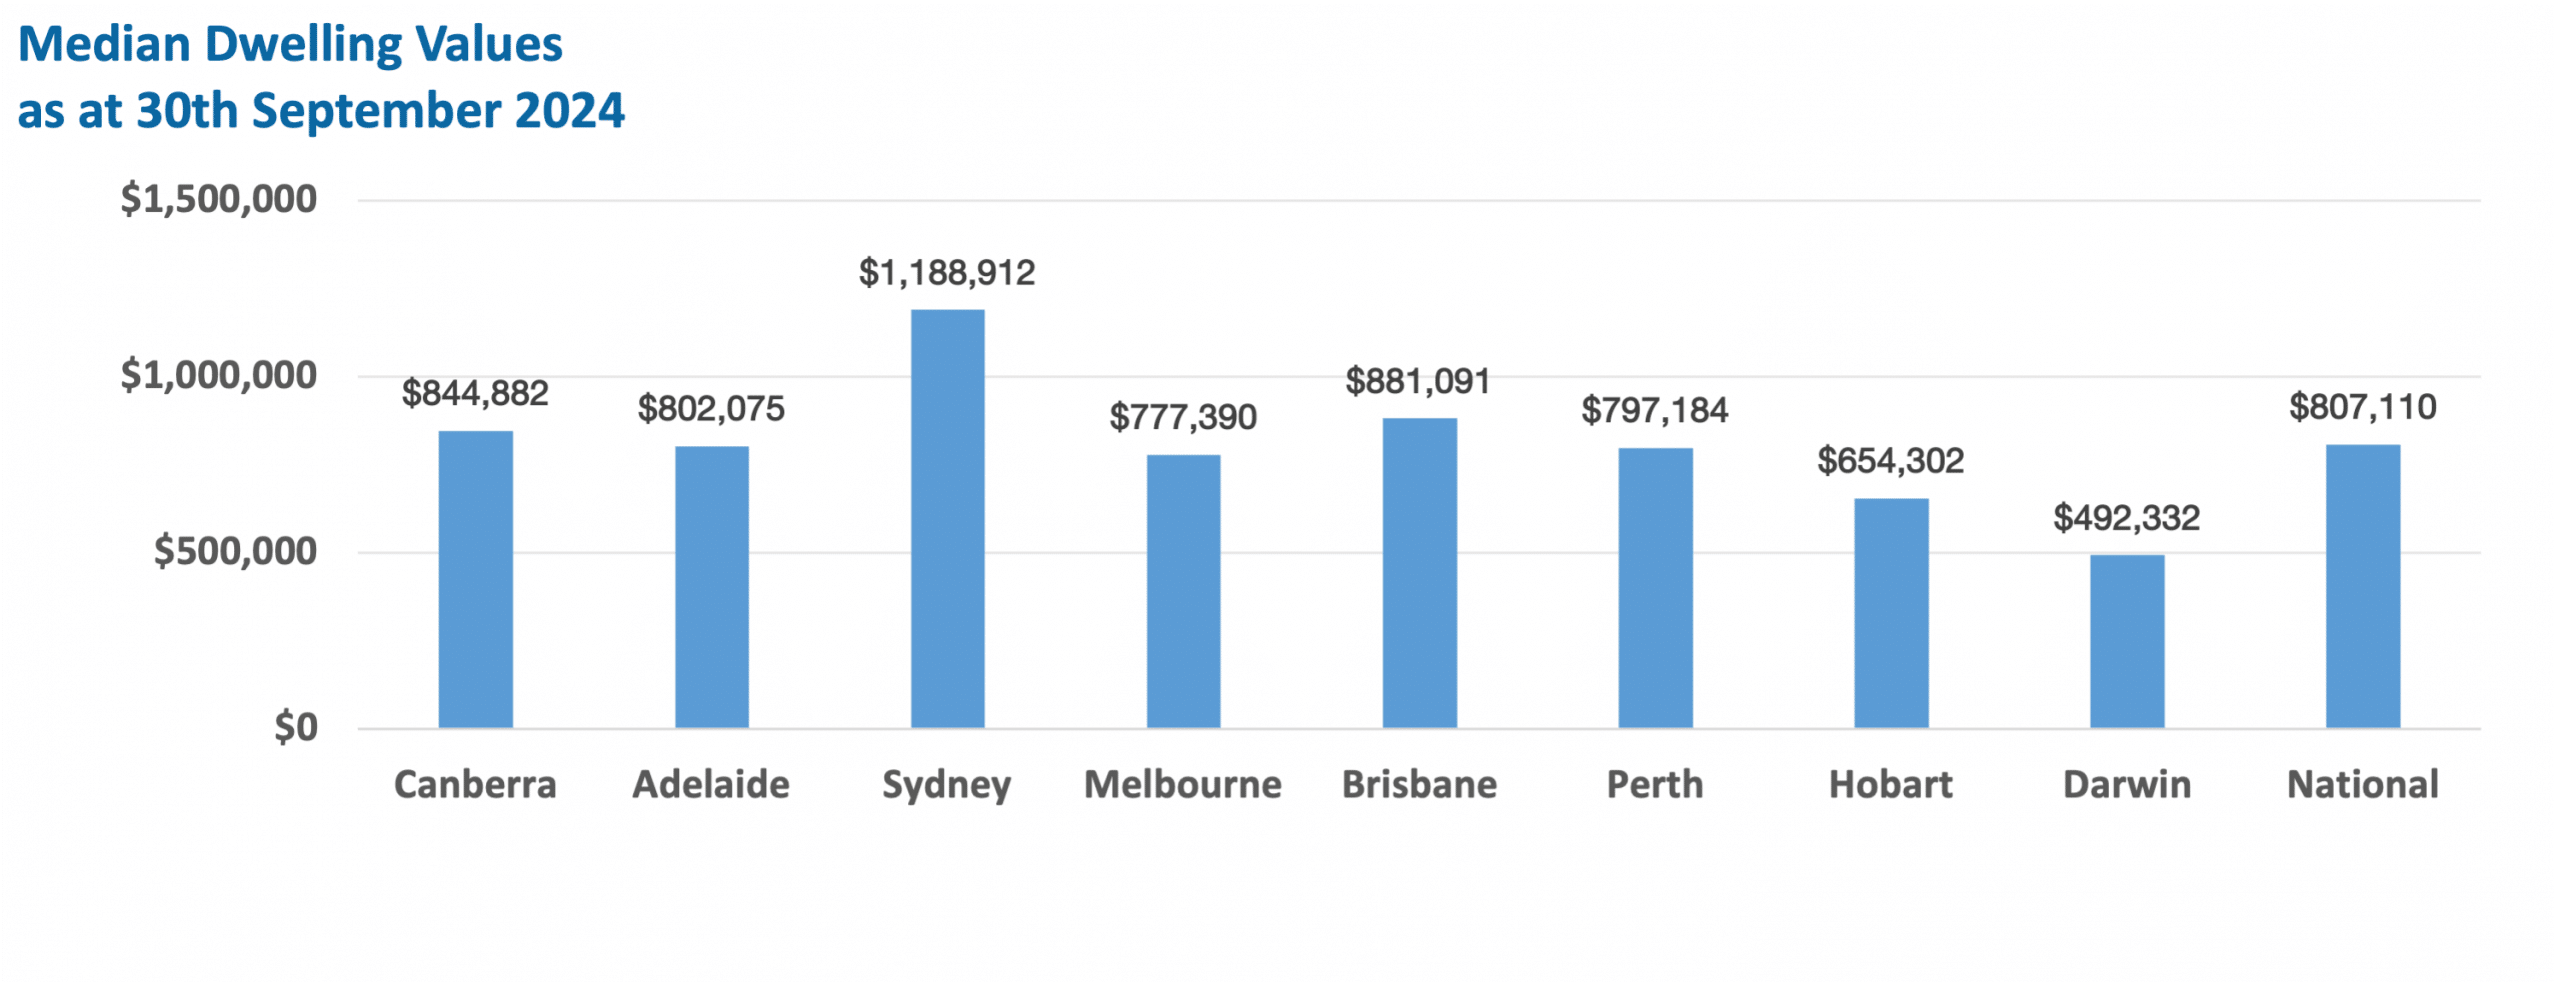
Median Dwelling Values as at 30th of September 2024
Quick InsightsRate hold slows buyers, but investor confidence remains strongProfits from home sales nationwide climbed to a record high of $285,000 on average in the June quarter. The RBA's decision to keep interest rates steady has left many homebuyers waiting, as borrowing power remains limited. While a future rate cut is anticipated, it won't significantly boost demand until it happens. Meanwhile, investors are showing renewed interest, particularly in Melbourne, where the market is stabilising despite an increase in listings. A rate cut could lead to a faster recovery than expected. Source: Australian Financial Review
Australia's housing market soars to record $11 trillionAustralia's housing market hit a record $11 trillion in September, with home values rising 6.7% over the past year, adding $900 billion in wealth. Despite higher interest rates, new listings and strong investor activity continue to drive the market. Over the past decade, house prices surged by 85.9% nationwide, with suburbs in Sydney, Brisbane, and Melbourne leading long-term growth. While price growth is expected to slow, strong demand and new housing developments will continue to support the market. Source: Australian Financial Review Author: Filippo Sciacca, Director - Investor Relations, Asset Management and Compliance Funds operated by this manager: ASCF High Yield Fund, ASCF Premium Capital Fund, ASCF Select Income Fund |