
NEWS

17 Mar 2025 - Performance Report: Glenmore Australian Equities Fund
[Current Manager Report if available]

17 Mar 2025 - Performance Report: Bennelong Emerging Companies Fund
[Current Manager Report if available]

17 Mar 2025 - Investment Perspectives: Share based payments are an expense!

For those of us who might have previously been unaware of noted US economist, Hyman Minsky (1919 -1996)...
14 Mar 2025 - Hedge Clippings | 14 March 2025
|
|
|
|
Hedge Clippings | 14 March 2025
News & Insights New Funds on FundMonitors.com Minksy, the X-Factor and what to watch | PinPoint Macro Analytics DeepSeek R-1: A Game-Changer? | Insync Fund Managers Investing in Technology | Magellan Asset Management February 2025 Performance News Bennelong Australian Equities Fund 4D Global Infrastructure Fund (Unhedged) Bennelong Concentrated Australian Equities Fund Bennelong Long Short Equity Fund |
|
|
If you'd like to receive Hedge Clippings direct to your inbox each Friday |

14 Mar 2025 - Performance Report: Argonaut Natural Resources Fund
[Current Manager Report if available]

14 Mar 2025 - The infrastructure investment boom
|
The infrastructure investment boom Redwheel March 2025 |
Surging infrastructure needs and private equity fundraising bodes well for listed infrastructure companiesFor years, investors have allocated to infrastructure to reap the benefits of an asset class with attractive return potential, higher yields than equity markets, defensive characteristics and inflation mitigation[1]. Today, investor interest in infrastructure is expected to grow as global electrification, digital innovations, increasing demand for energy and energy security, and the need for efficient transportation drive new development opportunities. Redwheel's Ecofin team believes in the fundamental rewards of a blended approach to investing in listed and private infrastructure. Both investments offer exposures to essential assets critical to the functioning of economies and yield steady cash flows. However, discerning investors will focus on the diversification and access to a range of sub-sectors, geographies, political systems, valuation differences, and liquidity that listed investments can also offer. Listed infrastructure is a complement and a diversifier to private infrastructure Listed infrastructure shares many of the same attractive traits as private infrastructure. Investments are underpinned by real assets with visible cash flows that should provide attractive and consistent returns with low correlations to traditional equities. Listed infrastructure also provides access to high quality assets and leadership teams globally. However, by contrast, listed infrastructure allows investors to gain full exposure immediately and offers the flexibility to adjust allocations based on risk and opportunities. Beyond this, we see four additional advantages that strengthen the case for increasing allocations to listed infrastructure: attractive relative valuation, enhanced risk diversification, a resurgence in M&A activity and greater scope for value capture. Advantage 1: Attractive valuation compared to private assets Valuations of listed infrastructure assets stand at a significant discount to their private equivalents and by historical measures, in our view. While private equity specialists have historically paid premiums to listed assets, justified to a large extent by the majority control of operations, we believe that the valuation gap has increased over the past couple of years. The table below reveals that recent take-out transactions in the space, whether for renewables assets, power & gas networks or transportation infrastructure, have averaged a c.40% premium to listed valuations. Most recently, Caisse de Depot et Placement du Quebec acquired Innergex for a 58% premium over the prevailing share price and an 80% premium to the 30-day volume weighted average price. 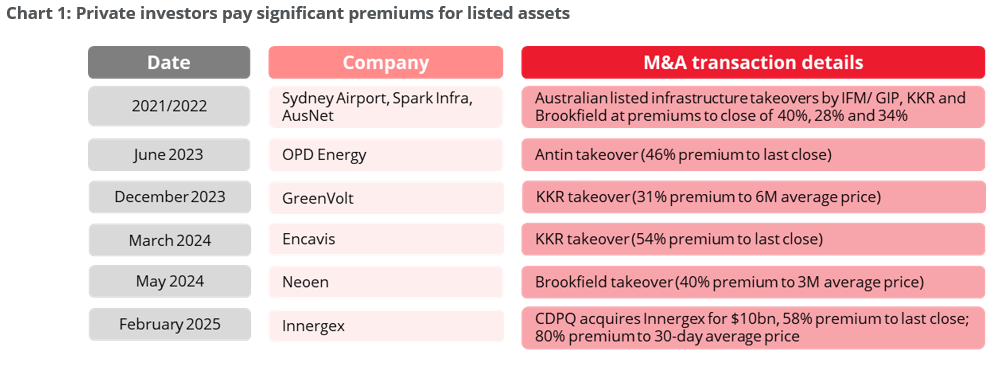
We read this situation as an illustration of the longer-term perspective of typical private equity players while listed equity investors tend to be more focused on the short-term outlook. This is a key differentiator for the analysis of infrastructure, which consists of long-duration assets and projects. The trend also reflects significant inflows into private equity infrastructure funds, generating competition to grasp scarce listed assets on relatively low valuations. A clear example of this valuation gap can be seen in recent transactions for European airport concessions. Since 2019, private M&A transactions have been concluded at valuations (EV / EBITDA) that were appreciably higher than listed assets, with individual premia on several transactions exceeding 100%. While listed airports trade at an average EV/EBITDA of 9.5x, we calculate that the average multiple paid in private transactions over the past six years has been 19.1x EV/EBITDA. 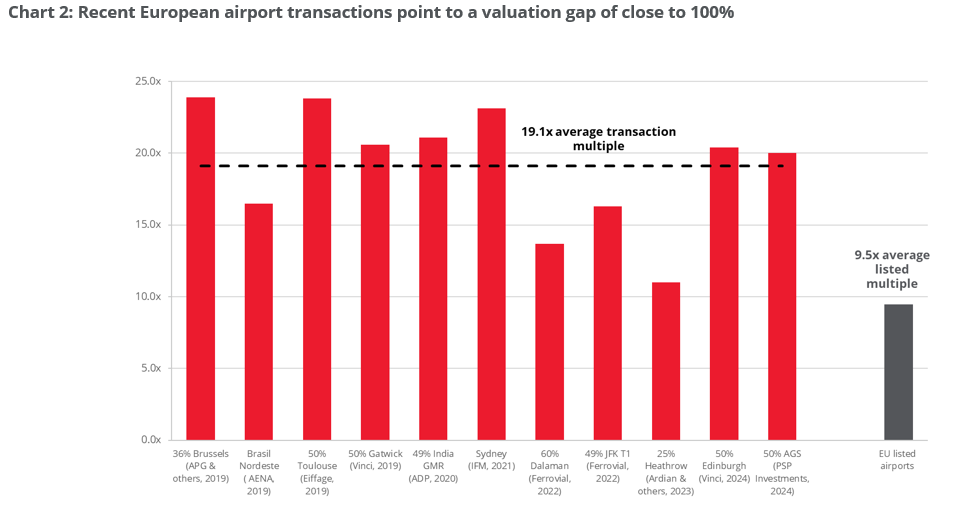
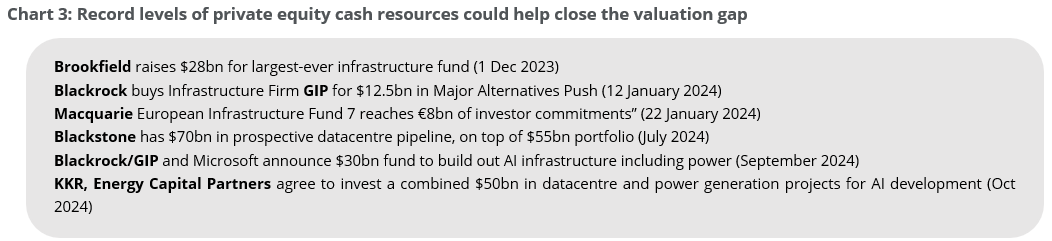
We expect this striking valuation gap to gradually reduce as private infrastructure investors put capital to work in coming years. Investors with private exposure can compound returns in the space by playing both sides of anticipated transactions as well as through rising valuations in listed assets. Over the past year, as shown in the table below, private equity majors have raised more than $100bn to invest in infrastructure. Infrastructure is seen as a portfolio diversifier away from more cyclical businesses, with growth trends underpinned by structural tailwinds in decarbonisation and electrification. The growing needs of AI-driven datacentres to secure their energy supplies fuels further growth prospects for the utilities part of the infrastructure universe. However, the opportunity is broader and more diverse than AI, encompassing the electrification of transportation through electric vehicles, the surge in cooling and heating needs globally, and reshoring initiatives for manufacturing in the US.
We also note that listed valuations are close to their historical lows relative to general equity indices. The charts below show that global Infrastructure companies have rarely traded at such low relative P/E multiples and Utilities, both US and European, are trading at low relative multiples as well. 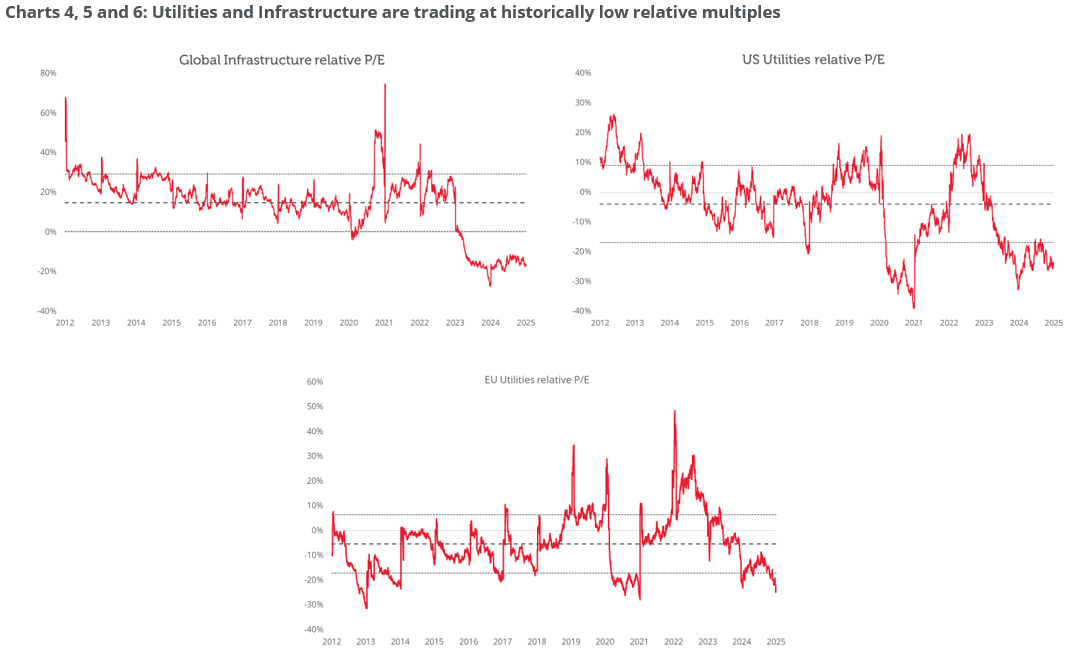
Finally, the chart below further supports our view that listed infrastructure, including Ecofin's dedicated strategy, is attractively valued relative to various market indices, yet offers a higher dividend yield. 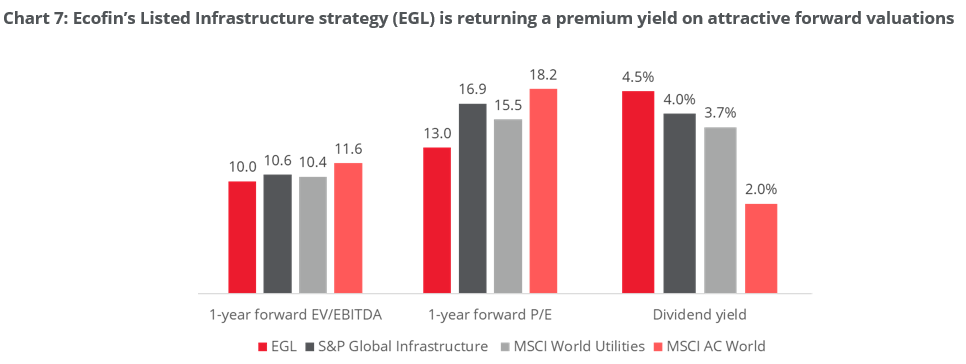
Advantage 2: Risk diversification and financial prudence Unlike private ownership, which is typically restricted to a single asset or a small number of similar assets in single regions or countries, listed infrastructure provides the option to invest in companies whose portfolios are diversified across geographies (thereby mitigating interest rate, currency, and regulatory risk) and technologies (e.g., combining wind and solar, intermittent renewables with baseload conventional power generation, toll roads and airports etc.). Beyond portfolio diversification, we would also note a marked difference in financial leverage between public and private companies. While investors often perceive listed infrastructure as riskier than privates due to stock price volatility, the intrinsically more prudent financial structures of listed infrastructure companies - and the resulting mitigation of risk for equity holders - are often disregarded. Listed companies generally need to comply with stricter metrics for their credit ratings, and self-imposed leverage targets often fall well below the rating thresholds to provide equity investors with additional comfort. Listed companies are continually incentivised to retain attractive credit ratings (and correspondingly low financing costs) given their need to periodically refinance debt as developers - as well as owners - of infrastructure assets. Listed infrastructure groups, whether in Europe or the US, have a typical credit rating of BBB+[2].
Advantage 3: The return of big M&A? Constellation's recent acquisition of Calpine[3] (private US gas and geothermal power provider) marks a potential turning point for M&A activity in listed infrastructure. After several years of subdued deal flow, low valuations in publicly traded infrastructure assets are drawing the attention of strategic buyers. High-quality, cash-generating assets have become materially undervalued following periods of rising interest rates and political uncertainty, creating compelling acquisition opportunities. With Constellation's move serving as a strong indicator (close to $100bn combined market capitalisation post-transaction, making it one of the largest transactions in the sector in a decade), attractive pricing could drive a resurgence of big M&A deals in listed infrastructure. We think this should be a clear tailwind for listed infrastructure in 2025 and beyond. The need to reshuffle asset portfolios to adapt to the energy transition, requirements by hyperscalers to get suppliers capable of delivering large amounts of power 24/7, together with significant cash inflows into private equity infrastructure funds, bode well for future consolidation activity in the global infrastructure universe.
Advantage 4: Greater scope for alpha generation A fundamental reason why listed infrastructure could compound higher returns over time is its ability to provide exposure to the full infrastructure value chain. Listed companies typically own operating infrastructure assets and, in most cases, they develop new ones. Having exposure to greenfield projects offers listed infrastructure companies the opportunity to deliver superior returns through operational expertise and efficiencies in the development and construction phases of a project. Construction tends to be a determinant stage during which considerable value is either created or lost. Conversely, private infrastructure portfolios tend to focus on the ownership of operating (brownfield) assets, and there is potentially a more limited scope for return enhancement in the operation and maintenance of these assets.
Listed infrastructure stands out as a competitive structural growth play There is a multi-decade upswing in economic infrastructure development driven by the needs of the modern economy and decarbonisation priorities. Investors, we contest, should increasingly participate via listed securities which screen favourably on valuation and provide important attributes such as liquidity, portfolio diversification and a broad opportunity set. These features should set the scene for listed infrastructure securities to close the valuation gap with private infrastructure assets. Finally, investors will not be able to fully access this opportunity through a broad equity allocation. Listed Infrastructure (and private infrastructure) requires a dedicated allocation. Ecofin's Listed Infrastructure strategy delivers a meaningful yield pick-up over the MSCI AC World index on lower multiples - see Chart 7 - yet the portfolio represents only 1.6% of the index's market capitalisation and there is no overlap with its top 80 constituents[4]. To access the secular growth and value opportunities in listed infrastructure, investors are encouraged to seek specialised allocations. |
|
Funds operated by this manager: Redwheel China Equity Fund, Redwheel Global Emerging Markets Fund |
|
Key Information Sources: [1] Redwheel and Morningstar, February 2025 [2] Bloomberg, December 2024 [3] Reuters, January 2025 [4] Source: Bloomberg and Redwheel. EGL data as of February 2025; MSCI data as of January 2025 |

13 Mar 2025 - Performance Report: Bennelong Long Short Equity Fund
[Current Manager Report if available]

13 Mar 2025 - The state of the energy transition: Where are we now?
|
The state of the energy transition: Where are we now? Janus Henderson Investors February 2025 While the politics of climate are changing, the prevailing trends continue to reveal significant investment opportunities in the energy transition, as outlined by Tal Lomnitzer.
The victory of Donald Trump in the US presidential election, coupled with a lacklustre COP29 climate conference in Baku, has prompted concerns about the state of the energy transition, with some fearing progress may slow or even reverse. Such concerns are underscored by the 2024 average global temperature reaching 1.8°C above pre-industrial levels in 2024 - marking it as the first year to surpass the 1.5°C target limit. Despite rising global temperatures and the Trump administration withdrawing the US from the Paris Agreement for the second time, we still see opportunity for investors to profit from the prevailing trends underlying the energy transition. Rising corporate commitment to net zeroExhibit 1 offers a snapshot of how net zero commitments have grown over the past five years. What stands out is the notable surge in Forbes Global 2000 corporations committing to net zero over the past few years. This is significant, since these 2000 companies are responsible for approximately 20% of global embodied emissions, considering both their operations (scope 1 and 2) and supply chains (scope 3) emissions. Exhibit 1: Commitments to net zero have grown since 2020
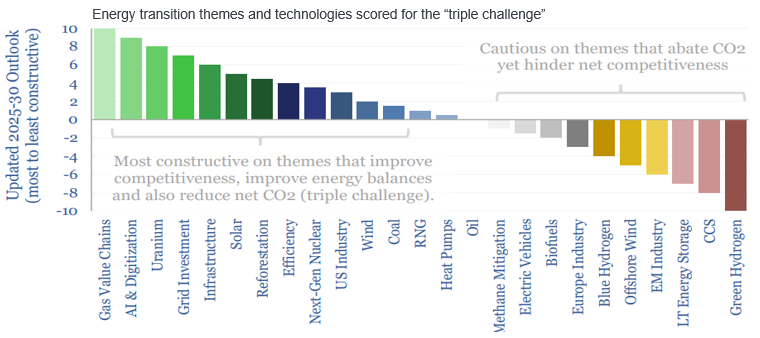
Source: Net Zero Tracker, as at September 2024. While the nature of these companies' net zero commitments varies widely, with some aiming for carbon neutrality, some for zero emissions, and others focusing on Scope 1 (direct) and 2 (indirect) emissions but not Scope 3 (value chain), the overall trend is one of growth, both in the number of commitments and the entities making them. Further, there has been a significant rise in targets enshrined in national policy in the past few years, with 88% of global emissions, 89% of the global population and 90% of global GDP covered by some form of national commitment or net zero target. The 'glass half full' perspective is a significantly higher level of ambition, but with the average global temperature in 2024 already 1.8°C above pre-industrial levels, the need for countries to address greenhouse gas (GHG) emissions faster and deeper is mounting. As it stands the race against time to net zero is arguably being lost if we want to keep below 2°C, and many entities still lack emissions reduction targets. The triple challengeWhen we examine the state of the energy transition from both a pragmatic and investment perspective, the three axes of the 'triple challenge' need to be considered. This encompasses the challenge of enhancing competitiveness by providing cheap energy, improving the energy balance by providing more energy, and simultaneously addressing the GHG emissions present in our atmosphere. A useful analysis from Thunder Said Energy (Exhibit 2) of various energy technologies and themes within the context of decarbonisation, ranks them by how much they address the triple challenge, with those on the left side improving competitiveness and those on the right side reducing competitiveness based on current economics. Exhibit 2: Triple challenge framework
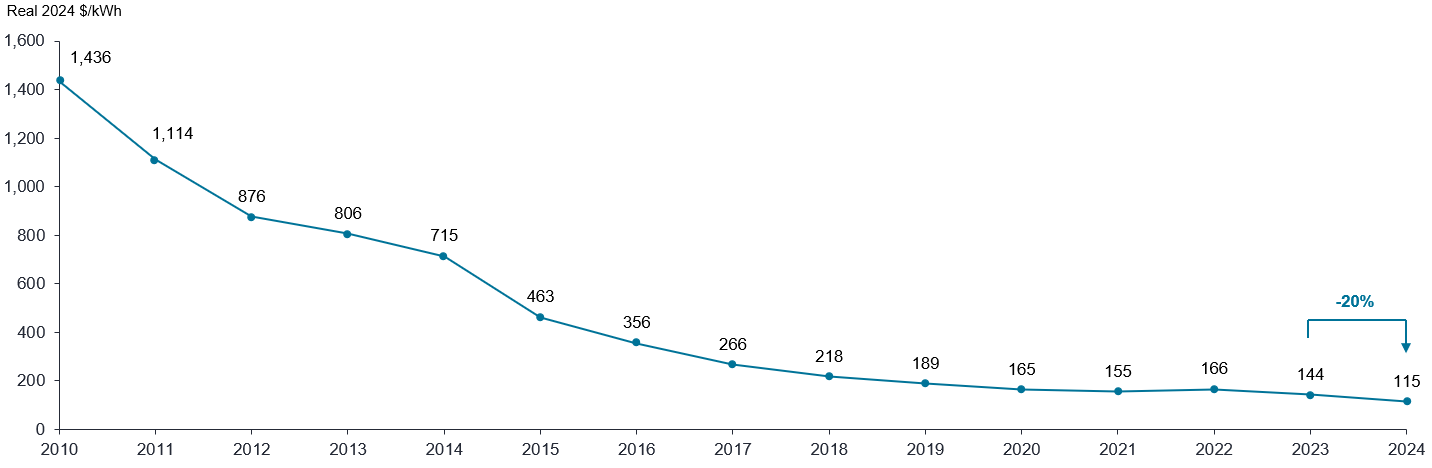
Source: Thunder Said Energy. The public statements from the Trump administration regarding renewable energy in our eyes seem less about being against decarbonisation per se and more about being pro-competitiveness. In this context, competitiveness equates to affordable energy, whereas anti-competitiveness is synonymous with expensive energy. Therefore, our investment focus favours companies that offer inexpensive energy solutions and contribute to lowering carbon emissions, such as the value chain of gas, including LNG, gas storage, and transport, along with AI, digitisation, and nuclear energy. Nuclear energy, in particular, is seen as a significant advantage for those seeking base load power with a minimal carbon footprint and self-sufficiency, especially considering that the US and Canada have abundant uranium resources or the potential for it, thus reducing dependence on potentially unfriendly suppliers such as Russia. Our investments are also directed towards grid investment, solar, energy efficiency, reforestation and other areas where we see strong returns and growth prospects that address the challenges of the energy transition. Conversely, we are currently avoiding sectors that, while potentially reducing carbon emissions, could impede competitiveness. These include green hydrogen, carbon capture storage, offshore wind, and blue hydrogen. These areas represent the more costly segments of the energy market, which we are deliberately choosing not to focus on, pivoting instead towards investments that align with improving competitiveness whilst also delivering more sustainable energy solutions. The economic case for solar energyWe were surprised to discover that during the first Trump presidency, the US experienced its fastest pace of solar installation, with Texas, an oil and gas stronghold, surpassing California in solar installations. This surge is attributed to the declining costs of solar photovoltaic (PV) systems with storage, making solar energy increasingly competitive against natural gas in the US, and even cheaper than coal-fired power in India and China on a levelised cost of energy (LCOE) basis. The reason for this cost reduction is twofold: the virtually inexhaustible nature of solar energy and the semiconductor technology it employs, which has historically seen efficiency gains and cost reductions over time. Currently, solar panels have achieved 25% efficiency in converting sunlight to electricity, a significant improvement from 5% two decades ago, with the potential to reach 50% efficiency. This improvement, alongside increased production volume, has driven down costs to approximately four to five cents per kilowatt-hour, with projections suggesting a future decrease to between one and two cents. As a result, solar energy has become the lowest-cost form of generating electrons globally. In Europe, solar production capacity is expected to triple between 2020 and 2024, outpacing both onshore and offshore wind, due to superior economics. Similarly, cost reductions are observed globally, driven by technological advancements and increased efficiency, not solely by low-cost Chinese production. The imposition of tariffs on imported solar panels could significantly benefit US solar companies that produce panels domestically by increasing their profitability due to higher margins. We anticipate further production expansion in the US as a result of these tariffs and view any additional tariffs as a highly positive development for domestic solar panel producers. Similarly domestic producers of key materials such as steel stand to benefit in a world of higher tariffs. Energy storage costs continue to fallAs utility scale solar installations increase the intermittent nature of the electricity causes power price volatility which necessitates effective energy storage solutions. The economic case for energy storage which enables energy price arbitrage becomes increasingly compelling as price volatility rises, while the costs associated with developing and deploying these technologies have significantly declined. For instance, the price of lithium-ion battery packs has plummeted from US$1,436 per kWh in 2010 to US$144 in 2023, marking a 90% decrease over approximately 13 years (Exhibit 3). Exhibit 3: Lithium-ion battery pack prices
Source: Bloomberg New Energy Finance (BNEF), as at 10 December 2024. Past performance does not predict future returns. Despite a seeming plateau in battery prices on the chart, prices continued to fall by 20% last year, with expectations for ongoing reductions. This cost reduction has catalysed a surge in battery storage installations. In 2023 alone, 60 gigawatts of energy storage were installed, enough to power 60 million homes representing a 120% increase year-on-year. Projections for 2024 estimate over 100 gigawatts of installations, with future expectations reaching up to 1 terawatt annually by 2030 and three terawatt-hours annually by 2050. By then, solar power with associated storage could contribute 43,000 terawatt-hours to the grid, driven primarily by economic feasibility rather than regulatory enforcement. Notably, in 2023, China led the world in energy storage installations, accounting for almost 50% of global capacity, with the US and the rest of the world trailing significantly. This highlights China's leadership in energy storage and underscores the need for other countries to accelerate their efforts in this domain. However, even this fast pace of energy storage deployment is arguably insufficient. To maintain alignment with the 1.5°C target, approximately 1,300 gigawatts of battery storage will be needed by 2030 according to the IEA, a goal that current estimates suggest we are unlikely to meet. Present trajectories indicate a potential global temperature increase of 2-3°C. Trump does not necessarily put a spanner in the worksWe believe that it is highly unlikely that businesses will abandon their decarbonisation efforts, as these initiatives extend beyond any single presidential term. The trend of directly sourcing clean energy is established and enduring, propelled by the economic benefits of large-scale wind and solar projects and the rising costs of grid-supplied electricity, with an added push from investments into Artificial Intelligence. Despite news of the US once again exiting the Paris Agreement and reducing subsidies, the momentum towards electrification, digitalisation, and decarbonisation is likely to continue in areas that support growth and competitiveness. As Exhibit 4 shows, clean energy capacity has grown and annual carbon emissions have fallen under both Democrat and Republican administrations in the US. Exhibit 4: US clean energy capacity vs. annual CO2 emissions
Source: ARNnet; IEA; World Economic Forum; Dean H. Barrett and Aderemi Haruna, Molecular Sciences Institute, School of Chemistry, University of the Witwatersrand; US Department of Energy; Jefferies Research, as at 30 November 2024. An increasing role for nuclear powerWe firmly believe in nuclear energy as a technology capable of providing low carbon base load power. Our current exposure to nuclear energy via uranium producers exceeds that of solar, although we plan to increase our investments in solar. However, timing is crucial, especially considering the potential negative headlines associated with solar under certain political climates. Interestingly, major corporations like Microsoft have engaged in substantial agreements with nuclear energy providers, such as the deal with Constellation Energy to restart Three Mile Island, at prices significantly higher than those of solar energy. This indicates a willingness among the world's wealthiest corporations to invest in reliable low carbon energy sources. Bottlenecks for growthFrom an investment perspective, we focus on identifying bottlenecks in energy supply chains, as these areas tend to offer excess economic returns, leading to high returns on investment and positive share price performance. One such bottleneck is the increased demand for critical metals required by nuclear and solar technologies, as well as electric vehicles, compared to traditional energy sources like coal and natural gas. This demand encompasses a variety of metals essential for the transition to green energy, including rare earth metals, zinc, graphite, nickel, lithium, and copper (Exhibit 5). Exhibit 5: Critical Minerals used in selected clean energy technologies
Source: IEA Critical Miners Report, as at December 2023. The Role of Critical Minerals in Clean Energy Transitions, IEA, Paris https://www.iea.org/reports/the-role-of-critical-minerals-in-clean-energy-transitions, License: CC BY 4.0 Further, several factors contribute to the rising demand for these metals, including the shift towards de-globalisation (onshoring) and localisation of supply chains, changes in consumer behavior, increased military spending, and the expansion of data center capacity, which alone requires significant amounts of copper. However, the mining industry is likely to face challenges in meeting this demand, unless real investment increases significantly. This suggests a need for higher commodity prices to incentivise increased production. Historical data on commodity price cycles indicate potential for significant growth in the coming decades, offering an attractive investment opportunity in the resources sector. This sector not only provides diversification and inflation protection but also trades at a valuation below the historic average compared to the broader market. Navigating the complexities of the energy transitionOur responsible resources strategy focuses on the critical enablers of the energy transition, but we also have a climate transition strategy that takes a diversified approach to capitalising on these growth dynamics, focusing on green solutions, enablers of these solutions, and improvers who apply these solutions to enhance their operations. By investing in this manner, we aim to generate returns for our investors alongside a positive impact for the planet. The journey toward net zero presents a dynamic and evolving landscape filled with opportunities for investors to contribute to a sustainable future while seeking profitable returns. By understanding the complexities of the energy transition and strategically navigating its risks and opportunities, we believe that investors can position themselves to benefit from the shift toward a cleaner, more sustainable global economy and generate good returns. |
|
Funds operated by this manager: Janus Henderson Australian Fixed Interest Fund, Janus Henderson Australian Fixed Interest Fund - Institutional, Janus Henderson Cash Fund - Institutional, Janus Henderson Conservative Fixed Interest Fund, Janus Henderson Conservative Fixed Interest Fund - Institutional, Janus Henderson Diversified Credit Fund, Janus Henderson Global Equity Income Fund, Janus Henderson Global Multi-Strategy Fund, Janus Henderson Global Natural Resources Fund, Janus Henderson Tactical Income Fund All opinions and estimates in this information are subject to change without notice and are the views of the author at the time of publication. Janus Henderson is not under any obligation to update this information to the extent that it is or becomes out of date or incorrect. The information herein shall not in any way constitute advice or an invitation to invest. It is solely for information purposes and subject to change without notice. This information does not purport to be a comprehensive statement or description of any markets or securities referred to within. Any references to individual securities do not constitute a securities recommendation. Past performance is not indicative of future performance. The value of an investment and the income from it can fall as well as rise and you may not get back the amount originally invested. Whilst Janus Henderson believe that the information is correct at the date of publication, no warranty or representation is given to this effect and no responsibility can be accepted by Janus Henderson to any end users for any action taken on the basis of this information. |


12 Mar 2025 - Performance Report: Airlie Australian Share Fund
[Current Manager Report if available]
12 Mar 2025 - Performance Report: Bennelong Concentrated Australian Equities Fund
[Current Manager Report if available]