NEWS

7 Mar 2025 - Hedge Clippings | 07 March 2025
|
|
|
|
Hedge Clippings | 07 March 2025 Firstly, a correction: Last week's Hedge Clippings, where we likened Donald Trump and Elon Musk to Lewis Carroll's twins, Tweedle Dum and Tweedle Dee, was half on the mark, and half off it. Seemingly no sooner had we made the connection, than what had been a planned photo/PR opportunity in the Oval Office with Ukraine's Volodymyr Zelenskyy degenerated into a now infamous example of global diplomacy, Donald style. Very Tweedle Dum, although not that dumb, as it now appears that Zelenskyy is now going back for more - or at least more munitions - even without security guarantees - which given they would be up to Putin to honor, might not be worth much anyway. As Tweedle Donald said, "You don't have the cards". Where we were off the mark was putting Musk in the Tweedle Dee role. JD Vance stole that part - and spectacularly. For those not looking forward to the remainder of Trump's Term 2 as POTUS, watch out when, or if, Vance takes over, either in four years' time, or possibly before that if Trump doesn't make it. Turning to the local news, this week saw a glimmer of hope for Albo's re-election chances in the form of an uptick in Australia's GDP figures, rising 0.6% in the December quarter, its highest level since December 2022, and 1.3% over the year. Slightly less encouraging were the GDP per capita figures, which only rose 0.1%, an improvement at least, but still in negative territory at -0.7% for the year. Finally, an interesting speech by the RBA's Andrew Hauser who as we've mentioned before manages to upend the traditional view of a central banker by being both smart (generally a pre-requisite for the job) and entertaining at the same time. Hauser explained and expounded the VACU view of the world - Volatile, Uncertain, Complex, and Ambiguous. Hauser was talking about a general approach, but he might also have been describing the first six weeks of Tweedle Donald's second term. In fact, he was explaining the difficulty the RBA has in getting its monetary policy settings right, which in the past had focused on treading the "narrow path" as Philip Lowe used to put it. He rightly explained that the RBA, having put rates up more slowly, and less than the rest of the world, it was only correct that they had started the easing cycle behind the others as well. In his and his colleagues' eyes they have achieved what has been asked of them - trimmed mean inflation averaged over the past six months back in their preferred 2-3% range, and with employee participation in the workforce at 64.5% - a record level. Congratulations? Maybe, but then of course his words of caution: "Central bankers are paid to worry, not celebrate" particularly given the VACU world in which we live. Number one worry is global trade policy - Volatile, Uncertain, Complex and Ambiguous - courtesy of Tweedle Donald, although Hauser was too polite to put it that way, as he cautioned that maybe markets weren't fully factoring the uncertain risks ahead. Number two risk on Hauser's agenda was the level of spare capacity in Australia's strong labour market, and the potential for inflation to head upwards again if the current low (record) unemployment level falls further as economic activity picks up. This is where the RBA's crystal ball falls into the Uncertain, Complex and Ambiguous categories - and possibly all three at the same time. So welcome to the new normal of VACU - into which we'll add another U - the uncertainty of the soon to be announced election. News & Insights Manager Insights | East Coast Capital Management 2024 Responsible Investment and Stewardship Report | 4D Infrastructure 10k Words | February 2025 | Equitable Investors January 2025 Performance News Equitable Investors Dragonfly Fund
February 2025 Performance News |
|
|
If you'd like to receive Hedge Clippings direct to your inbox each Friday |

7 Mar 2025 - Manager Insights | East Coast Capital Management
|
Chris Gosselin, CEO of FundMonitors.com, speaks with Richard Brennan, Strategy Ambassador at East Coast Capital Management. East Coast Capital Management's trend-following futures strategy has delivered strong risk-adjusted returns by dynamically adapting to market trends across currencies, commodities, and futures. In this discussion, they explore recent market volatility, key investment trends, and the role of trend-following in portfolio diversification. The ECCM Systematic Trend Fund has a track record of 5 years and 1 month and has outperformed the SG Trend benchmark since inception in January 2020, providing investors with an annualised return of 16.49% compared with the benchmark's return of 7.64% over the same period.
|

6 Mar 2025 - 5 Essential Rules for Market Corrections
|
5 Essential Rules for Market Corrections Marcus Today February 2025 |
Sharp Corrections and Market RecoveriesSome of the best moments in the market are the runaway rallies before a correction. If you don't participate in those exuberant periods, you'll never capture the market's full returns. In other words, don't let fear hold you back. Play the game when it is "on". Laugh all the way to the top. Let the finger-waggers wag, they always do when people make a fortune with little effort. Corrections are inevitable and regular. Expect a big one every ten years (50%), and a tradeable one every three years (10-20%). And regular 5% corrections. When to Hold, When to SellYou have to be decisive. The stock market is not about certainty ahead of time. You never get that. Work on the balance of probability. If the market has gone up a lot and suddenly drops, the balance of probability suggests that that's a top. So sell. Yes, it may be wrong, but if the market is up a lot, there are more profits to be taken, and your only risk is not making money and not being a fund manager; underperformance is irrelevant. Play the odds. Sell when it could/should/might be a top. On the other hand, recoveries take much longer. In every major sell-off, it takes far longer to recover than it does to crash. After the pandemic, the market took 14 months to recover from a 23-day drop. That means you have plenty of time to buy into the recovery - there's no rush to catch the exact bottom. The market never crashes "up". So never bother catching the knife. I roll my eyes at people buying anything that's dropped a lot whilst it is dropping. Sell quickly, but buy at your leisure. The Myth of Defensive Stocks in a Sell-OffDon't bother buying into defensive stocks when a correction starts. Defensive stocks (TLS, WOW, COL, CSL, COH, ORG) will likely underperform in a bull market and, while they hold up better in a downturn, they still fall. You just lose money more slowly. So don't buy them. Don't read the articles saying "Switch into defensive stocks". Any talk about defensive stocks is aimed at fund managers, not you. You do not need to outperform. Cash is your only defence in a falling market. Not defensive stocks. Defensive stocks will not serve you unless you are an income-focused investor in a bull market. Leave defensive stocks to the fund managers who concern themselves with their own relative, not actual, performance. For an individual investor, there is almost no point at which you would want to buy a "defensive" stock. They make less money in a rising market and there is no point holding the stock that loses you less money in a correction. Why Holding Cash Is More Powerful Than You ThinkNo one in the finance industry will tell you to sell. Fund managers, financial planners, and brokers - they want you in their fund, in their product, in their system, not trading, speculating, or being active. If you want to move to cash, expect resistance. If you want to sell, you will need to be assertive. When my Mother-in-Law rang her financial adviser in January 2008 to say "Sell'" (the seven dull managed funds he had her in), he gave her every line in the book about it being time in the market. The market then fell 44%. Get it? If you want to sell, be assertive. And remember, there's nothing wrong with holding cash. Cash is always king. There is nothing wrong with cash, ever. Even if you get the timing terribly wrong, all you miss is "not making money". You can wear that. Plus cash gives you time to think. Being in cash is riskless. You have all the power. You can buy back tomorrow. Do not be fearful of going to cash. It's no biggie. It's actually very cathartic, especially when things get wild. You are going from worrying about the market falling, your wealth disappearing, and your standard of living changing for the worse to waking up hoping there's a crash! Selling is a powerful thing. It's a pressure release for the investment brain. You should try it sometimes. Author: Marcus Padley |
|
Funds operated by this manager: |

5 Mar 2025 - Performance Report: Equitable Investors Dragonfly Fund
[Current Manager Report if available]

5 Mar 2025 - Why everyone should care about the California wildfires
|
Why everyone should care about the California wildfires Challenger Investment Management February 2025 The California wildfires of January 2025 were an extraordinary event. 29 people died, more than 200,000 people were forced to evacuate and over 18,000 homes were destroyed. Economists at UCLA estimated total property and capital losses could range between US$95 billion and US$164 billion with insured losses at up to US$75 billion making it the second most costly event after Hurricane Katrina (over US$100 billion in losses, over US$40 billion insured loss). They estimated a $4.6 billion hit to GDP with total wage losses of US$297 million for affected businesses. But despite the size of the losses the insurance industry has sailed through the event relatively unscathed with minimal price reason at the major P&C insurers who had limited coverage in California after previous wildfires and accessed reinsurance covered to cap potential losses. Indeed the insured losses do not provide the full picture when considering the economic impact of the California wildfires. AccuWeather has estimated that the total damage plus broader economic slowdown total between US$250 billion and US$275 billion making the wildfires the most costly natural disaster in US history, exceeding the US$200 billion total from Hurricane Katrina. But even these figures may understate the impact of the California wildfires and the reason relates to insurance coverage and ultimately house prices. The increased frequency and severity of extreme weather events is making insurance, a must have to obtain a mortgage, either extremely expensive or in some cases unavailable. Where insurance is unavailable, the government has had to step in as the insurer of last resort. As the wildfires were still ravaging parts of California the US Department of the Treasury's Federal Insurance Office (FIO) released a report which highlighted how homeowners insurance has increased 8.7% faster than the rate of inflation from 2018-2022. Some areas experienced doubling of insurance premiums over the period. This in turn led to much higher policy non-renewal rates meaning more properties were effectively uninsured. Prior to the wildfires property insurance in California was not expensive relative to other states but looks likely to increase sharply. In other parts of the United States homeowners are paying over 1.5% of their property value per annum in insurance premiums versus less than 0.5% in California. California's total housing stock is worth US$10 trillion, equivalent to one fifth of total housing stock in the United States. In 2024 S&P estimated that if insurance premiums increased by 20% annually versus 10% annually the implied impact on houses prices at a 4% discount rate would be around 10%.[1] Consider that in California State Farm, the state's largest insurance has requested a 22% average increase to insurance premiums having filed for a 30% rate increase in mid 2024.
At a more micro level residents in Laytonville, California saw insurance premiums increase by 106% over the 2018-22 period with an average premium of $3,257 in 2022 (which we estimate would be closer to US$6,000 today). In 2024, Zillow quotes the average house price in Laytonville at $344,853, having declined by over 10% over the past 12 months (compared to a national average of around 5% year on year growth). This means a resident in Laytonville California will be paying north close to 2% of the property value in home insurance up from less than 0.5% in 2018. From the perspective of an investor this is like saying that the net yield on a property has declined by 1.5% which on a cap rate basis is equivalent to around a 20% reduction in implied value. Adding to the risk on house prices are those properties where insurers refuse to provide coverage. Between 2020 and 2022 insurers declined to renew 2.8 million homeowner policies. Estimates suggest that 10% of homes in Los Angeles are uninsured. There are government programs to provide cover where private insurance refuses but these cap coverage at $3 million and come with premiums that are double private insurance costs. The California state government has also introduced legislation requiring insurers to have at least 85% of their statewide portfolio in risk areas which will result in further premium increases and inevitably even larger hits to house prices. Add further to this that these back of the envelope numbers do not include the impact of other insurance premium increases such as auto insurance and business insurance, all of which have risen by as much if not more than home insurance. Plus the fact that the costs of rebuilding a house will skyrocket. Having increased almost 70% since the lows in 2017 before levelling off in the 1 January 2025 renewals reinsurance rates will also likely increase as demand for reinsurance will increase but capacity will be limited. This further increases the likelihood of increases in the cost of primary insurance even to those not in California.
But before you thank your lucky stars you live in Australia and not California, consider that in Australia, employee households have seen their gross insurance costs increase by 50% from the end of 2017. According to the Insurance Council of Australia around 1 in 12 properties (equivalent to 1.2 million properties) have some level of flood risk with around 1 in 60 at risk of flooding every 20 years. Around 1 in 3 properties (5.6 million properties) are at risk of a bushfire.
In November 2024 researchers from the University of Technology Sydney published research showing that houses in an area with a greater than a 1 in 100 year flood risk were priced a 10.8% discount. The researchers found that the cost of insurance almost was around 0.5% per annum higher for houses in a 1 in 100 year flood zone. But perhaps the most important finding was that there was no discernible price impact where the property is located in an area with a 1 in 1000 year flood risk nor is there an impact on house prices when an area is upgraded from a 1 in 1000 year flood risk zone to a 1 in 500 year flood risk zone. This means homeowners are exposed to the risk of sharp increases in insurance premiums if climate change results in a re-categorisation of the flood risk of an area. In many respects, Australia is even more exposed to the risk of weather events impacting house prices than even California.
Property investors need to consider how insurance premiums may increase through time, reducing net returns. Property lenders need to consider how increased cost of insurance could lead to higher cancellation rates leaving lenders fully exposed in the event of a weather related catastrophe. Ultimately both investors and lenders need to start considering the risk that insurance premium become a more relevant factor in the determination of house prices. By the time the flood or fire comes, it will be too late. [1] April, 2024; The Impact of Rising Insurance Premiums on U.S. House Prices. Funds operated by this manager: Challenger IM Credit Income Fund, Challenger IM Multi-Sector Private Lending Fund For Adviser & Investors Only Disclaimer: The information contained in this publication has been prepared solely for solely for the addressee. The information has been prepared on the basis that the Client is a wholesale client within the meaning of the Corporations Act 2001 (Cth), is general in nature and is not intended to constitute advice or a securities recommendation. It should be regarded as general information only rather than advice. Because of that, the Client should, before acting on any such information, consider its appropriateness, having regard to the Client's objectives, financial situation and needs. Any information provided or conclusions made in this report, whether express or implied, do not take into account the investment objectives, financial situation and particular needs of the Client. Past performance is not a guide to future performance. Neither Fidante Partners Limited ABN 94 002 895 592 AFSL 234 668 (Fidante Partners) nor any other person guarantees the repayment of capital or any particular rate of return of the Client portfolio. Except to the extent prohibited by statute, Fidante Partners or any director, officer, employee or agent of Fidante Partners, do not accept any liability (whether in negligence or otherwise) for any errors or omissions contained in this report. |

4 Mar 2025 - 10k Words | February 2025
|
10k Words Equitable Investors February 2025 The AI theme is taking up greater share of S&P 500 market cap than previous growth "bubbles" while fund managers' cash holdings are at 15-year lows. US valuations have left Europe in the dust but sustainable high growth is scarce; and there is healthy debate over whether US valuations stack up (and on Morningstar's numbers Australian stocks are more overvalued than US peers). It is reporting season in Australia and the final week of February will be big. Be careful what you take away from it though - it seems CEO sentiment is not a reliable indicator. Meanwhile, US consumers are showing some distress in the form of credit cards 90+ days in arrears. There has been an uptick in non-performing personal loans and home mortgages as a % of bank assets in Australia too. With coffee bean prices surging, meanwhile, it is good to know the bean is only ~11.5% of the price of a cup of coffee. Market cap as % of S&P 500 for "market leadership" themes 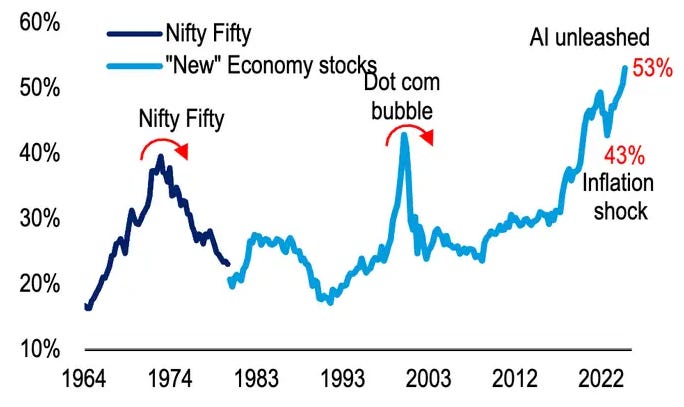
Source: Bank of America Global Research Fund Manager Survey cash level (% of Assets Under Management) 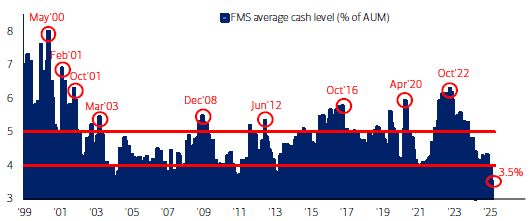
Source: Bank of America Global Research European market PE multiple at record discount to US 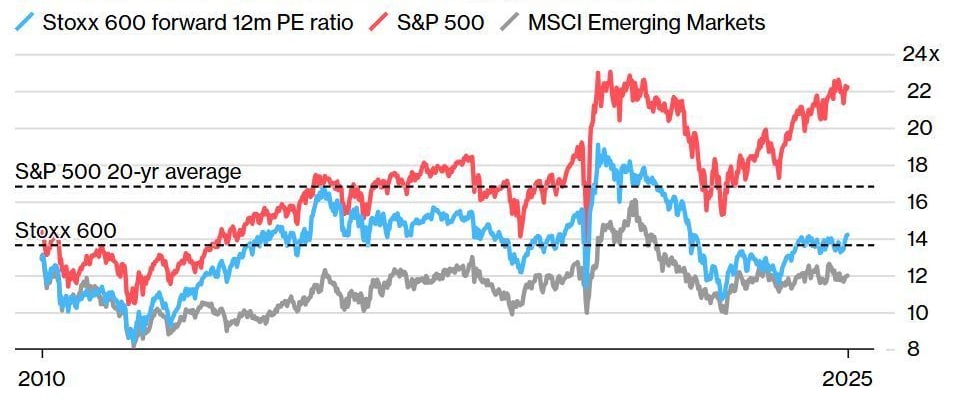
Source: Bloomberg via @BobEUnlimited Growth in market cap of the Nasdaq Composite - historical & forecast 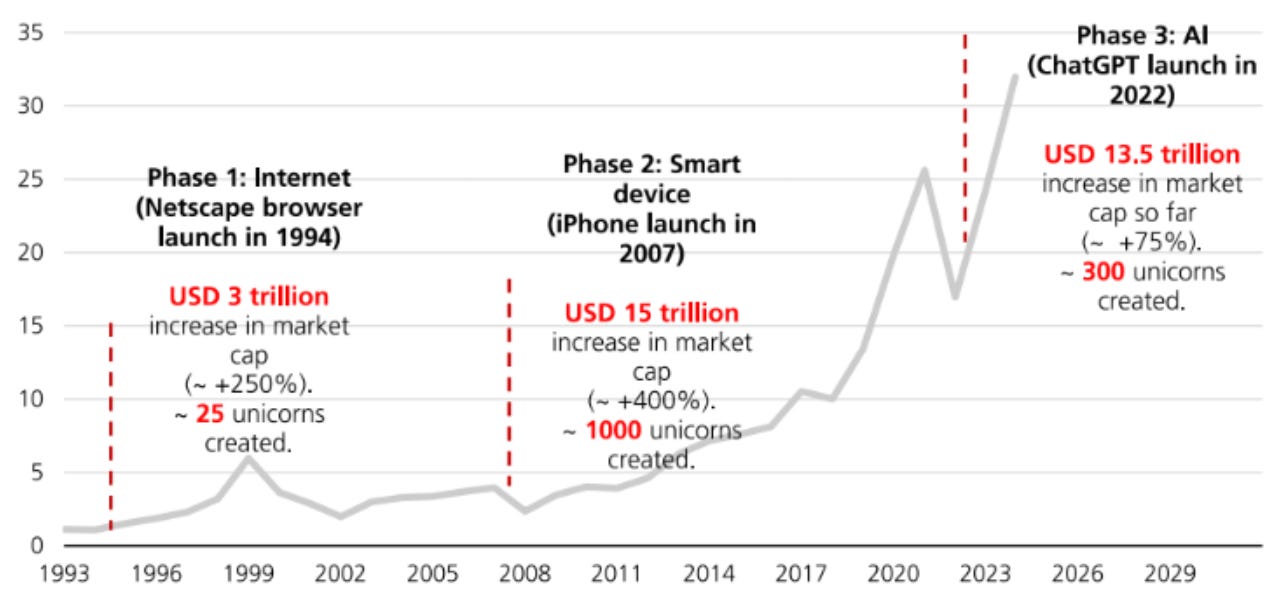
Source: UBS Three-year compound annual sales growth rates for US companies, 1962-2024 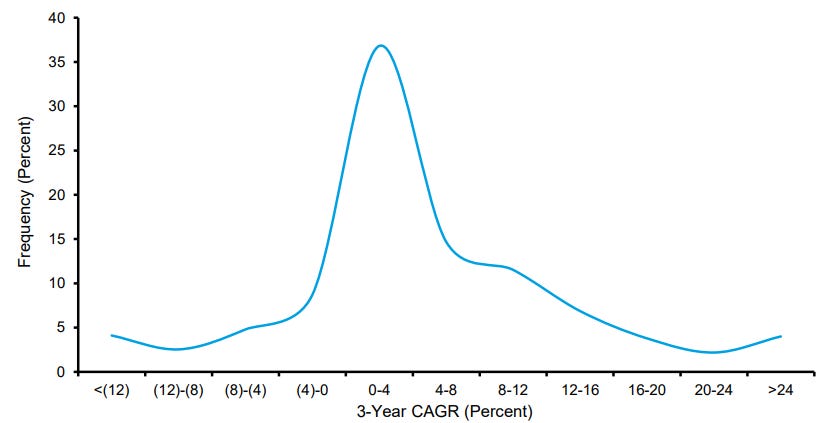
Source: Morgan Stanley Morningstar's bottom-up fair value estimate of the US market 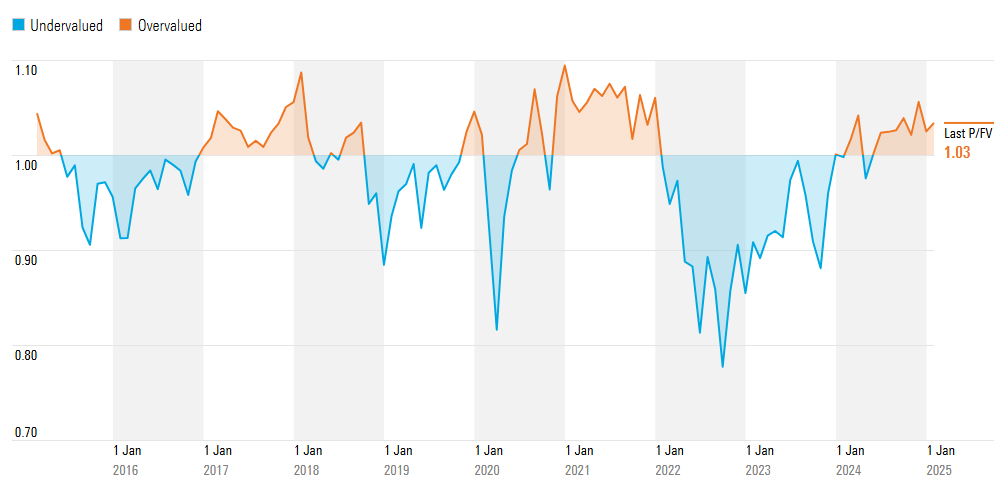
Source: Morningstar Morningstar's bottom-up fair value estimate of the Australian market 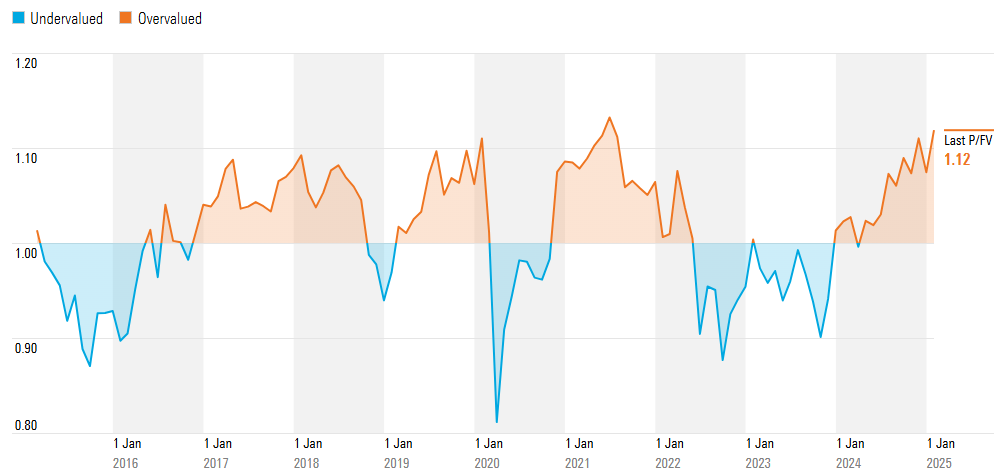
Source: Morningstar No. of ASX-listed companies reporting each week of February reporting season 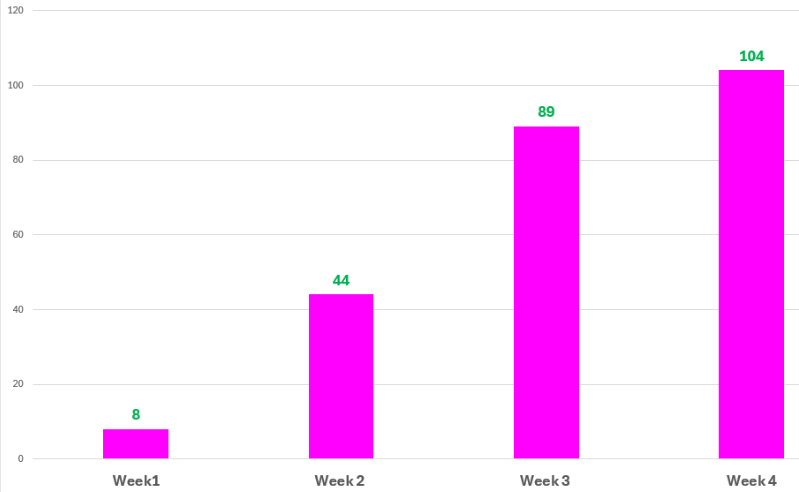
Source: Coppo Report S&P/ASX Small Ordinaries weighting (% of index) reporting each week of February 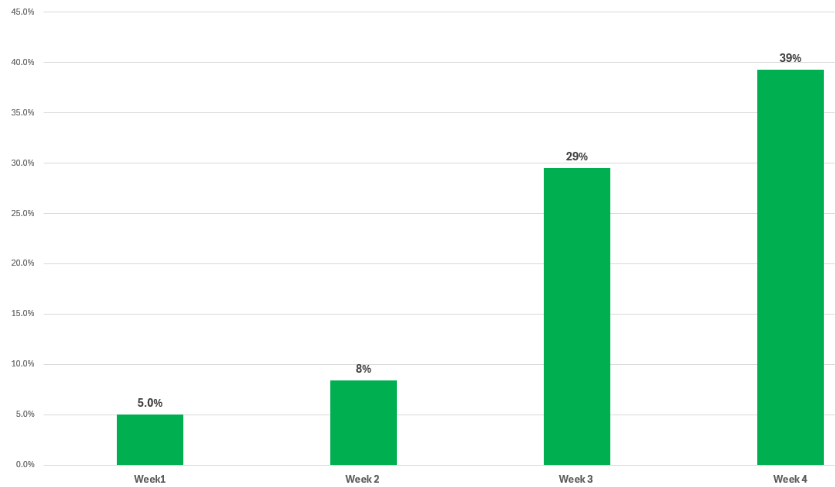
Source: Coppo Report CEOs bad at market timing 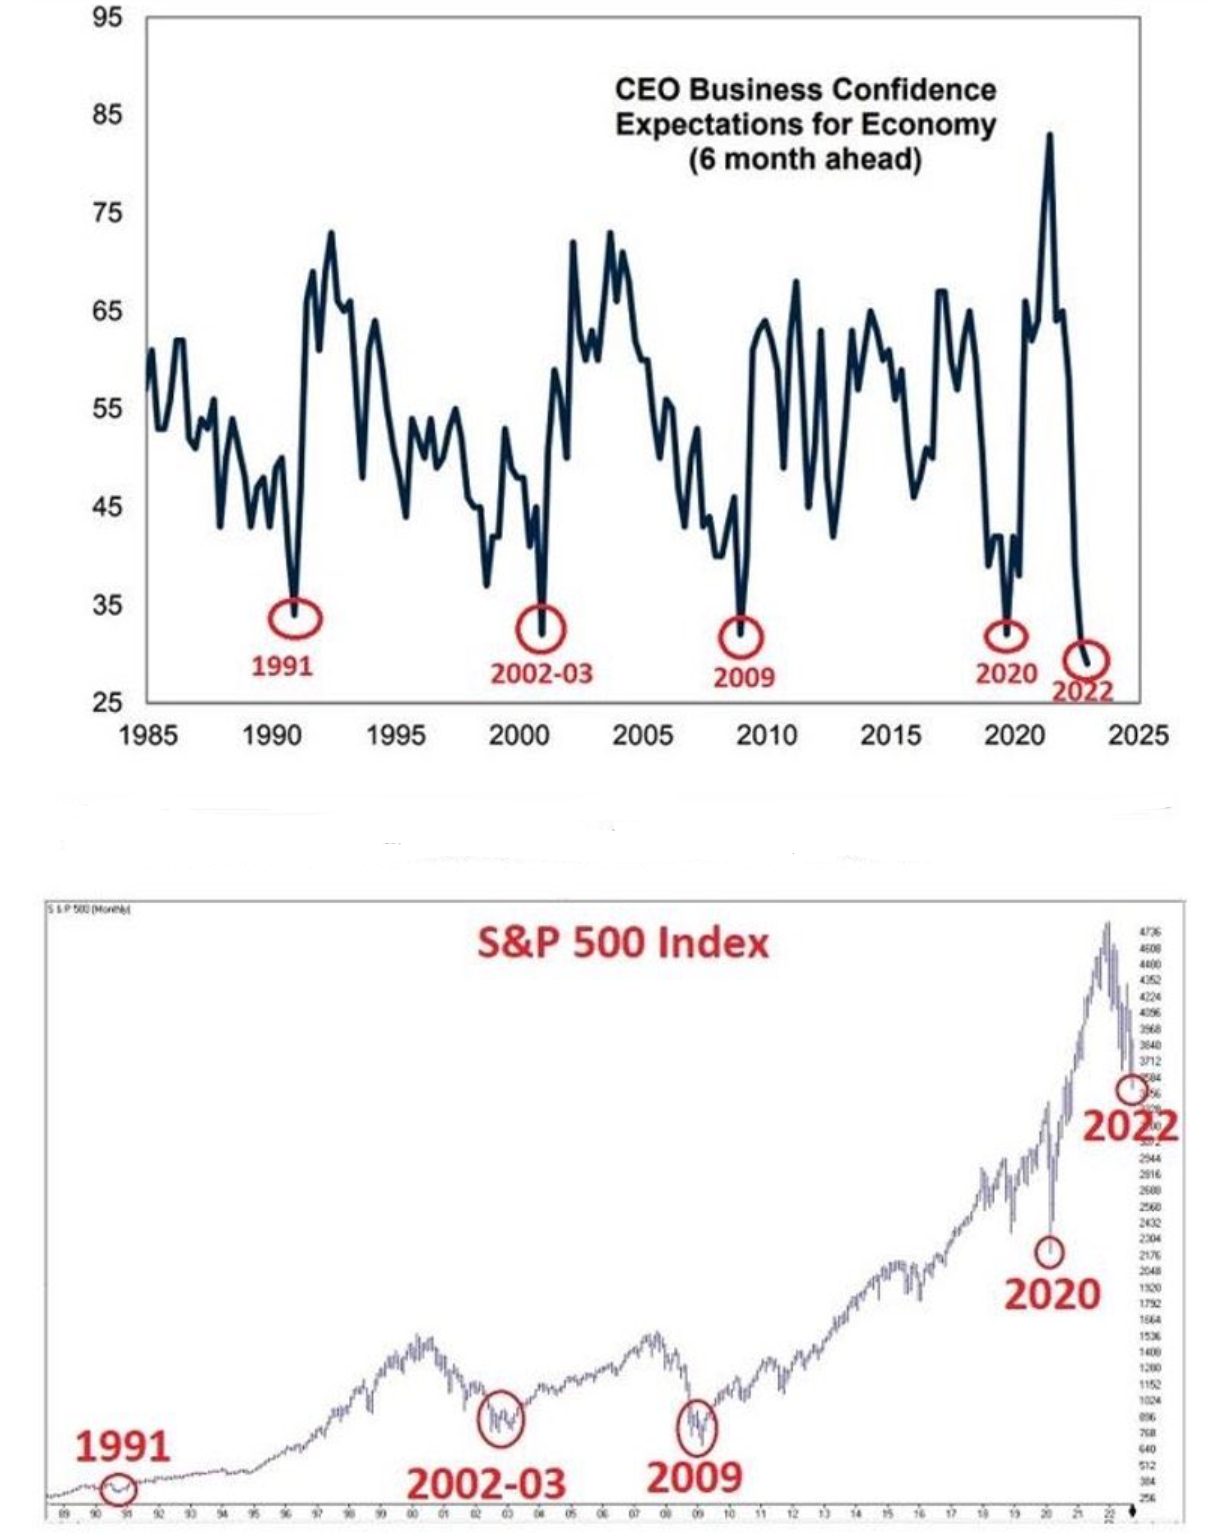
Source: Goldman Saches, @BrianFeroldi US consumer credit: percent of balance 90+ days delinquent by loan type 
Source: New York Fed Australian banks' non-performing assets - as % of assets by type 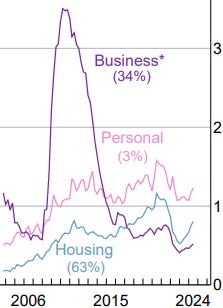
Source: RBA Historical price of Coffee (Arabica) 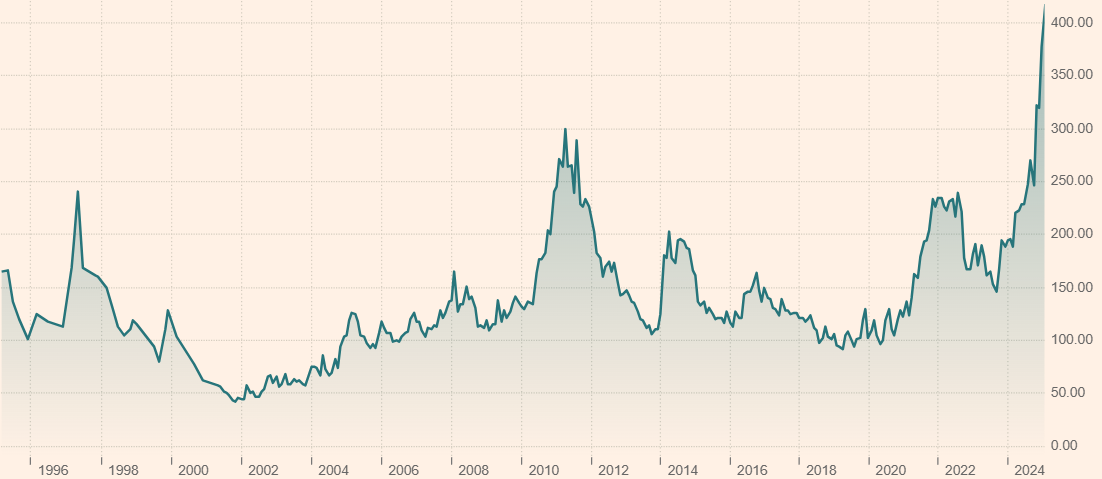
Source: Financial Times Cost composition of a cup of coffee 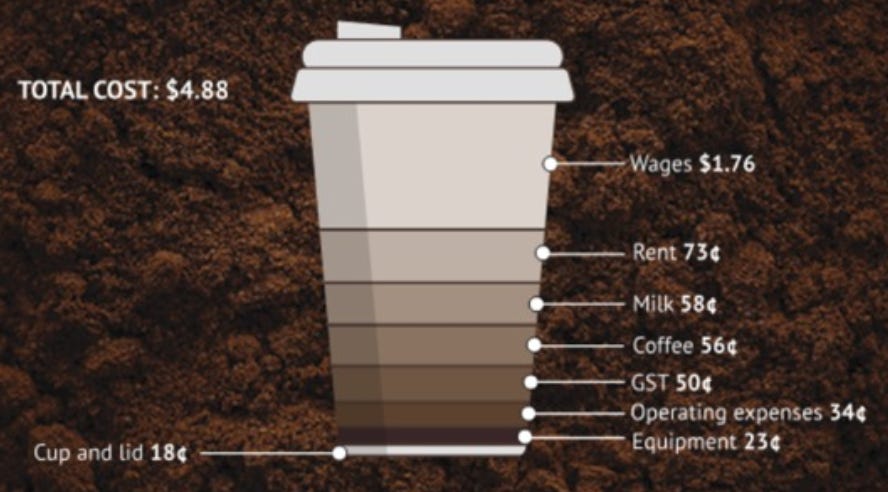
Source: Pablo & Rusty's February 2025 Edition Funds operated by this manager: Equitable Investors Dragonfly Fund Disclaimer Past performance is not a reliable indicator of future performance. Fund returns are quoted net of all fees, expenses and accrued performance fees. Delivery of this report to a recipient should not be relied on as a representation that there has been no change since the preparation date in the affairs or financial condition of the Fund or the Trustee; or that the information contained in this report remains accurate or complete at any time after the preparation date. Equitable Investors Pty Ltd (EI) does not guarantee or make any representation or warranty as to the accuracy or completeness of the information in this report. To the extent permitted by law, EI disclaims all liability that may otherwise arise due to any information in this report being inaccurate or information being omitted. This report does not take into account the particular investment objectives, financial situation and needs of potential investors. Before making a decision to invest in the Fund the recipient should obtain professional advice. This report does not purport to contain all the information that the recipient may require to evaluate a possible investment in the Fund. The recipient should conduct their own independent analysis of the Fund and refer to the current Information Memorandum, which is available from EI. |

3 Mar 2025 - Performance Report: ASCF High Yield Fund
[Current Manager Report if available]

3 Mar 2025 - 2024 Responsible Investment and Stewardship Report

28 Feb 2025 - Hedge Clippings | 28 February 2025
|
|
|
|
Hedge Clippings | 28 February 2025 This week we're going a bit off-piste. Trump or Musk fans might not want to read further. Back when Hedge Clippings was still in short pants (a long, loong time ago!) he had a favourite Aunt who used to recite Lewis Carroll's Alice in Wonderland, and the two characters that come to mind in particular are Tweedledum and Tweedledee. For those less familiar with Carroll's work, T'dum and T'dee were two near identical characters, reminiscent of the current day Tweedle'Donald, and Tweedle'Elon. For the musically inclined, Bob Dylan even recorded a song entitled Tweedle Dee and Tweedle Dum, (possibly not my favourite Dylan track) on his appropriately entitled 2021 album, Love and Theft:
Webinar Making the most of FundMonitors.com - "Simply Better Research" | FundMonitors.com News & Insights Starting Points Matter | Airlie Funds Management Market Commentary - January | Glenmore Asset Management January 2025 Performance News Insync Global Quality Equity Fund TAMIM Fund: Global High Conviction Unit Class |
|
|
If you'd like to receive Hedge Clippings direct to your inbox each Friday |

28 Feb 2025 - Performance Report: Digital Income Fund (Digital Income Class)
[Current Manager Report if available]


