
NEWS

6 May 2025 - Performance Report: Seed Funds Management Hybrid Income Fund
[Current Manager Report if available]

6 May 2025 - Glenmore Asset Management - Market Commentary
|
Market Commentary - March Glenmore Asset Management April 2025 Globally, equity markets fell sharply in March. In the US, the S&P 500 fell -5.8%, the Nasdaq declined -8.2%, whilst in the UK, the FTSE outperformed, falling just -2.6%. Relevant for the Glenmore Australian equities fund was the ASX small industrials accumulation index, which fell -6.7% in March. Gold stocks were the strongest performer on the ASX, boosted by a +10.6% increase in the gold price. Defensive sectors such as utilities, telco's and insurance also outperformed. Growth stocks (in particular technology stocks) fell sharply, due to investors adopting a "risk off" approach as well as growing concern about the rate of global economic growth. The catalyst for the negative returns in March was continued discussion around the US government introducing tariffs on various trading partners. The proposed tariffs and general uncertainty around US president Donald Trump's policy making resulted in investors becoming very cautious towards global economic growth and equities across all sectors. In addition, the tariffs imposed by the US have the potential to be inflationary in the short term, which could pose a new risk for investors. Bond markets were quite subdued during the month despite the equity markets volatility. In the US, the 10-year bond yield fell -3 basis points (bp) to 4.21%, whilst its Australian counterpart rose 9 bp to close at 4.39%. The Australian dollar was broadly unchanged over the month, closing at US$0.62. Our view is that the recent sell off over the last two months will likely prove to a good buying opportunity for investors willing to a take a medium-term view. As is typically the case in these market corrections, growth stocks and small/mid cap stocks were sold off very significantly, whilst large caps stocks outperformed given their safe haven status. The fund currently has a cash weighting of ~15%. As we have done in past periods, we have used this period of weakness to add to a number of stocks in the fund at attractive valuations. In addition, if global economic growth does slow materially over the course of 2025, we believe central banks will consider interest rate reductions, which would likely to be positively received by investment markets. Funds operated by this manager: |

5 May 2025 - 10k Words | April 2025
|
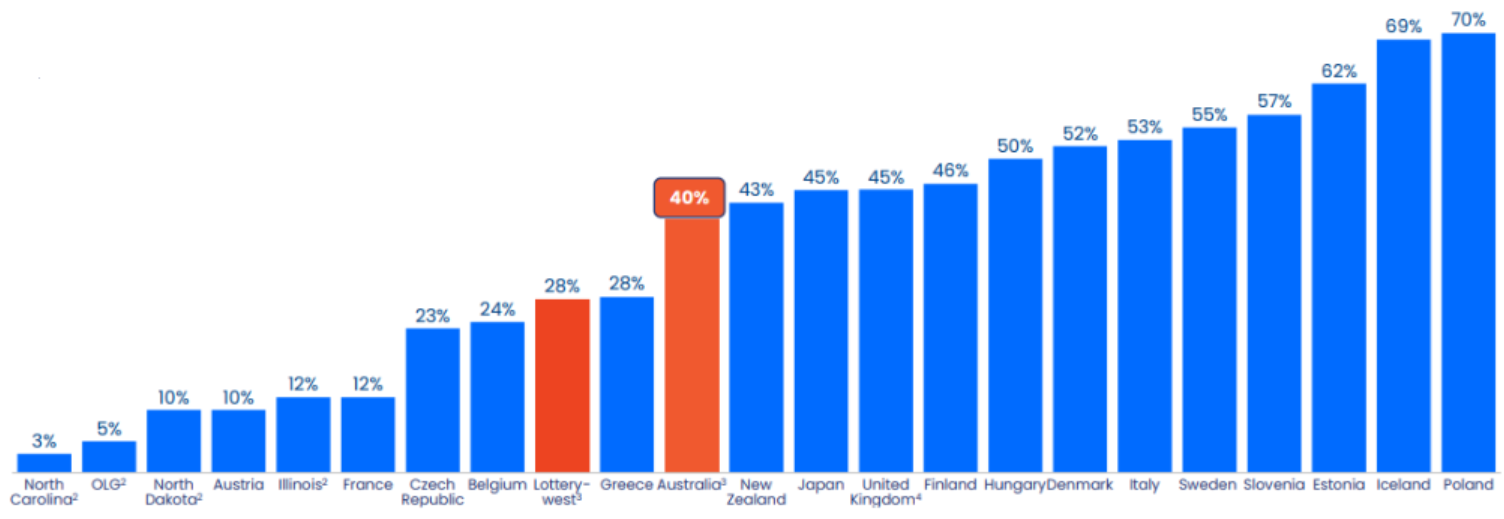
10k Words Equitable Investors April 2025 Apparently, Confucius did not say "One Picture is Worth Ten Thousand Words" after all. It was an advertisement in a 1920s trade journal for the use of images in ads on the sides of streetcars... Passive investment in global equities appears to have continued on while active flows remain negative and foreign demand for US stocks reverses sharply. But in the US, momentum was the winning factor in the past volatile week and month, a factor small caps have been lacking, with small cap earnings growth over the past decade generally not accompanied by multiple expansion. Credit spreads have been on the rise and the correlation between credit spreads and the valuation of equities has also been increasing. The post-tarrif volatility has cut back the forward PE on the ASX sharply BUT it is worth bearing in mind that the ASX's largest companies were established in a more distant era than the dominant companies in the US, where multiples are higher. On the US - inflation was retreating nicely prior to the tarrifs but consumer confidence is at GFC levels. Finally, we divert to look at online penetration of lottery sales around the world. Flows into global equities 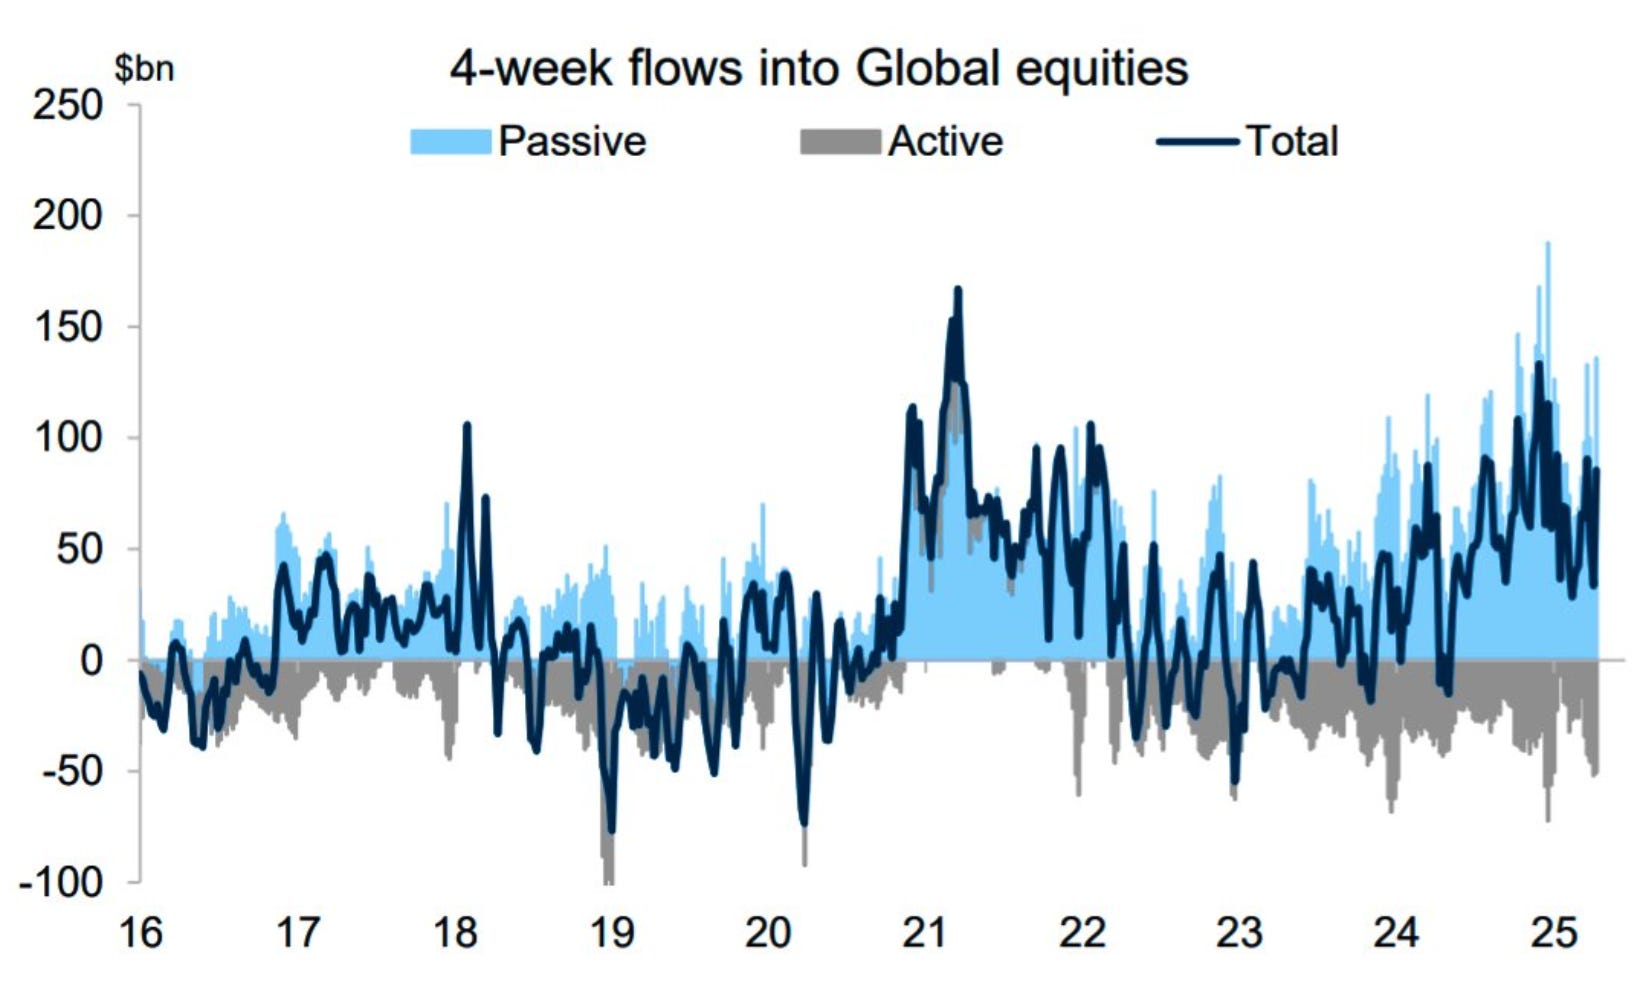
Source: Goldman Sachs Foreign official demand for US stocks 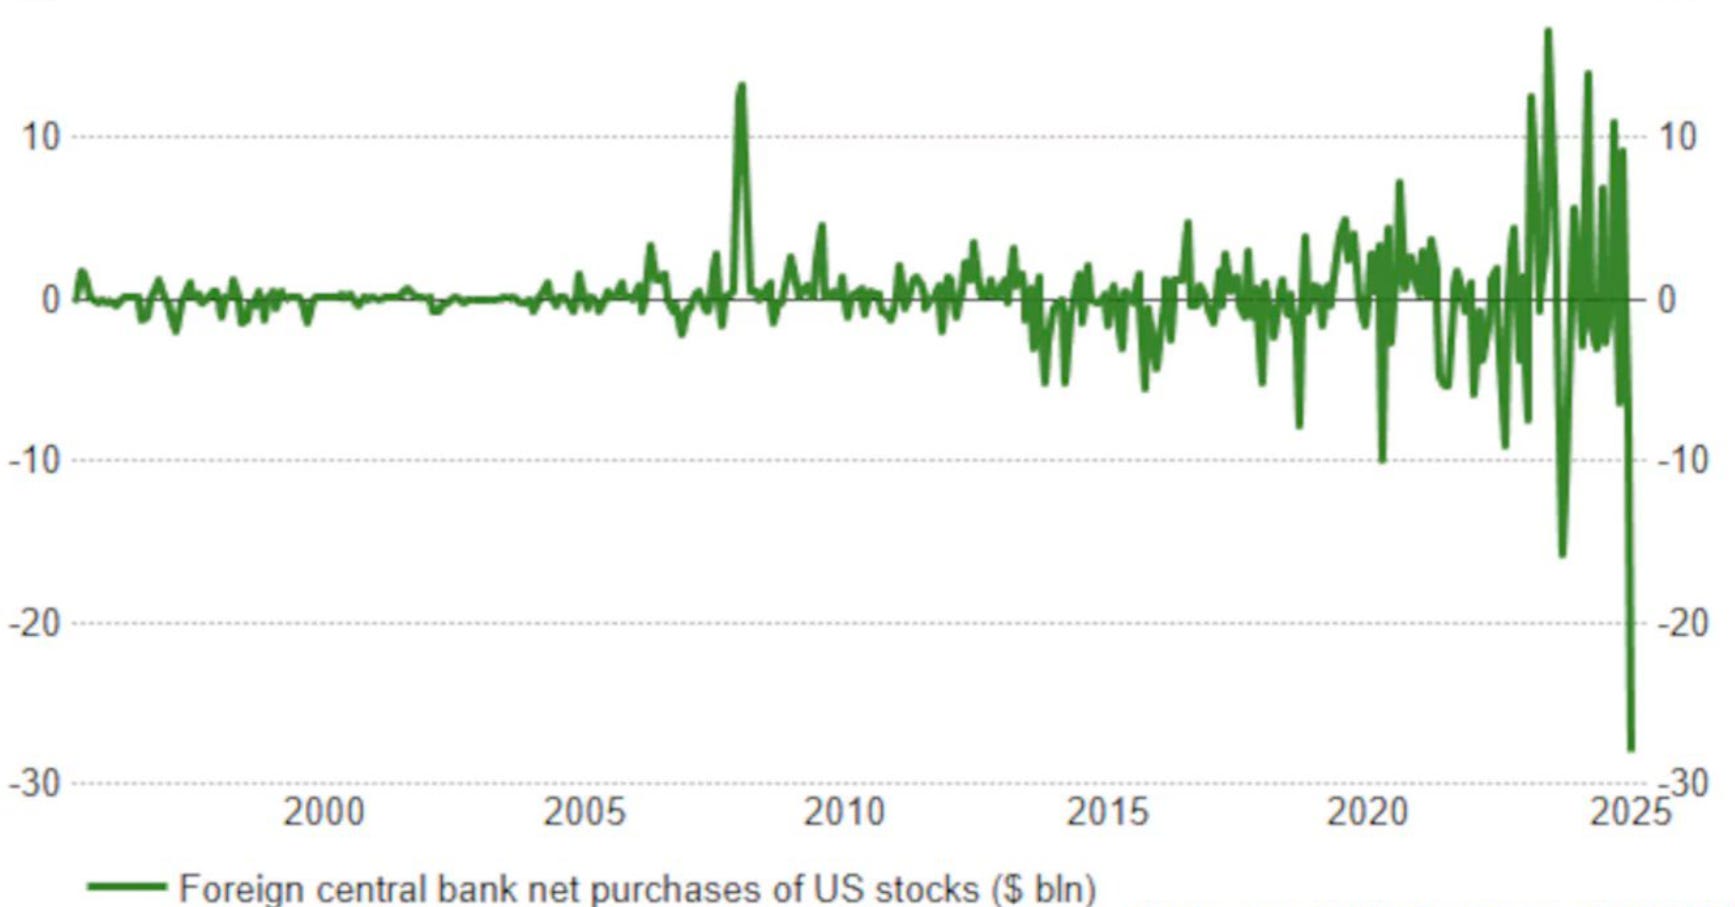
Source: Reuters, Charles Schwab US equity market factor performance as of end of last week (ETF factor proxies) 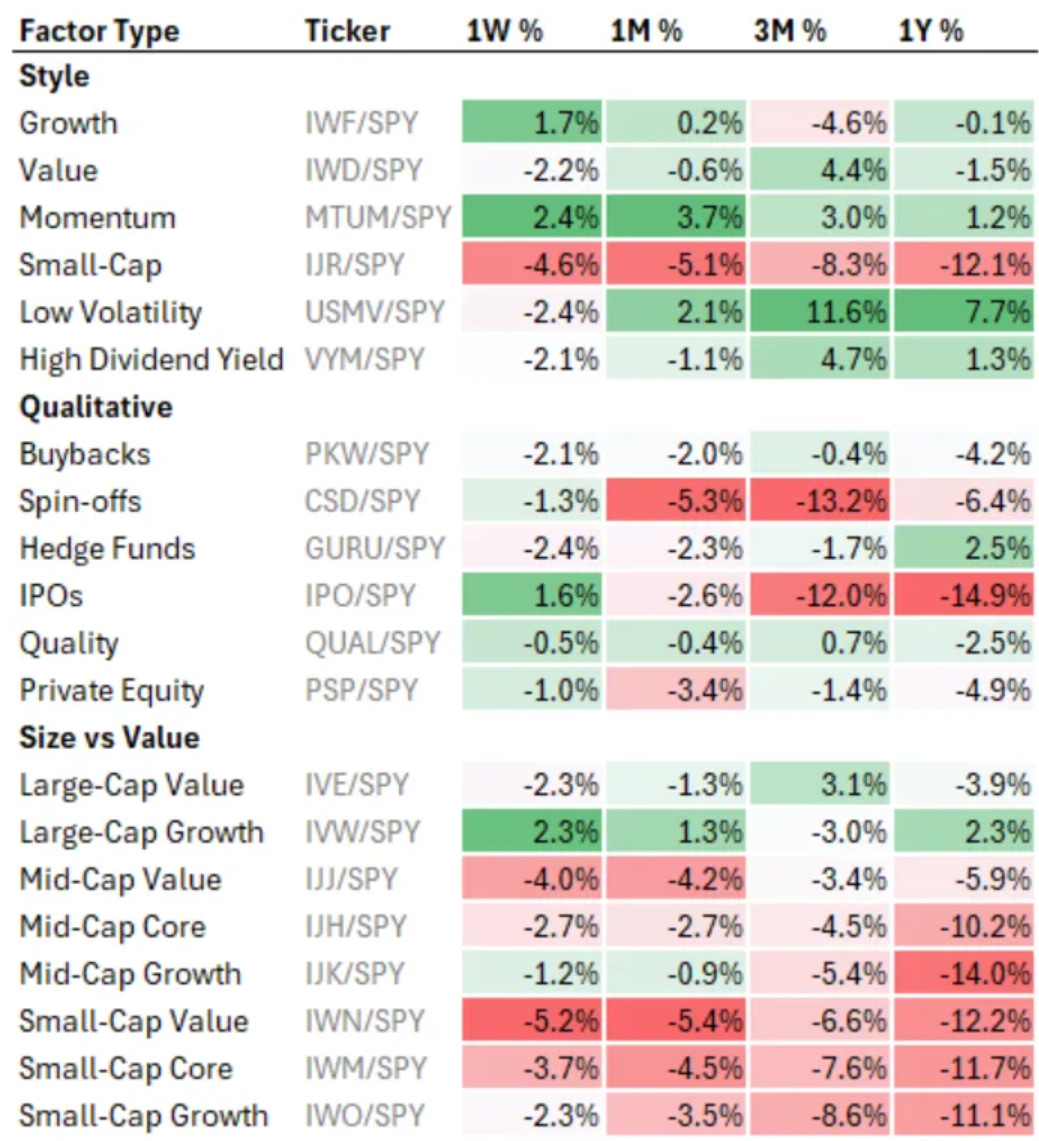
Source: Koyfin, Equitable Investors Strong earnings growth for small caps but their returns lagged as their valuation multiples remained more or less the same (2015-2024) 
Source: Robeco ICE BofA US High Yield Index Option-Adjusted Spread 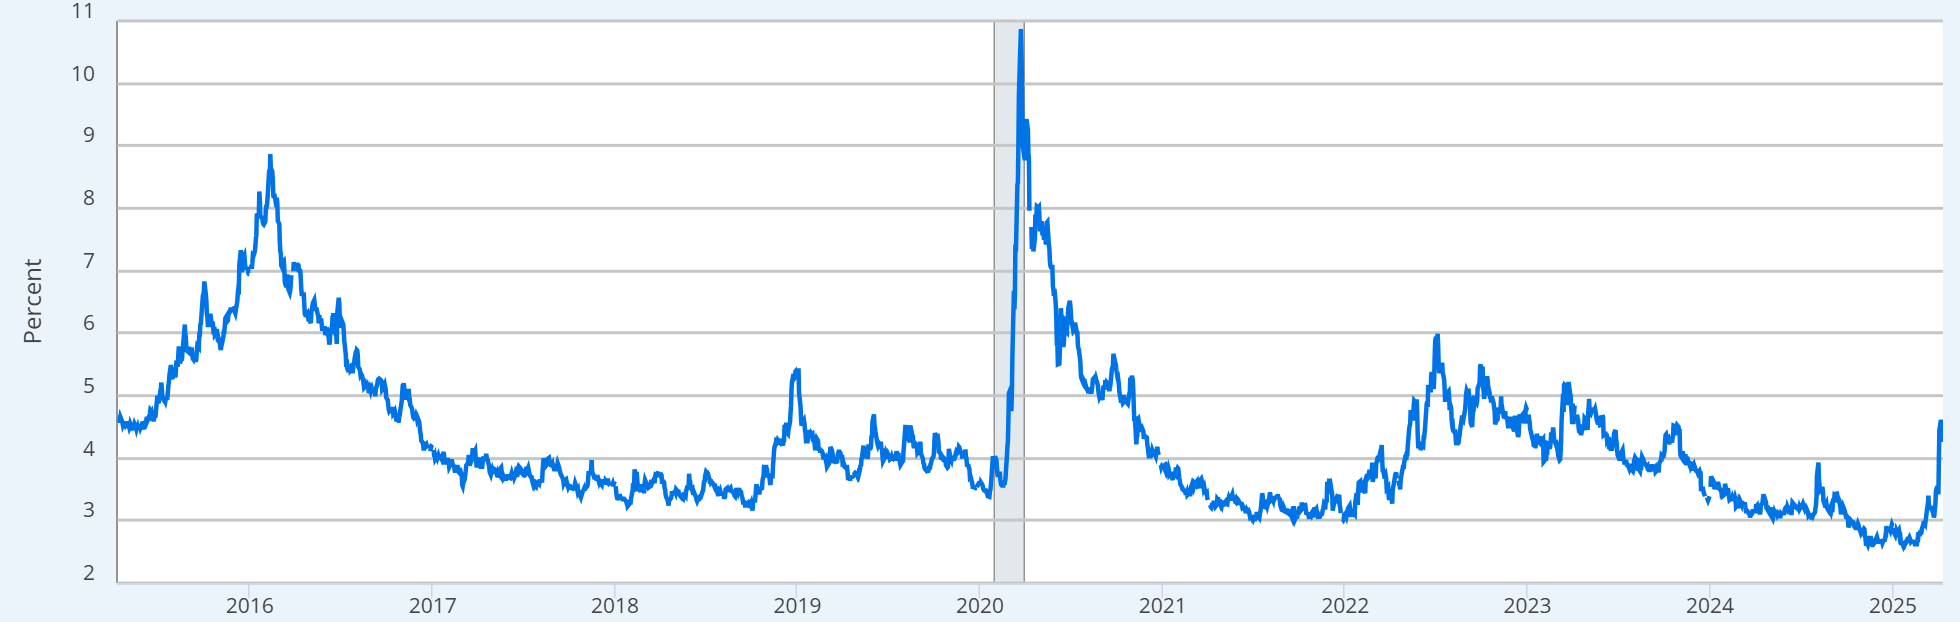
Source: FRED Relationship between the S&P 500 forward PE multiple & credit spreads 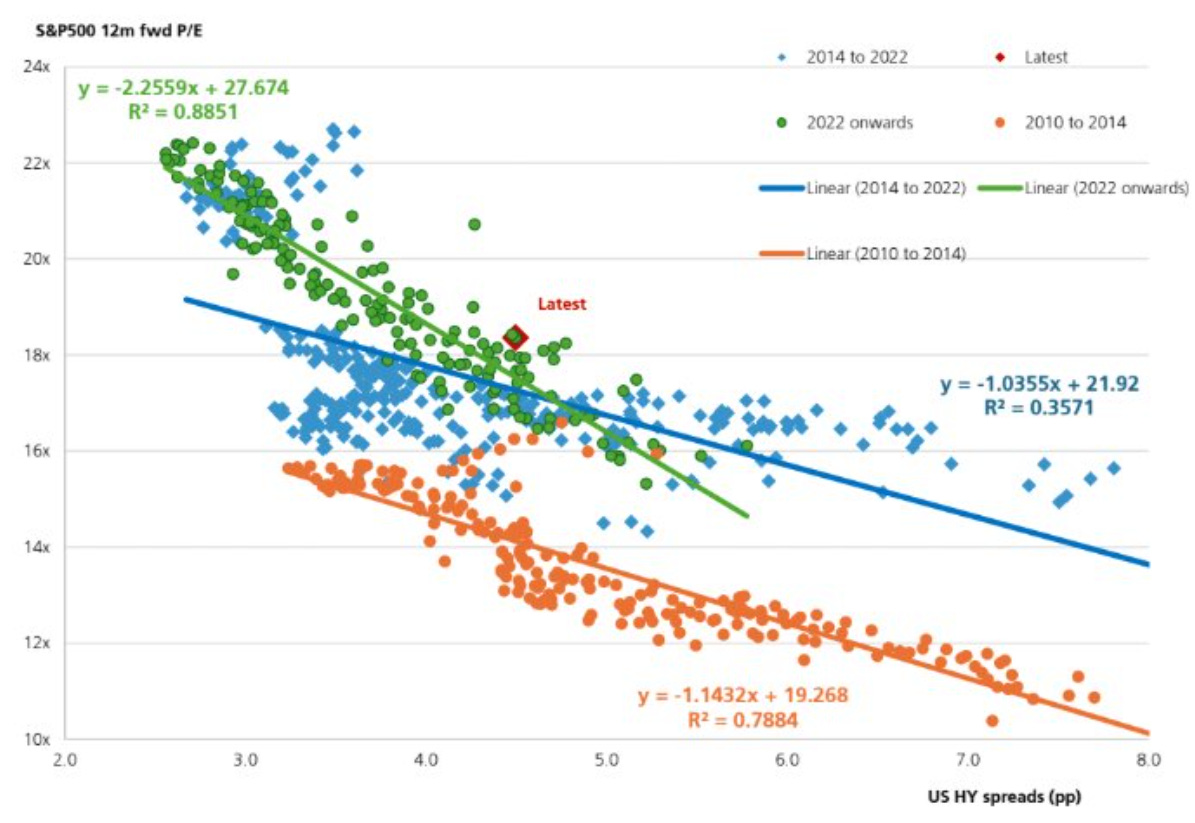
Source: UBS US & Australian government bond yield spreads (10 year v 2 year) 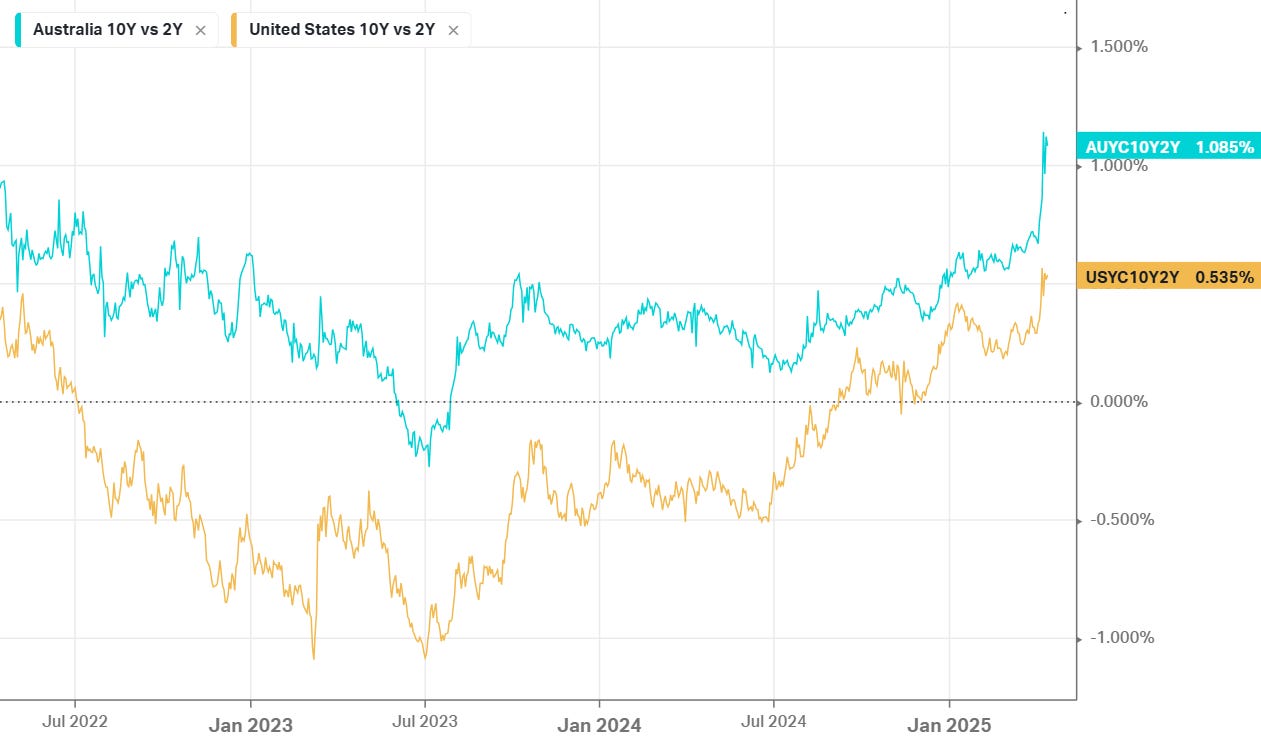
Source: Koyfin ASX forward PE multiple 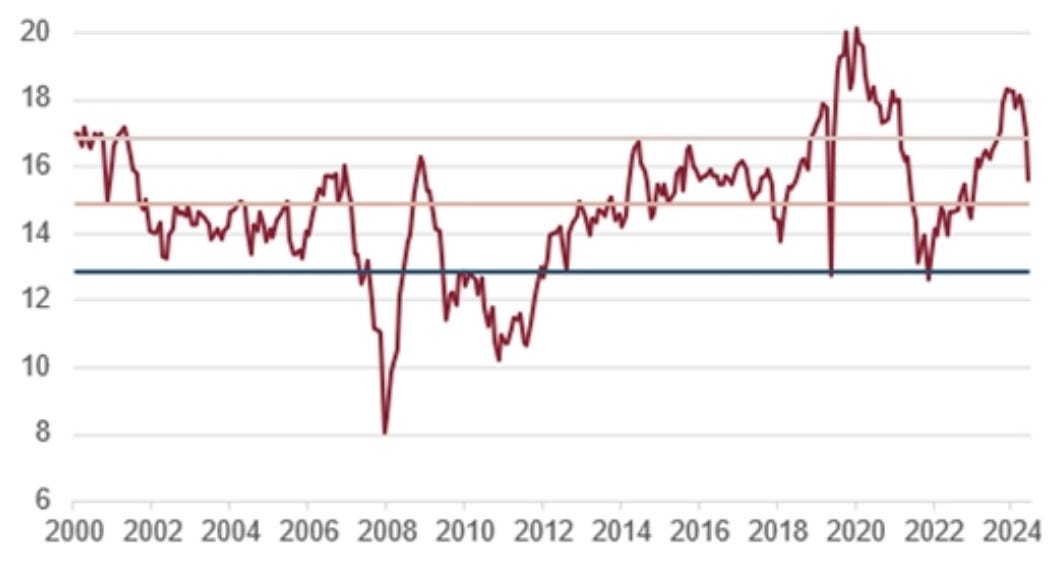
Source: Evans & Partners Australia's largest companies from a different era to the US 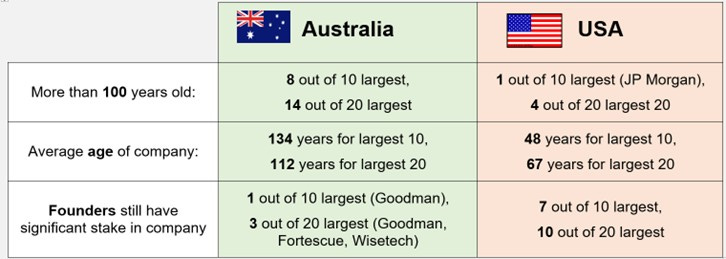
Source: Owen Analytics Forward PE on US equities 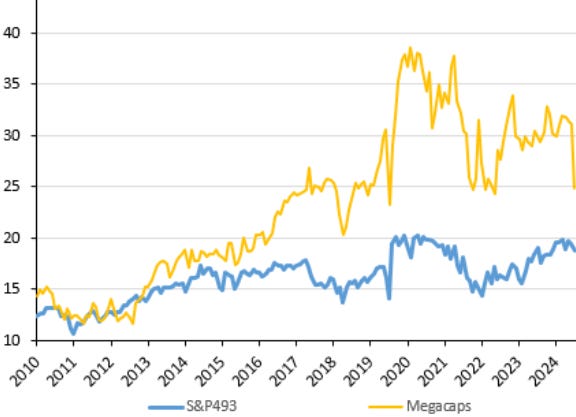
Source: Evans & Partners US core inflation had been falling sharply 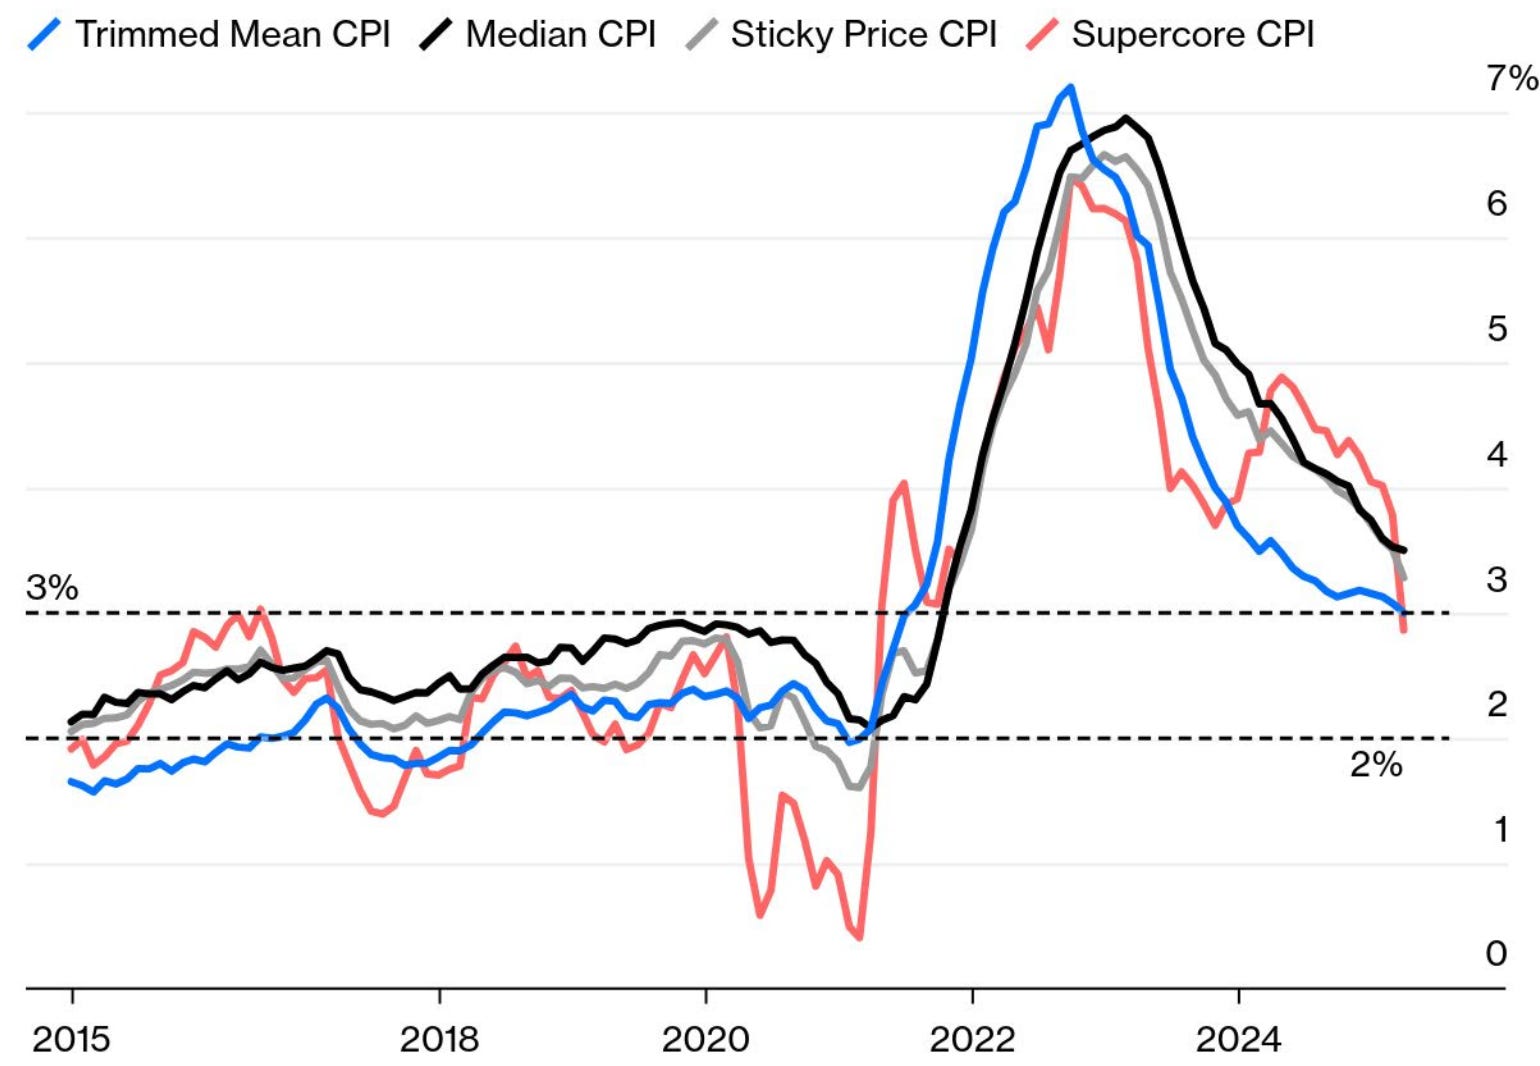
Source: Bloomberg US consumer confidence drops to GFC levels 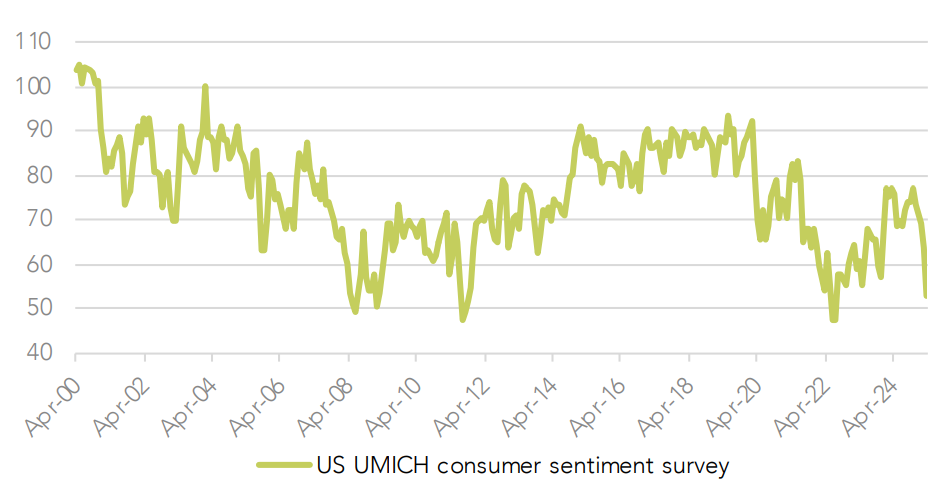
Source: Wilsons Advisory Online penetration of lottery sales Source: Jumbo Interactive (ASX code: JIN) April 2025 Edition Funds operated by this manager: Equitable Investors Dragonfly Fund Disclaimer Past performance is not a reliable indicator of future performance. Fund returns are quoted net of all fees, expenses and accrued performance fees. Delivery of this report to a recipient should not be relied on as a representation that there has been no change since the preparation date in the affairs or financial condition of the Fund or the Trustee; or that the information contained in this report remains accurate or complete at any time after the preparation date. Equitable Investors Pty Ltd (EI) does not guarantee or make any representation or warranty as to the accuracy or completeness of the information in this report. To the extent permitted by law, EI disclaims all liability that may otherwise arise due to any information in this report being inaccurate or information being omitted. This report does not take into account the particular investment objectives, financial situation and needs of potential investors. Before making a decision to invest in the Fund the recipient should obtain professional advice. This report does not purport to contain all the information that the recipient may require to evaluate a possible investment in the Fund. The recipient should conduct their own independent analysis of the Fund and refer to the current Information Memorandum, which is available from EI. |

2 May 2025 - Hedge Clippings | 02 May 2025
|
|
|
|
Hedge Clippings | 02 May 2025 The choice of descriptions of the 2025 election campaign are numerous, but we would suggest all are synonyms of one of the following: boring, disappointing, uninspiring. In other words lacking any real vision for the future - other than that of the individuals contesting the various seats. Primary amongst the culprits are Albanese and Dutton. Albo at best has been uninspiring during his three years in the top office, and until the start of the year when he seemed to develop some enthusiasm for the task ahead, looked like he was gone for all money. Then along came Peter Dutton, who having had nearly three years to prepare for the election, has done nearly everything he could to make Albo re-electable - or rather the least worst option in a two-horse race. Maybe he was relying on Albo to trip up (which he almost did when falling off the stage), or merely bore the electorate into ensuring he became a one term PM. The only thing to be said for Albo is he went full term - unlike his predecessors Kevin Rudd, Julia Gillard and then Kevin again. For example: For some reason Dutton (or the faceless men and women of the Liberal party hierarchy) thought that going from being a zero operator of nuclear power stations - following a dirty backroom deal in the Senate engineered by the Greens in 1998 - to having seven major nuclear stations in one swoop, would be an easy sell. It might have been to the party faithful, but where was the background media and PR campaign promoting small-scale modular reactors (SSMR's)? In its place, the government was able to mount (yet another) scare campaign, in spite of 32 countries around the world operating no less than 440 nuclear reactors, with France relying on nuclear for 70% of its power generation, and Australia signing up for nuclear powered submarines. Given Dutton's timeframe for Australia to "go nuclear" is 10 to 15 years (assuming no delays), surely a smarter move would be to hasten slowly, while getting the majority of the electorate onside, and exploring the latest technology provided by SSMR's? Meanwhile, Australia accounts for around 30% of the world's supply of uranium, which is currently selling for just over US$50 per pound. But we don't/won't use it. Go figure? Dutton has allowed himself to play catch-up with an irresponsible spendathon, and has ended up matching dollar for dollar the Labour Party's lavish vote-grabbing hand-outs, while opposing tax cuts for all. As we've noted before, voters are driven by their back pockets. Albanese and Chalmers have cynically targeted nearly every self-interested demographic group in the country, with the economic equivalent of fairy bread at a four-year-old's birthday party - looks attractive, the punters will lap it up, but it won't do them any good after the initial sugar hit. Both parties have committed to increased budget deficits, and no-one is talking about structural changes to the budget or the taxation system. Except the Labour party, who want to introduce a tax on unrealised capital gains... but haven't really been called out on it. Go figure again! Meanwhile Dutton hasn't been helped by a typical scare campaign, but he's left himself open to that. So the polls - and the media - are writing the opposition off. Maybe there's an outside chance of an upset given the peculiarities of Australia's voting system and state-based biases, but we doubt it. The good news is that the election will be over next week. The bad news is that whoever wins will be there for another three years! Back to interest rates: Inflation is now in the RBA's mid range target at 2.4%, (for the second quarter in a row) or 2.9% if you take their preferred trimmed mean measure. Capital city weighted mean was a tad higher at 3.0%, with Brisbane spoiling the party thanks to the end of $1,000 electricity handouts. On receipt of the numbers, Jim Chalmers was as keen as usual not to be pressuring the RBA, whilst doing precisely that, but it is going to be difficult for the RBA to keep rates on hold at 4.1% following their next meeting on the 20th of May. News & Insights Manager Insights | East Coast Capital Management The Future of Transport: Innovations transforming how we move | Magellan Asset Management First Do No Harm | Airlie Funds Management March 2025 Performance News TAMIM Fund: Global High Conviction Unit Class Insync Global Capital Aware Fund DAFM Digital Income Fund (Digital Income Class) |
|
|
If you'd like to receive Hedge Clippings direct to your inbox each Friday |
2 May 2025 - Performance Report: Equitable Investors Dragonfly Fund
[Current Manager Report if available]

2 May 2025 - Increased Market Volatility - A 2025 Update
|
Increased Market Volatility - A 2025 Update Eiger Capital April 2025 In early 2024 we wrote a note attempting to quantify the perception that volatility around results during the February 2024 interim results season had increased materially. The VibeThe AFR wrote an opinion piece on March 3, 2024, noting that the corporate reporting season was not the sleepy affair it once was. They noted, using the 20% positive and negative share price reaction of Reece and Corporate Travel respectively as examples, that the days of subtly guiding the market to a safe low volatility consensus appear to be over. The AFR noted that in their opinion that Reece tended to be less willing to constantly update the market while Corporate Travel was more inclined to provide incremental updates between formal semi-annual reporting dates. They then noted that neither approach seemed to have, in this instance, achieved the lower volatility outcome perhaps desired by the requirement for continuous disclosure. The ongoing refinement of Factset, Bloomberg or Visible Alpha consensus data, that is available to anybody who is prepared to pay for it should you would think, other things being equal, also make it easier to minimise result day volatility. REH, CTD ASX: Corporate Travel and Reece trip up traders in wild reporting season (afr.com)1 The Australian also wrote an article on March 8 titled:
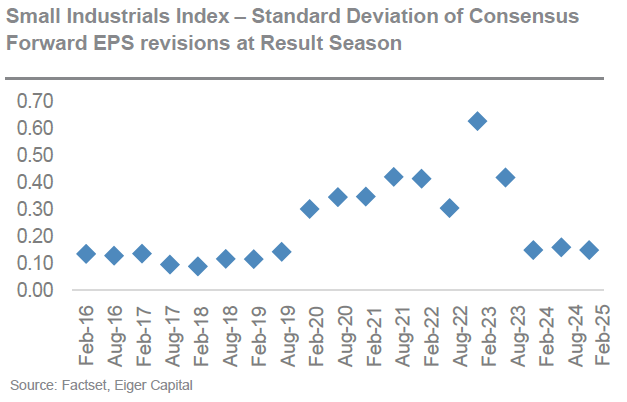
Woolworths, Qantas, other corporate shocks the result of poor communication | The Australian2 As a small and mid-cap manager we are not as familiar with the ASX top 50 stocks mentioned in this article other than to note that we believe that ASX 50 stocks tend to be less volatile than small and mid-caps. This article refers to a 17% decline in the result day share price of Lend Lease which appears to us to be small cap like in its quantum. Top-down numbersAn analysis of the S&P ASX Small Industrials Index over the February 2024 reporting season indicates that the size of forecast EPS revisions has reverted to pre - COVID levels. Updating this chart confirms this conclusion. The August 2024 and February 2025 EPS revisions are low and in line with February 2024.
The standard deviation of EPS revisions in February 2024 was in line with the period from February 2016 to August 2019. By February 2020 COVID had already become widespread in China, Italy and Iran and was beginning to rapidly spread. From mid-February 2020 to the end of that month the ASX 200 fell just over 9% having risen slightly in the first half of that month. The reporting periods from August 2020 to August 2023 have seen elevated EPS revisions as economic activity was very unevenly distributed with some sectors being significant winners (e.g. home delivery and home furnishings) and some significant losers (e.g. travel). During the COVID reopening period from early to mid-2022 there have still been significant variations in earnings outcomes as global supply chains have struggled to normalise and energy prices were disrupted by the start of the Russia- Ukraine war.
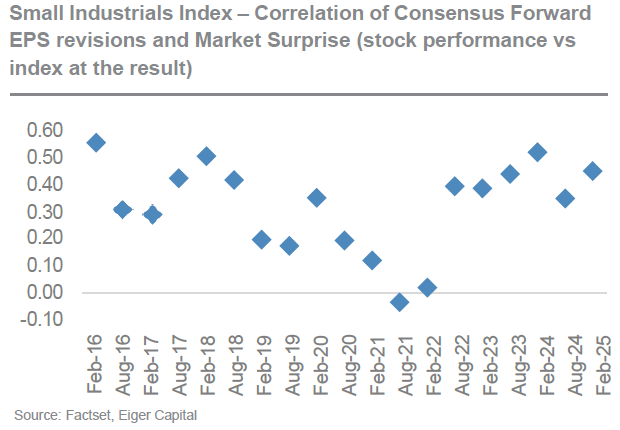
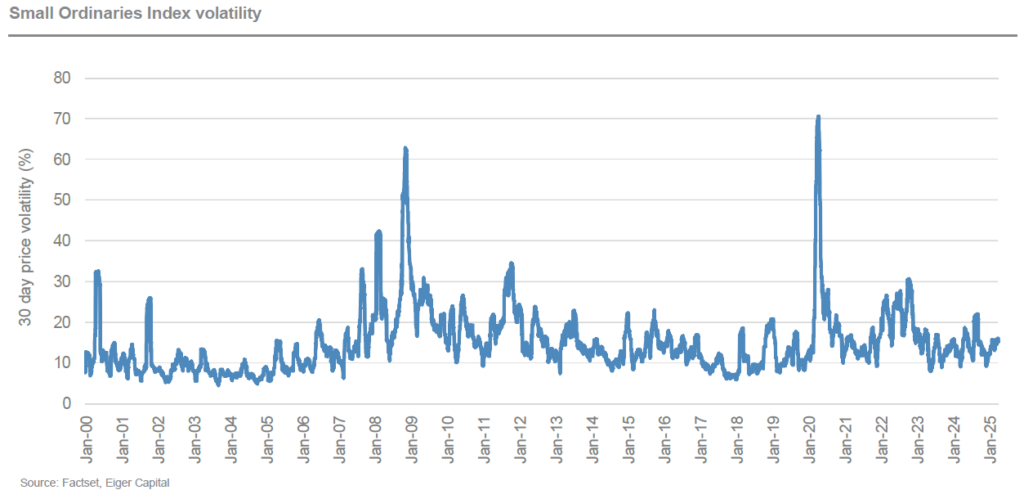
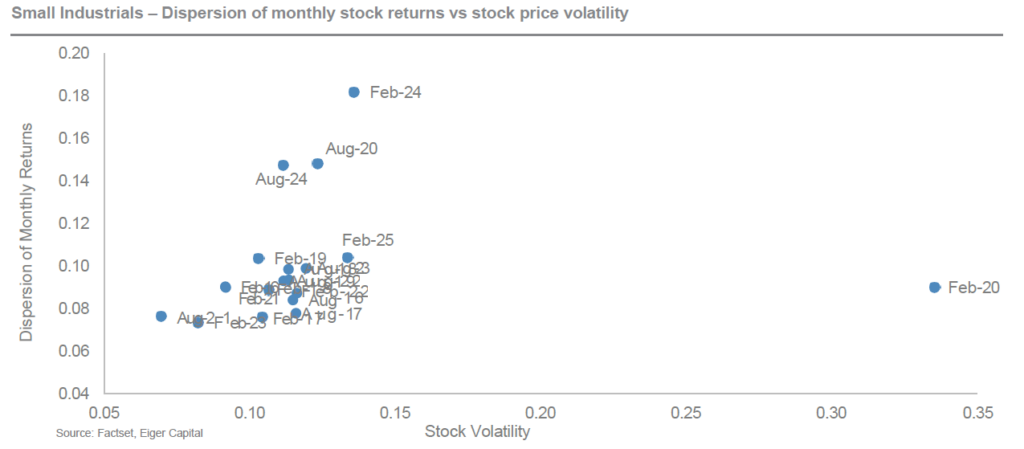
In addition to the variance of EPS revisions across the Small Industrials index declining in February 2024 the correlation of positive and negative revisions to the share price reaction increased back to the top end of the range witnessed prior to the onset of COVID. This is also confirmed by the addition of data from August 2024 and February 2025 data. Finally at the Small Ordinaries index level volatility remains low and at pre-COVID levels. The following chart highlights that the two significant spikes in index volatility were in 2008-2009 (Global Financial Crisis) and 2020-2021 (COVID). This is also confirmed by updating this data to the February 2025. Bottom-up NumbersThe updated analysis above suggests that the conclusion previously reached that the variability of earnings revisions has fallen. Share price reactions are at least in the expected direction given an upward or downward earnings revision and the overall volatility of the Small Ordinaries Index remains at low levels. Does it therefore follow that, as noted in the business press, that reporting seasons are now but a dull affair? In attempting to look at this further we have compared the variability of monthly stock returns with the dispersion of the intra-month share price high and low. The x-axis takes the individual stock return over the relevant month and calculates their variability. So, for example the variability of stock price returns in February 2020 was extreme. There was a very large spread of high and low returns that month. By comparison the variability of returns in February 2024 was lower and more in line with the upper end of the normal range. The reporting period with the lowest variability of monthly reporting season returns in our analysis was August 2021. So individual stock returns in the month of February 2024 were not outside historic ranges, However the story does not end there. The y-axis measure what happened within the month to individual stocks. This axis takes the intra-month high and low for an individual stock and measures the size of that dispersion. By contrast this was by far the highest recorded in our analysis. The evidence revealed by adding August 2024 and February 2025 is that overall stock return volatility has remained within a historic band (x-axis). The evidence around intra-month high and low share prices is less clear. The dispersion of high and low prices for individual stocks has remained above historic bands but the dispersion declined in August 2024 and again in February 2025. The outcome for February 2025 is still above the historic band but not significantly so.
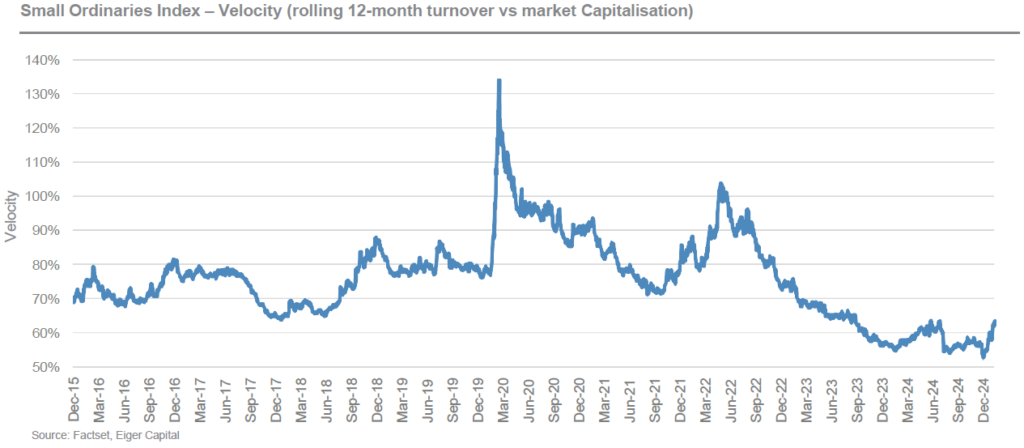
A couple of anecdotesWhile not the central thesis of this note, and perhaps delving into day-to-day stock movement, it seems interesting to highlight a couple of slightly absurd stock price movements during February to continue to highlight changes in market structure and behaviour. Audinate released its result on February 14 and the share price promptly increased 37% over the next few days. By March 7 the price was back to the mid-February starting point and by the end of March was 18% lower. So can we conclude that somebody (or something) decided the result was better than expected (hence the initial reaction and likely short covering) but that within a relative short period of time the reverse was likely. The result was in fact worse than expected hence the price fall of 40% from the peak. Our view is this is likely a combination of reduced liquidity and a series of decisions made by a something (not a someone). We would love a proponent of the efficient market hypothesis to explain this. Shifting to a slightly bigger stock than Audinate (which at $10 has a market capitalisation of around $800m) to one of the stocks noted for volatility in February 2024, namely Corporate Travel. Corporate Travel announced their interim result on February 18 and promptly the share price increased by 18% by February 21. By the end of March, the share price was down to $13.91 or 8% below the pre result price and 22% below the peak also on February 21. There may have been other news over this time period, but you would think the dominant news would have been the result. You would think it was either A: Better than expected or B: worse than expected. It turns out that as with Audinate there are decisions being made by somebody or something that mean that neither is the correct answer. The correct answer is C: it was both better and worse than expected. Go figure. Liquidity?In April 2025 as in April 2024 we have a view that there could be an overall decline in continuous disclosure. This is despite a steady increase in consensus data availability and a steady increase in the level of detail notably by the widespread use of Visible Alpha in the Australian market. This is backed up by noting that the size of EPS revisions and their immediate impact on share price reactions appears to have returned to pre COVID levels. Overall index volatility remains within normal levels and certainly nowhere near GFC or COVID levels. Overall monthly return volatility is also normal but intra-month volatility increased materially in February 2024 and has declined to still elevated levels over the subsequent levels. The following chart highlights the rolling 12-month liquidity of the small ordinaries index. Once again, we can see the significant spikes caused by COVID as portfolios were repositioned at the start and toward the end of the pandemic. What appears to be the case though is that the velocity of turnover relative to the size of the index is at or close to historic low levels. What could be the causes of this? One possible explanation is the lack of IPOs in the last few years. There is little doubt IPO's increase overall liquidity for a short period of time but in our experience, this normalises within a week at most. Takeover activity similarly briefly increases liquidity significantly on the day a bid is announced. There can also be significant periods of liquidity in a takeover as shares swap hands between long term investors and shorter-term takeover specialists as a takeover is finalised. The downside of a takeover is that ultimately it may reduce the size of an index leading to less opportunities for long term investors. We believe a factor worth considering is the impact of passive and near passive investment management. Global ETF's and index funds, that trade based on their own flows and not necessarily daily fundamental news flows, appear to own around 20% based on the information available in Factset. In addition to this investment, we believe there would be additional difficuly to quantify holdings by wholesale passive funds who manage money on behalf of institutional holders either internally or externally. There are also strategic holdings in some companies, notably those that are very long duration and infrastructure like that do not participate in market liquidity. Using the chart below the velocity of trading, if we exclude the COVID period, has fallen from around 70% to 56% at present. We do not think that it is implausible that the bulk of this decline is the accumulation of passive and near passive investment styles. This factor is likely to have impacted large cap indices earlier than small cap benchmarks as constantly rebalancing passive funds ironically is easier in more liquidity. In addition to reduced liquidity, that could be due to increased passive or other factors, we would note that we witness daily the impact of systematic investment managers. A systematic manager has a set style, often enhanced by algorithms that will trade with minimal human intervention. This style, well run forms a part of the broad church of management styles that make up a market.
Explaining the VibeWe believe that what the business reporters are witnessing isn't a breakdown in continuous disclosure but rather increased share price reactions to news based on the evolution of investment styles. Liquidity is currently at a low level and concurrently we believe that execution of large orders by systematic investors has become more aggressive. Will liquidity continue to structurally decline, and will short term volatility continue to increase? We aren't sure but either way it doesn't concern us as we plan to maintain a level of funds under management that will allow us the flexibility to execute our investment style. To some degree it may provide additional opportunities particularly if stocks continue to move aggressively and then rebound intra month. Author: Stephen Wood, Principal and Portfolio Manager 1. "Corporate Travel and Reece trip up traders in wild reporting season", Australian Financial Review, 3 March 2024. May require paid access to view full article. 2."What's to blame for corporate shocks this reporting season", The Australian, 8 March 2024. May require paid access to view full article. Funds operated by this manager: |

1 May 2025 - Performance Report: Insync Global Quality Equity Fund
[Current Manager Report if available]

1 May 2025 - What an ancient philosopher can teach us about coping with market volatility
|
What an ancient philosopher can teach us about coping with market volatility Janus Henderson Investors April 2025 Wealth Strategist Ben Rizzuto shares timeless teachings from Greek Stoic philosopher Epictetus that may help investors navigate market volatility and uncertainty.
Recent events and the volatility they have created may have you rethinking investing, rethinking your asset allocation, and rethinking how much volatility you can handle. While we're all eager to get the latest news and guidance on tariffs and market volatility, a philosopher who lived between c. 55 - 135 A.D. may be just the person to turn to right now. The Greek Stoic philosopher, Epictetus, shared ideas on how to live one's life, and these timeless teachings ideas may help investors navigate these volatile times. Overall, it's important to stay invested. And while this emotional rollercoaster may be hard to stomach at times, below are three ideas that may make it a bit easier and help provide some perspective. What do you control?
You don't control the markets. None of us do. They go up AND down and have done so for decades. Your experience over the past few days is an experience many have had over the years. So, if you can't control the markets, what can you control? Our reactions to these external forces are key in markets like this. Over the past several days, you may have felt despair, anger, and frustration, and those emotions can lead to untimely errors like selling investments at the wrong time. Remember, a longstanding investing rule is to buy low and sell high. If you give in to these emotions and sell now, you'll being doing the exact opposite. The wisdom of long-term perspective
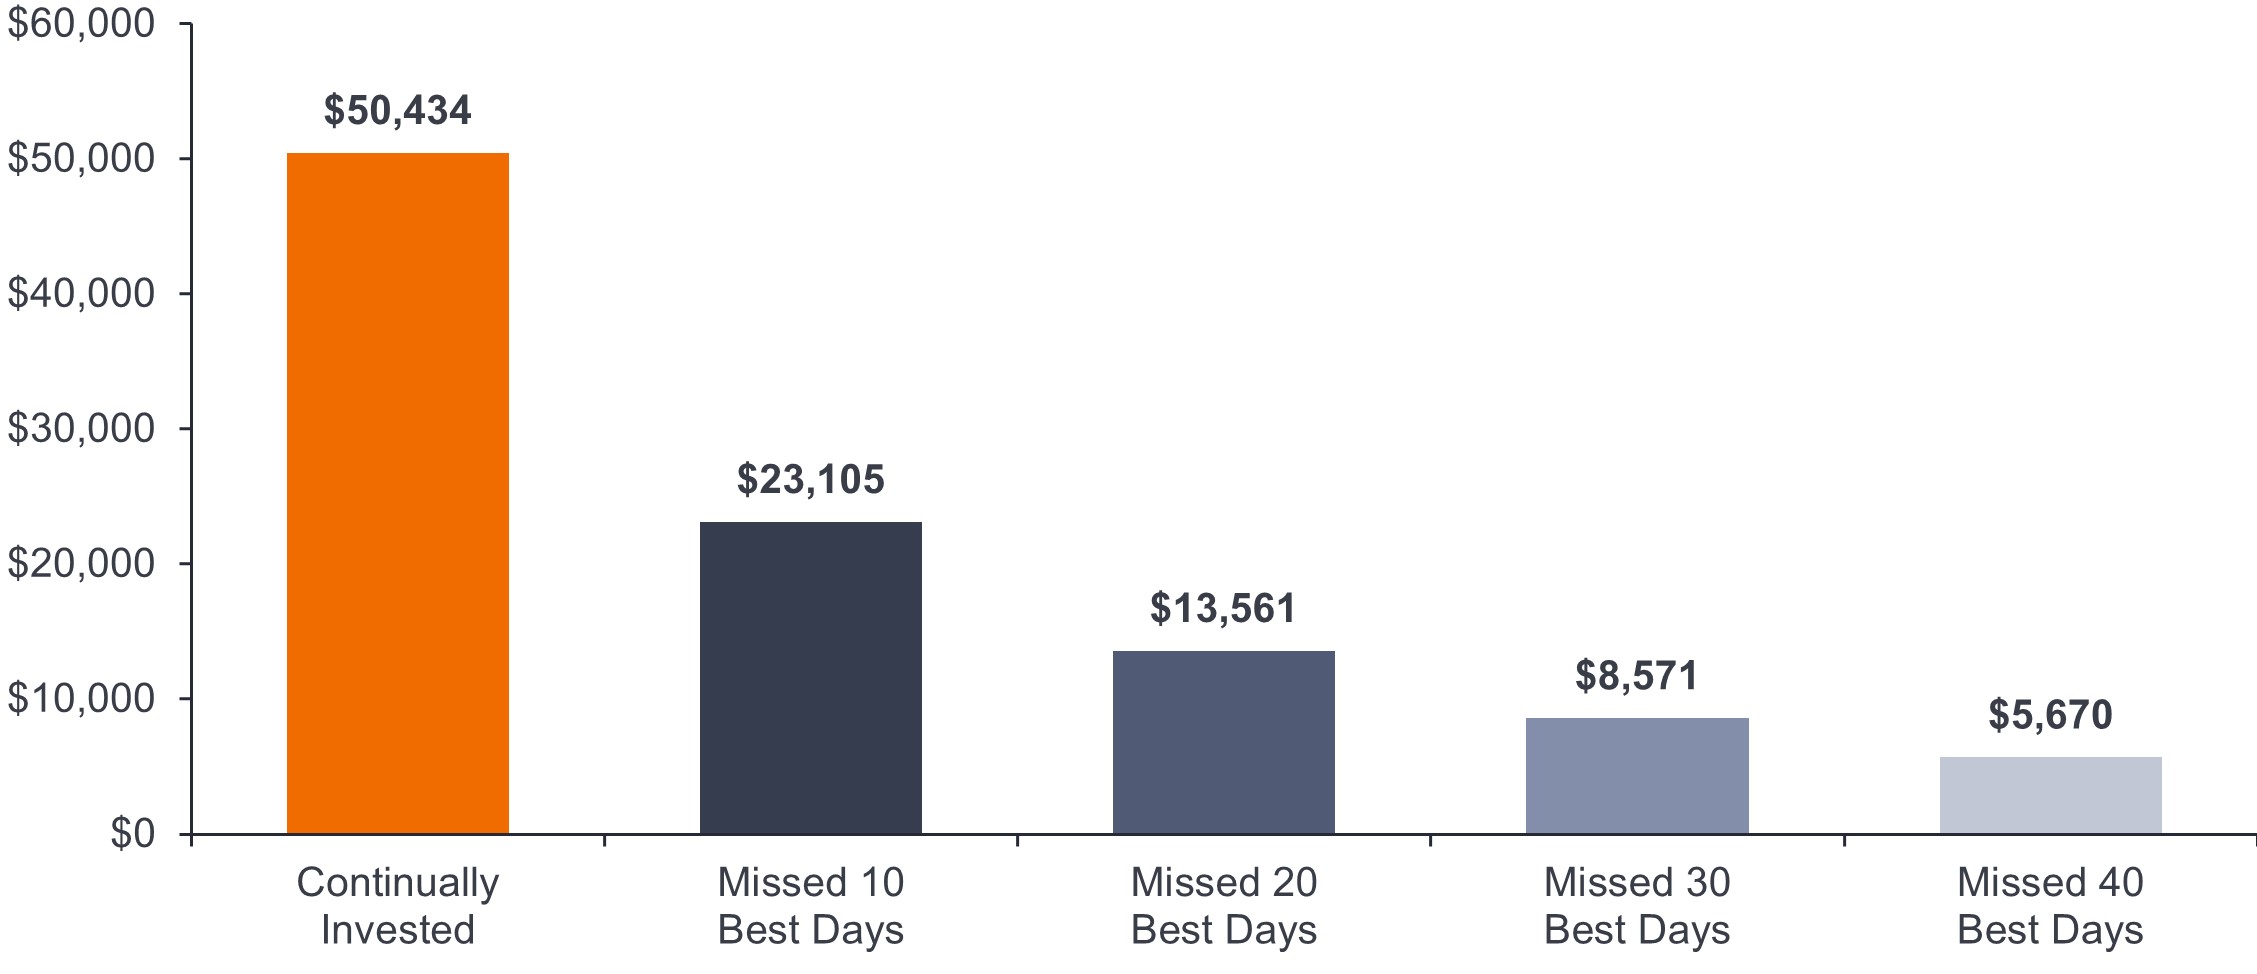
Unfortunately, for many investors, the emotions that are stirred during significant market shifts lead them to make drastic changes in their asset allocation. Loss aversion looms large during volatile markets; it demonstrates that we feel the pain of losses twice as much as the satisfaction we feel from gains. This pain may lead some people to move completely to cash, not only to limit losses, but also to gain a sense of control and security. But this is only a short-term fix: Once the markets return to normal, investors frequently fail to reallocate themselves appropriately and continue to be more conservative than they should be. As illustrated in the chart below, this leads many investors to miss out on gains when the market rebounds.
Source: FactSet Research Systems, Inc. from 1/1/99 - 12/31/24. The example provided is hypothetical and used for illustration purposes only. It does not represent the returns of any particular investment. The lesson is this: Your asset allocation will change over time. As you get closer to retirement, it will get more conservative, but this is a change that happens gradually over your lifetime and should not be based on short-term swings. The educated investor
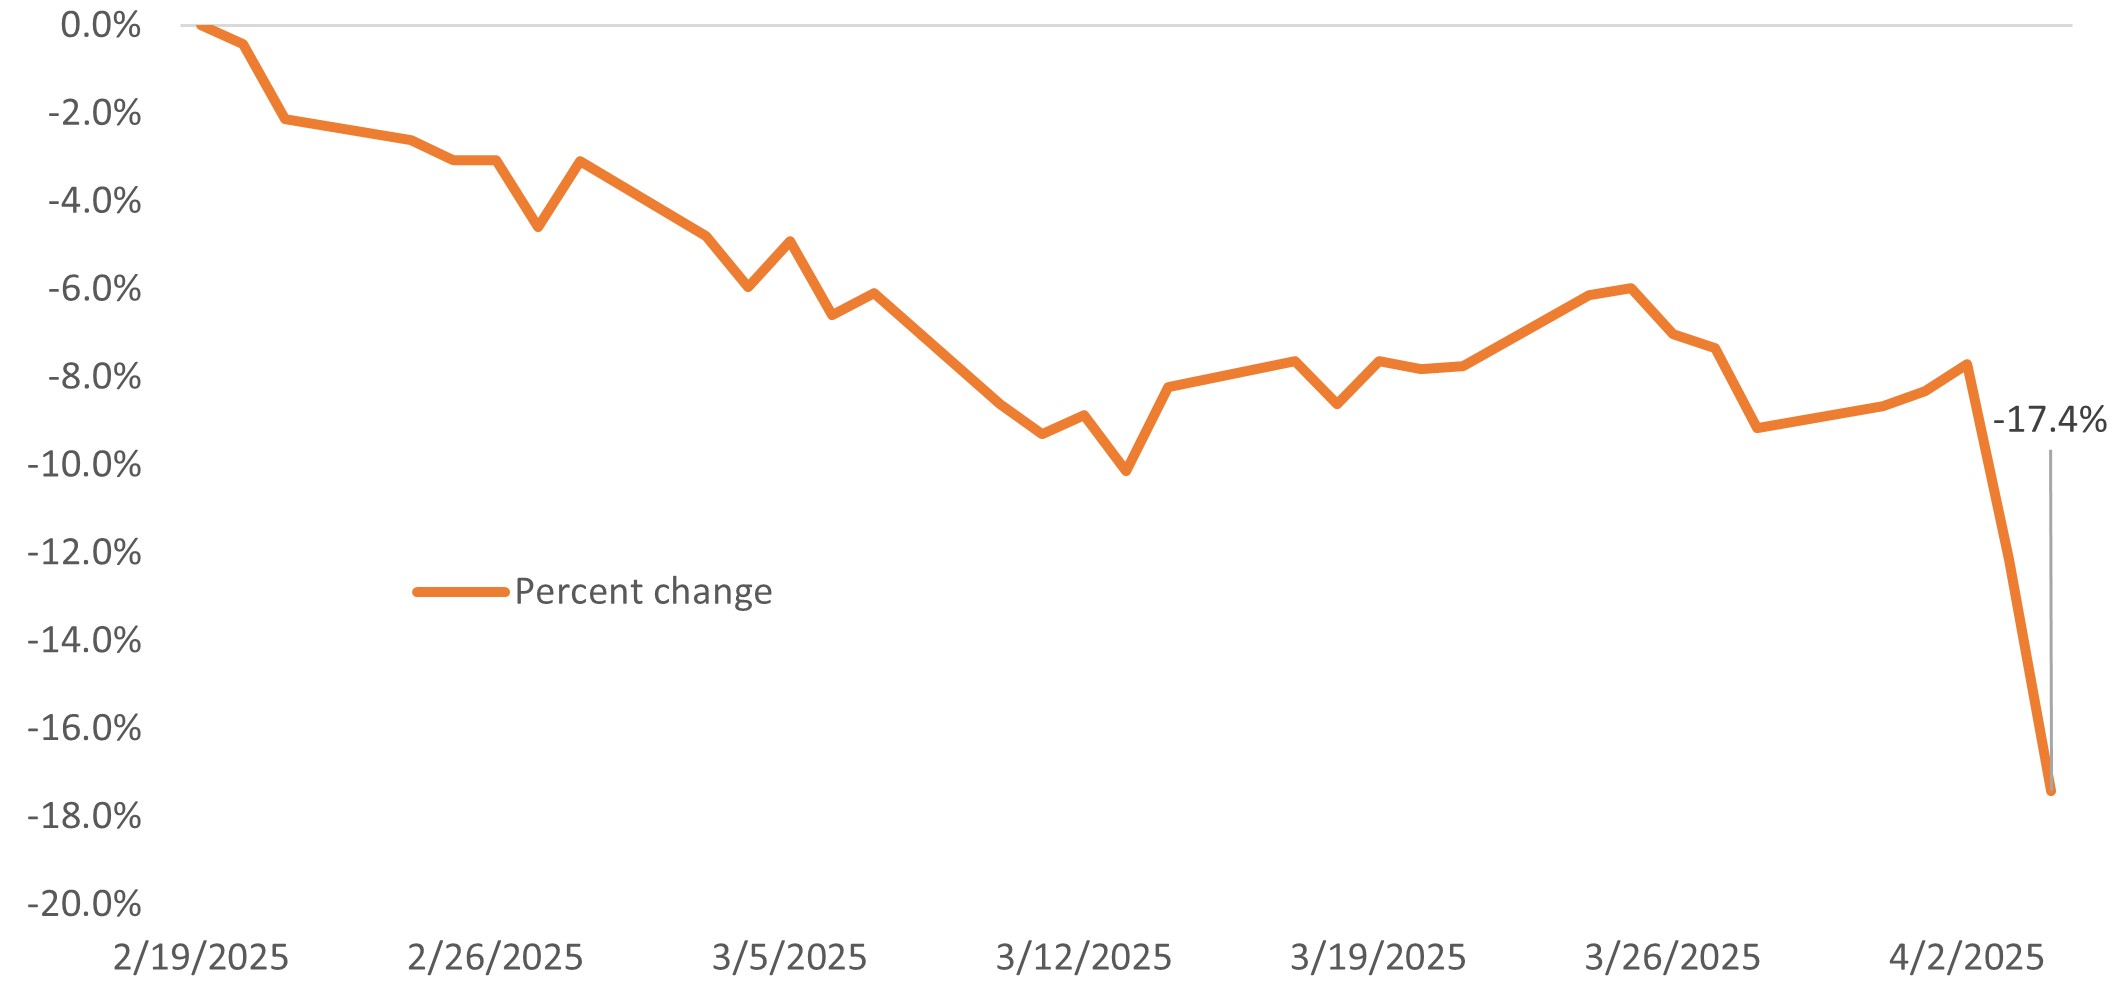
While you don't need to become a professional investor, it is important to be educated on the markets from a historical perspective. There have been several corrections and recessions over the years. A correction is defined as a decline of 10% or more from the recent peak. A recession often defined as when the gross domestic product (GDP) growth rate is negative for two consecutive quarters. And we've seen corrections and recessions in 1990, 2000, 2008, and 2020, as well as several other periods. But if you look at history, you can see that staying in the market over the long term has paid off. Viewing the performance of the market over a short period of time can look like this: S&P 500® Index, February 19, 2025 - April 4, 2025
Source: Federal Reserve Economic Data, fred.stlouisfed.org. As of April 4, 2025. The trend illustrated above looks like a losing proposition. But if we zoom out, we can see that this only a small piece of a larger - much more favorable - picture. $1 invested in S&P 500 Index since 1970 History has shown that many investors who have taken the long view and stayed invested have been rewarded in the end. If you look at several past recessions, they look like bumps in the road along the path of long-term growth. That's why it's so important not to let short-term emotions distract us from our long-term goals. In fact, during these times, it might be a good idea to turn off the TV, stop looking at the markets, and contemplate some philosophy. Definitions S&P 500® Index reflects U.S. large-cap equity performance and represents broad U.S. equity market performance. Volatility is the rate and extent at which the price of a portfolio, security or index, moves up and down. If the price swings up and down with large movements, it has high volatility. If the price moves more slowly and to a lesser extent, it has lower volatility. The higher the volatility the higher the risk of the investment. |
|
Funds operated by this manager: Janus Henderson Australian Fixed Interest Fund, Janus Henderson Australian Fixed Interest Fund - Institutional, Janus Henderson Cash Fund - Institutional, Janus Henderson Conservative Fixed Interest Fund, Janus Henderson Conservative Fixed Interest Fund - Institutional, Janus Henderson Diversified Credit Fund, Janus Henderson Global Equity Income Fund, Janus Henderson Global Multi-Strategy Fund, Janus Henderson Global Natural Resources Fund, Janus Henderson Tactical Income Fund All opinions and estimates in this information are subject to change without notice and are the views of the author at the time of publication. Janus Henderson is not under any obligation to update this information to the extent that it is or becomes out of date or incorrect. The information herein shall not in any way constitute advice or an invitation to invest. It is solely for information purposes and subject to change without notice. This information does not purport to be a comprehensive statement or description of any markets or securities referred to within. Any references to individual securities do not constitute a securities recommendation. Past performance is not indicative of future performance. The value of an investment and the income from it can fall as well as rise and you may not get back the amount originally invested. Whilst Janus Henderson believe that the information is correct at the date of publication, no warranty or representation is given to this effect and no responsibility can be accepted by Janus Henderson to any end users for any action taken on the basis of this information. |

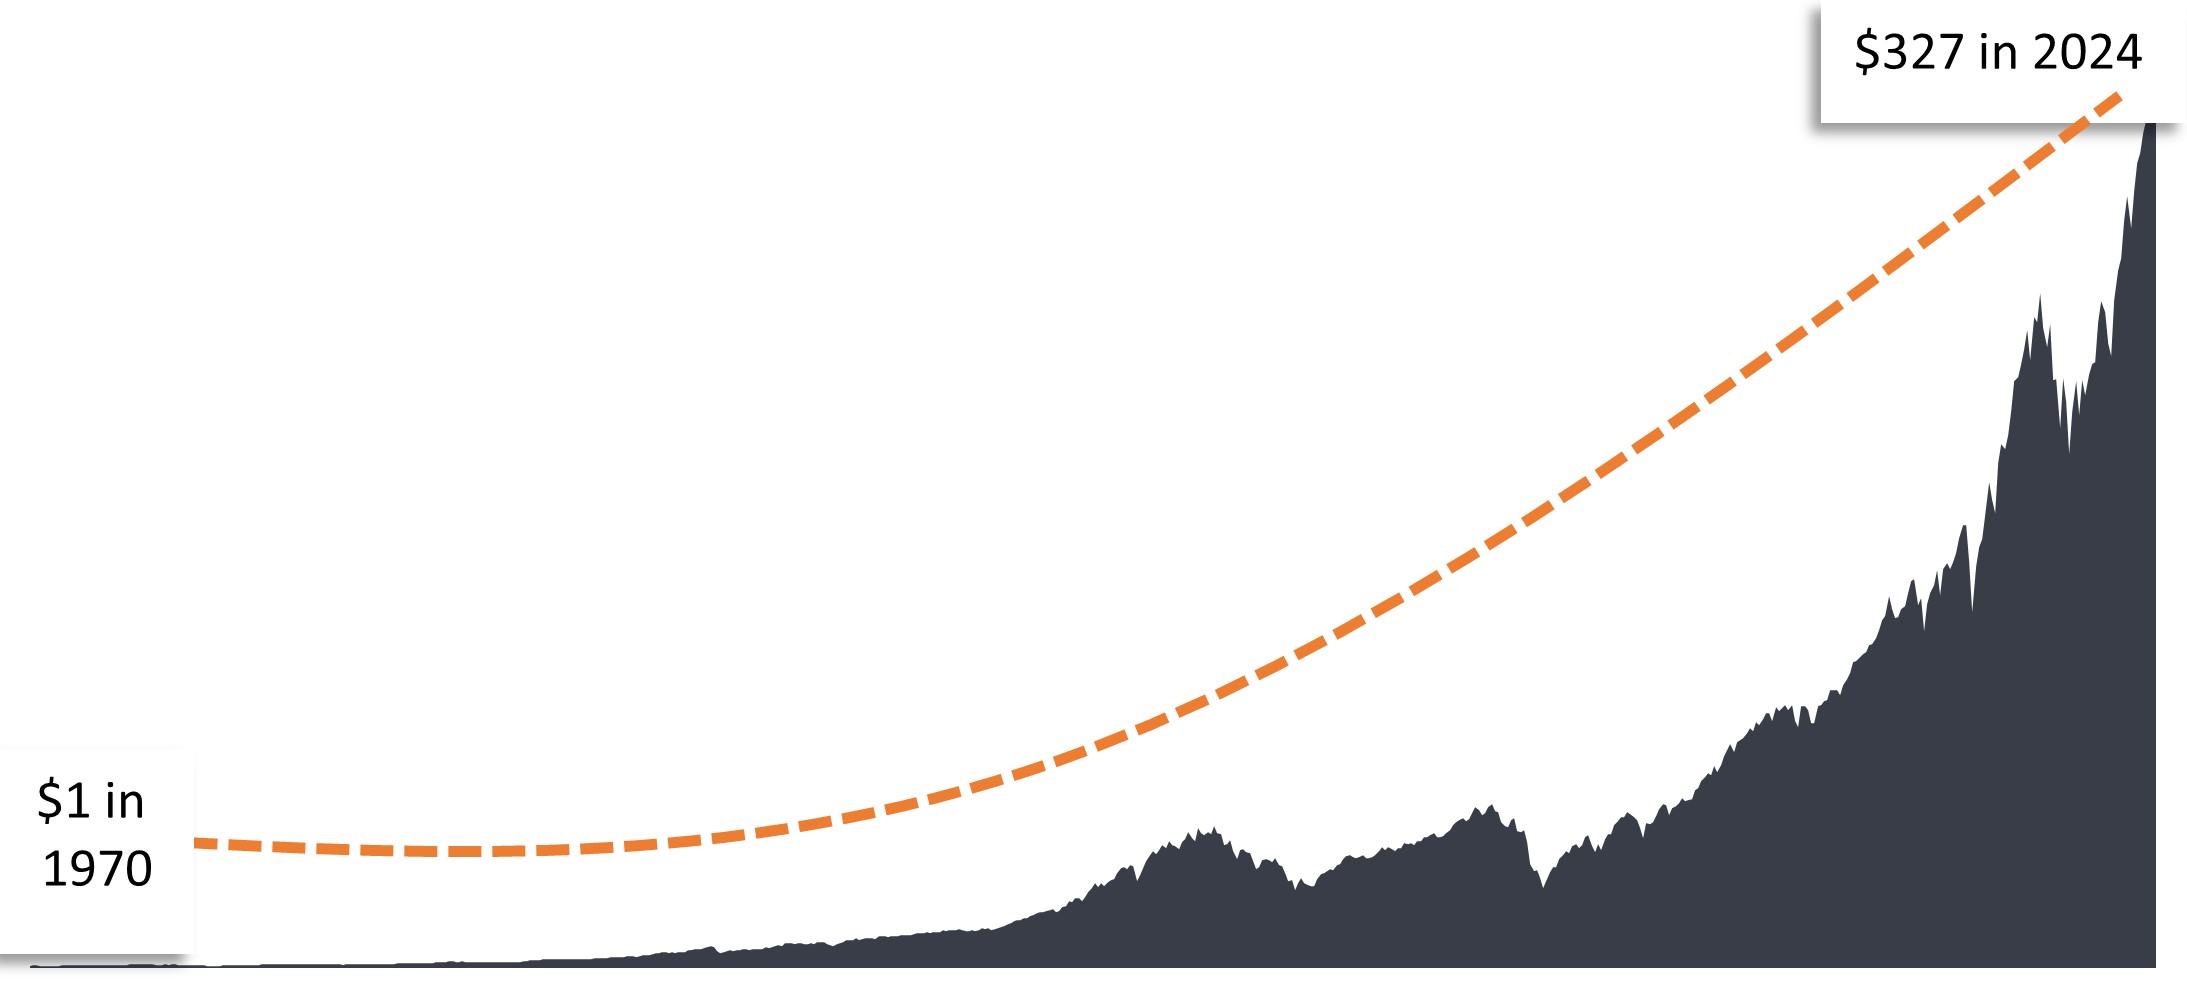 Source: Lipper, 12/31/69 - 12/31/24. U.S. Equity Market represented by the S&P 500 Index. Past performance is no guarantee of future results. Data reflects S&P 500 Total Return Index, which assumes dividend reinvestment. Index performance does not reflect the expenses of managing a portfolio as an index is unmanaged and not available for direct investment.
30 Apr 2025 - Performance Report: DAFM Digital Income Fund (Digital Income Class)
[Current Manager Report if available]

30 Apr 2025 - Manager Insights | East Coast Capital Management
|
Chris Gosselin, CEO of FundMonitors.com, speaks with Richard Brennan, Strategy Ambassador at East Coast Capital Management. They discussed the challenges and opportunities faced by trend following strategies during a volatile first quarter, the role of diversification across asset classes and geographies, and East Coast Capital's strong long-term performance, including the importance of dynamically adjusting portfolios to shifting market regimes. The ECCM Systematic Trend Fund has a track record of 5 years and 3 months and has outperformed the SG Trend benchmark since inception in January 2020, providing investors with an annualised return of 14.7% compared with the benchmark's return of 6.38% over the same period.
|