NEWS

22 Dec 2022 - Investment Perspectives: The yield curve, recessions and soft landings

22 Dec 2022 - Why the cloud investment opportunity will outlast an economic downturn
|
Why the cloud investment opportunity will outlast an economic downturn Magellan Asset Management November 2022 |
|
The global shift to cloud computing is a seismic and transformational trend that we have backed for several years at Magellan. For the hyperscale public cloud vendors outside China - Amazon, Microsoft, and Google (the Magellan Global Fund holds all three companies) - it has created unprecedented market opportunity. These vendors have consistently generated strong double-digit revenue growth at scale and continue to do so to this day. Yet in the most recent two financial quarters, hyperscale cloud revenue has faced decelerating growth as enterprise customers reign in spend amid the uncertain macroeconomic backdrop. Has the story come to an end?
The trend this year is apparent. Excluding the impact of currency movements, hyperscale cloud revenue grew in aggregate 42% year-over-year in Q1. In Q2, the growth rate fell to 38%, and in the most recent Q3, the growth fell further to 34%. The two largest vendors, Amazon and Microsoft, expect this deceleration to continue, which means we should expect the growth rate to decline even more in Q4. On top of that, margins are falling, with both companies dealing with rising energy costs in their data centres while continuing to maintain their pace of double-digit operating expense growth. All of this may seem dire but let us unpack it further. We start by recognising that the deceleration this year appears more severe because it is being compared to several quarters of strong growth in 2021 due to cloud demand created by the pandemic responses. To try to adjust for this by looking at this year's quarterly growth rates on a 2-year annualised basis, we see a steadier growth trend, albeit one that is still slowing - from 40% in Q1, to 39% in Q2, to 38% in Q3. (The fact that we are seeing this type of growth on an aggregate US$160 billion in annualised revenue is staggering on its own). These decreases are more marginal and subject to noise, but there is broader evidence that IT spend is generally tightening. The unfavourability of these recent IT spending trends are, we believe, cyclical not structural. Market uncertainty has compelled enterprise customers to become more prudent or selective about their IT investments. Some customers are in industries facing challenges of their own such as supply chain issues, inflation, or labour shortages. We also expect some spend was driven by the period of excessive cheap, available money and this spend will not return. And as their customers seek to tighten their belts, hyperscale cloud vendors are taking it a step further and in fact helping customers to improve the efficiency of their spend (e.g., through lower priced options). In other words, the cloud vendors are effectively contributing to their own growth headwinds. Why do this? It is about driving trusted partnerships with customers for long term growth, rather than short-sightedly focusing on maximising growth today. This makes sense if one believes, as we do, that cloud has a significant multi-year growth runway ahead. In fact, the ability for customers to proactively dial up and down cloud spend according to their needs - rather than being burdened with the large, fixed costs of an on-premises data centre when times are tough - is one of the fundamental value propositions of the cloud, and the current environment reinforces this validity. Put another way, hyperscale cloud is doing exactly what it was meant to do. The effect of rising energy costs on the hyperscale cloud vendors has been negative but comparably modest so far. Amazon cited a 200bps impact to AWS margins in aggregate over two years, and for Microsoft we expect an impact of less than 100bps to its cloud margins this financial year, unless costs rise significantly higher. The cloud vendors are absorbing these higher costs in the near term, but we believe they possess the pricing power to share rising costs with customers over the longer term. An underappreciated point is that the energy efficiency of hyperscale data centres is far superior to what customers can achieve on their own, which is further demonstrating to these customers the advantages of being in the cloud. Cloud computing is proving its value to customers as much in this environment as it ever has, and we can see this when we delve beyond the quarterly headlines. It is why we continue to view this investment opportunity as compelling on the longer time horizon. It is an attractive, enduring, and multi-year opportunity that will deliver robust growth and attractive margins on the other side of the economic cycle we find ourselves in today. Author: Adrian Lu, Investment Analyst Sources: Company filings and Magellan estimates |
|
Funds operated by this manager: Magellan Global Fund (Hedged), Magellan Global Fund (Open Class Units) ASX:MGOC, Magellan High Conviction Fund, Magellan Infrastructure Fund, Magellan Infrastructure Fund (Unhedged), MFG Core Infrastructure Fund Important Information: This material has been delivered to you by Magellan Asset Management Limited ABN 31 120 593 946 AFS Licence No. 304 301 ('Magellan') and has been prepared for general information purposes only and must not be construed as investment advice or as an investment recommendation. This material does not take into account your investment objectives, financial situation or particular needs. This material does not constitute an offer or inducement to engage in an investment activity nor does it form part of any offer documentation, offer or invitation to purchase, sell or subscribe for interests in any type of investment product or service. You should read and consider any relevant offer documentation applicable to any investment product or service and consider obtaining professional investment advice tailored to your specific circumstances before making any investment decision. A copy of the relevant PDS relating to a Magellan financial product or service may be obtained by calling +61 2 9235 4888 or by visiting www.magellangroup.com.au. Past performance is not necessarily indicative of future results and no person guarantees the future performance of any strategy, the amount or timing of any return from it, that asset allocations will be met, that it will be able to be implemented and its investment strategy or that its investment objectives will be achieved. This material may contain 'forward-looking statements'. Actual events or results or the actual performance of a Magellan financial product or service may differ materially from those reflected or contemplated in such forward-looking statements. This material may include data, research and other information from third party sources. Magellan makes no guarantee that such information is accurate, complete or timely and does not provide any warranties regarding results obtained from its use. This information is subject to change at any time and no person has any responsibility to update any of the information provided in this material. Statements contained in this material that are not historical facts are based on current expectations, estimates, projections, opinions and beliefs of Magellan. Such statements involve known and unknown risks, uncertainties and other factors, and undue reliance should not be placed thereon. Any trademarks, logos, and service marks contained herein may be the registered and unregistered trademarks of their respective owners. This material and the information contained within it may not be reproduced, or disclosed, in whole or in part, without the prior written consent of Magellan. |

21 Dec 2022 - RBA likely to move to quarterly tightening in 2023
|
RBA likely to move to quarterly tightening in 2023 Pendal December 2022 |
|
THIS week's 25-point rate rise probably won't be the last — but the Reserve Bank's pace of tightening is likely to move from monthly to quarterly increments next year. The cash rate will now sit at 3.1% for the summer. The RBA's next monetary policy statement is due on February 10. Between now and then we will see fourth quarter inflation data released on January 25. It will be high. The annual headline inflation rate will be around 8% for 2022. This will set the case for another hike in February. Tuesday's RBA statement contained nothing new. The central bank remains data dependent while the global outlook has deteriorated. Domestically the labour market remains tight. Economic growth has been strong and household spending will start to slow due to policy tightening delivered so far. For some this is yet to occur, given the higher-than-usual number of fixed-rate mortgages that are yet to reset. This is the reason why the RBA doesn't need to be as aggressive. Fixed-rate mortgages at rates around 2% will be resetting closer to 5.5% mid next year. The RBA acknowledges they are walking a tight rope. "The path to achieving the needed decline in inflation and achieving a soft landing for the economy remains a narrow one." The further they push policy, the harder the landing becomes. The RBA doesn't want to cause a recession. But given a choice of embedded higher-inflation expectations or better growth, the former wins out for any central banker. The longer-term task is no simpler. Policy action to date "has been necessary to ensure that the current period of high inflation is only temporary", the RBA statement said. "High inflation damages our economy and makes life more difficult for people." In a speech late last month RBA governor Phil Lowe pointed out that variability in inflation outcomes was more likely to increase than what we've become accustomed to. He cited four key areas where supply issues in the longer term will occur:
The RBA has under-shot or over-shot its 2-3% target band more often than not over the past 15 years. More variability in inflation outcomes? Who would want to be a central banker. Central banks have tightened policy significantly over 2022 — and that will weigh on demand over 2023. The current Christmas spendathon — where we are let loose for the first Christmas in three years — will hold activity up for now. But it's unlikely continue into the new year hangover. The supply side of the global economy is also likely to see capacity increase and downward inflationary pressure next year. The supply issues that have resulted from the pandemic and Russia's invasion of Ukraine will resolve over time. But with it comes another set of challenges. And those are more likely to be skewed towards higher inflationary pressure in the longer term. Author: Steve Campbell, Head of Cash Strategies |
|
Funds operated by this manager: Pendal Focus Australian Share Fund, Pendal Global Select Fund - Class R, Pendal Horizon Sustainable Australian Share Fund, Pendal MicroCap Opportunities Fund, Pendal Sustainable Australian Fixed Interest Fund - Class R, Regnan Global Equity Impact Solutions Fund - Class R, Regnan Credit Impact Trust Fund |
|
This information has been prepared by Pendal Fund Services Limited (PFSL) ABN 13 161 249 332, AFSL No 431426 and is current as at December 8, 2021. PFSL is the responsible entity and issuer of units in the Pendal Multi-Asset Target Return Fund (Fund) ARSN: 623 987 968. A product disclosure statement (PDS) is available for the Fund and can be obtained by calling 1300 346 821 or visiting www.pendalgroup.com. The Target Market Determination (TMD) for the Fund is available at www.pendalgroup.com/ddo. You should obtain and consider the PDS and the TMD before deciding whether to acquire, continue to hold or dispose of units in the Fund. An investment in the Fund or any of the funds referred to in this web page is subject to investment risk, including possible delays in repayment of withdrawal proceeds and loss of income and principal invested. This information is for general purposes only, should not be considered as a comprehensive statement on any matter and should not be relied upon as such. It has been prepared without taking into account any recipient's personal objectives, financial situation or needs. Because of this, recipients should, before acting on this information, consider its appropriateness having regard to their individual objectives, financial situation and needs. This information is not to be regarded as a securities recommendation. The information may contain material provided by third parties, is given in good faith and has been derived from sources believed to be accurate as at its issue date. While such material is published with necessary permission, and while all reasonable care has been taken to ensure that the information is complete and correct, to the maximum extent permitted by law neither PFSL nor any company in the Pendal group accepts any responsibility or liability for the accuracy or completeness of this information. Performance figures are calculated in accordance with the Financial Services Council (FSC) standards. Performance data (post-fee) assumes reinvestment of distributions and is calculated using exit prices, net of management costs. Performance data (pre-fee) is calculated by adding back management costs to the post-fee performance. Past performance is not a reliable indicator of future performance. Any projections are predictive only and should not be relied upon when making an investment decision or recommendation. Whilst we have used every effort to ensure that the assumptions on which the projections are based are reasonable, the projections may be based on incorrect assumptions or may not take into account known or unknown risks and uncertainties. The actual results may differ materially from these projections. For more information, please call Customer Relations on 1300 346 821 8am to 6pm (Sydney time) or visit our website www.pendalgroup.com |

20 Dec 2022 - The Rate Debate - 2023 predictions on the economy, inflation, and the fixed-rate mortgage cliff
|
The Rate Debate - Episode 34 2023 predictions on the economy, inflation, and the fixed-rate mortgage cliff Yarra Capital Management December 2022 The RBA delivered an eighth-straight rate hike to hit a 10-year high to round out a tumultuous 2022. Speakers: Darren Langer and Chris Rands, seasoned fixed-income specialists |
|
Funds operated by this manager: Yarra Australian Equities Fund, Yarra Emerging Leaders Fund, Yarra Enhanced Income Fund, Yarra Income Plus Fund |

19 Dec 2022 - Managers Insights | Glenmore Asset Management
|
|
||
|
Damen Purcell, COO of FundMonitors.com, speaks with Robert Gregory, Founder and Portfolio Manager at Glenmore Asset Management. The Glenmore Australian Equities Fund has a track record of 5 years and 6 months and has outperformed the ASX 200 Total Return benchmark since inception in June 2017, providing investors with an annualised return of 21.78% compared with the benchmark's return of 8.69% over the same period.
|

19 Dec 2022 - Trip Insights: United States

16 Dec 2022 - Insights from abroad
|
Insights from abroad WaveStone Capital October 2022 WaveStone Capital's Henry Hill and Kirsty Mackay-Fisher travelled to the Northern Hemisphere, visiting a large number of companies and gaining insights on the impacts of inflation and a slowing consumer. Hear their insights and observations of the outlook for the Australian share market. |
|
Funds operated by this manager: WaveStone Australian Share Fund, WaveStone Capital Absolute Return Fund, WaveStone Dynamic Australian Equity Fund |

15 Dec 2022 - Carbon Regulation Review
|
Carbon Regulation Review Tyndall Asset Management November 2022 Climate regulation in Australia While Australia is in line with other regions in its commitment to the Paris Agreement, in other areas Australia either lags or has less onerous requirements. While the industrial mix in Australia is markedly different from those other regions, rising political pressure will likely lead to moves by the government to close the gap. A timeline of Australian climate regulation Nov 2014 Australia's primary emission reduction policy came into force via the Carbon Farming Initiative Amendment Bill 2014, which established the Emissions Reduction Fund (ERF). The ERF is a voluntary scheme that aims to provide incentives for a range of organisations and individuals to adopt new practices and technologies to reduce their emissions. It offers Australian carbon credit units (ACCUs) to eligible activities, with one ACCU earned for each tonne of carbon dioxide equivalent (tCO2-e) stored or avoided. ACCUs can be sold to generate income, either to the government through a carbon abatement contract, or in the secondary market. This legislation followed the July 2014 repeal of the Carbon Price Mechanism. Eight 'carbon tax repeal' bills were passed by the Senate, making Australia the world's first nation to reverse action on climate change. May 2015 The Renewable Energy (Electricity) Amendment Bill 2015 came into effect. This bill reduced the large-scale Renewable Energy Target from 41,000 GWh to 33,000 GWh of additional renewable electricity generation by 2020 (or 23.5% of the estimated electricity generation for 2020), with this level to be maintained until 2030 once achieved. Aug 2015 Post-2020 emission reduction targets were announced: to reduce greenhouse gas emissions by 26-28% below 2005 levels by 2030. Sep 2015 The 2030 Agenda for Sustainable Development was adopted by all United Nations Member States. i.e. the 17 Sustainable Development Goals (SDGs). Oct 2015 The government announced a temperature commitment to keep global warming to 2 degrees Celsius compared to pre-industrial levels. Dec 2015 The government announced a target of net zero emissions by 2100. Apr 2016 Australia signs the Paris Agreement, a legally binding international treaty on climate change to limit global warming to well below 2 degrees Celsius compared to pre-industrial levels (but preferably to 1.5 degrees). The 194 signatory countries aim to reach global peaking of greenhouse gas emissions as soon as possible to achieve climate-neutrality by mid-century. Jul 2016 The safeguard mechanism, part of the ERF, came into effect. This mechanism placed a legislated obligation on Australia's largest greenhouse gas emitters to keep net emissions below their emissions limit (or baseline). The safeguard mechanism operates under the framework of the National Greenhouse and Energy Reporting Scheme and applies to facilities with direct scope 1 emissions of more than 100,000 tonnes of carbon dioxide equivalent (tCO2-e) per annum. It mostly impacts mining, oil and gas extractors, manufacturers, electricity generators and the waste industry, covering approximately half of Australia's emissions. Safeguard facilities will be able to surrender ACCUs to offset emissions over their baseline. Nov 2016 The Paris Agreement became effective and was ratified in Australia. Feb 2019 The ERF is rebadged as the Climate Solutions Fund, as part of the 'Climate Solutions Package'. This package provides an additional $2 billion over 15 years for carbon abatement programs, using the same process as the ERF. Mar 2019 The safeguard mechanism is amended. Among other changes, the amendments simplify the process of allowing facilities to increase emissions in line with production. Oct 2021 The Australian government commits to Net Zero emissions by 2050. Jun 2022 The greenhouse gas emissions target for 2030 is increased from a 26-28% reduction to a 43% reduction (from 2005 levels). Global comparisons of emissions targets In the US, the target to reduce emissions by 26-28% by 2025 from 2005 levels was announced in Mar 2015. This appears to have influenced the Australian target, which was for an identical reduction but with a later (2030) target date. Comparison of carbon markets The Australian carbon credits scheme is voluntary, with demand driven by a corporate's own emission reduction targets. In the UK and the EU, a "cap and trade" system is used, whereby there is an absolute limit on greenhouse gas emissions for entities covered by the system. This cap is reduced over time to reduce total emissions. Within the system, carbon credits can be traded, allowing emissions reduction to be achieved by the lowest-cost alternative. Reporting requirements In Australia, Task Force on Climate-Related Financial Disclosures (TCFD) reporting is presently not mandatory. However, Chris Bowen (Minister for Industry, Energy and Emissions Reduction of Australia) recently confirmed that climate reporting would become mandatory. Although further details have not yet been provided, since reporting requirements in other regions are higher, it is expected that reporting requirements in Australia will increase over time, including a requirement to report scope 3 emissions. How is Tyndall responding? We expect the Labour government to increase regulation given Australia appears to lag behind global peers. The questions we are asking corporates are:
The responses to these questions, amongst others, enable us to better assess long-term cashflows and assess the risks to these cashflows under different scenarios. Author: Craig Young, Senior Research Analyst Funds operated by this manager: Tyndall Australian Share Concentrated Fund, Tyndall Australian Share Income Fund, Tyndall Australian Share Wholesale Fund Important information: This material was prepared and is issued by Yarra Capital Management Limited (formerly Nikko AM Limited) ABN 99 003 376 252 AFSL No: 237563 (YCML). The information contained in this material is of a general nature only and does not constitute personal advice, nor does it constitute an offer of any financial product. It does not take into account the objectives, financial situation or needs of any individual. For this reason, you should, before acting on this material, consider the appropriateness of the material, having regard to your objectives, financial situation, and needs. The information in this material has been prepared from what is considered to be reliable information, but the accuracy and integrity of the information is not guaranteed. Figures, charts, opinions and other data, including statistics, in this material are current as at the date of publication, unless stated otherwise. The graphs and figures contained in this material include either past or backdated data, and make no promise of future investment returns. Past performance is not an indicator of future performance. Any economic or market forecasts are not guaranteed. Any references to particular securities or sectors are for illustrative purposes only and are as at the date of publication of this material. This is not a recommendation in relation to any named securities or sectors and no warranty or guarantee is provided. |

14 Dec 2022 - Net Zero Megatrend
|
Net Zero Megatrend Insync Fund Managers November 2022 We view Energy Transition to be among the most important megatrends affecting the investment landscape. Hydrogen is viewed as a key component of the world's quest to reach 'net zero' and avoid the worst of climate change. Hydrogen demand projections call for a 10-20x increase vs current volumes. This requires trillions of dollars of investment. Green hydrogen is produced with renewable power such as wind and solar, enabling the full life cycle of hydrogen production and consumption to be carbon free. It is one thing to identify a great megatrend but it's another thing altogether to then match this with one or more quality companies that also possess sustainable earnings growth and a superior ROIC. There are many unprofitable companies participating in the Energy Transition megatrend but we consider these to be of a more speculative nature. Our research identified industrial gas companies to be strongly positioned as they are very profitable businesses and have unique domain expertise in hydrogen and CCUS technology (Carbon Capture, Usage and Storage). The Industrial Gas market has undergone significant consolidation in the last 20 years, comprising just 3 global majors: Linde, Air Liquide and Air Products. As a result of the oligopoly style industry structure, they have delivered steady sustainable volume growth over time with consistent pricing gains. Population, GDP and industrialization of middle income markets provide a solid basis for future growth.
Funds operated by this manager: Insync Global Capital Aware Fund, Insync Global Quality Equity Fund Disclaimer |

13 Dec 2022 - The energy development opportunity for European offshore wind
|
The energy development opportunity for European offshore wind 4D Infrastructure November 2022
European policy supports the energy transition The move towards net zero is supported by strong policy in Europe, including the:
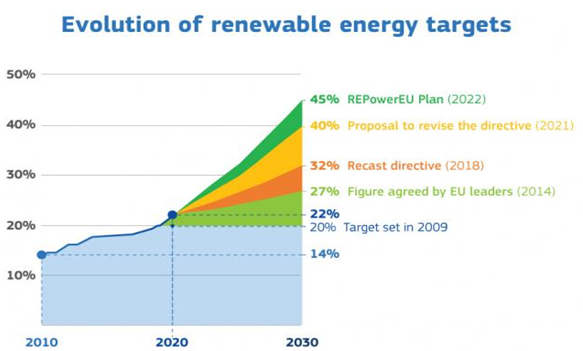
With the ultimate goal of achieving climate neutrality by 2050, the EU unveiled the EGD[i] in December 2019. This general action plan included policy initiatives aimed at starting the green transition and unlocking €1 trillion of investment[ii]. This was soon followed by Fit for 55 in July 2021, a package of policy recommendations (pricing, taxation, standards, support measures) geared at the EGD's implementation with the overarching aim to cut greenhouse gas (GHG) emissions by at least 55% by 2030[iii]. Together, the EGD and Fit for 55 guidelines are aimed at generating 40%[iv] of the EU's electricity from renewable sources by 2030, up from 32% in the 2018 directive[v]. In response to the Russia / Ukraine crisis, the European Commission released the REPowerEU plan in May 2022[iv], which outlines a series of steps to quickly decrease the EU's reliance on Russian fossil fuels by accelerating the transition to clean energy. It suggests raising the EU's 2030 renewable energy targets from 40% to 45%, and places renewables at the centre of Europe's energy security plan'[v]. Similarly, the UK released their Energy Security Strategy in April 2022, which also increased several renewable targets to increase energy independence and accelerate the pathway to net zero.
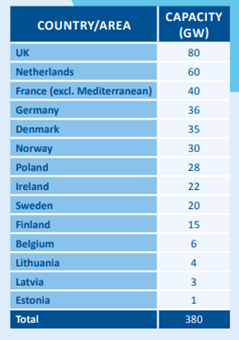
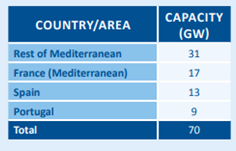
Source: Renewable energy targets (europa.eu)v The European offshore wind market is expected to grow significantly to meet net zeroIn its dedicated strategy on offshore renewables, the EU targeted 60 gigawatts (GW) of offshore wind capacity by 2030 and 300 GW by 2050 compared to 20 GW at the end of 2020[vi]. With REPowerEU, WindEurope[vii] estimates that 510 GW of new wind capacity (both offshore and onshore) will need to be developed by 2030, up from 190 GW today - equating to 39 GW per year new build (only 11 GW was built in 2021 and 18 GW estimated for 2022). While the REPowerEU didn't directly increase offshore capacity targets, there is nevertheless a strong focus on quicker renewables deployment to support the sector through faster permitting, improving supply chain bottlenecks and improved planning among member states. Meanwhile, the UK directly increased their offshore wind targets from 40 to 50 GW by 2030, alongside acceleration of other low/no carbon technologies such as nuclear, solar and clean hydrogen[viii]. Industry leader, Orsted, notes that just meeting Europe's targets will require doubling the: "build-out rate of 3-4 GW offshore wind per year to 8 GW per year by 2030, and a further increase to 20 GW per year from 2036"[vi]. Quality wind resources support European offshore wind developmentEurope (including the UK) benefits from some of the best areas in the world for offshore wind. It's supported by great wind resource - with relatively strong and consistent wind speeds, as well as shallow water and calmer sea states - which makes it easier to develop sites closer to shore. Also, much of Northern Europe is disadvantaged by a relative lack of sunshine, which gives relative support to wind power. The tables below present WindEurope's estimated deployment by 2050 of 450 GW offshore wind capacity across European countries, and highlights the strong potential of Northern Europe.
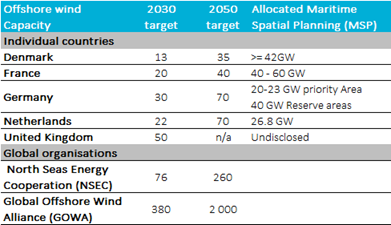
Source: WindEurope Our Energy Our Futureix Maritime spatial planning (MSP) highlights the potential for further offshore wind growthAllocation of seabed is the first step in offshore wind development. According to a 2022 study by WindEurope[x], EU member states allocated approximately 52,000 sq.km for offshore wind development through their respective MSPs. This is equivalent to more than 220 GW of capacity, and exceeds existing 2030 targets in major offshore European markets. While not all of these sites will be allocated to developers, and even less will make it to final investment decision, the numbers highlight the potential for further industry growth.
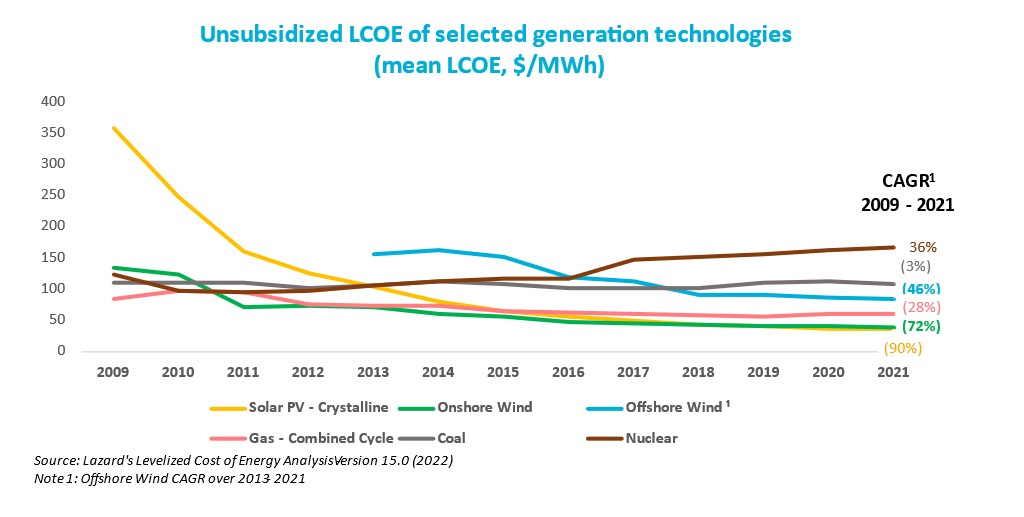
Offshore wind is now competitiveOver the last decade, offshore wind has evolved from a niche technology to a mainstream one, thanks to a sharp decline in the costs associated with installation and operation. According to Lazard's latest unsubsidized levelized cost of energy analysis ('LCOE')[xix], offshore wind technology is now more economic than legacy power sources of coal and nuclear. This cost trend is expected to continue, albeit at a slower rate, largely driven by scale and ongoing technological advancements.
Utilities and pureplay developers are strongly leveraged to offshore wind growthIt's estimated that expanding offshore renewable energy will require investment north of US$1 trillion in the next decade. This will be funded predominantly by private capital to not only build increasingly larger new wind farms at sea, but also scale up nascent technology like floating turbines[xx]. The scale of the opportunity is reflected in the development pipelines of most of Europe's renewable leaders (most of whom are in 4D's investment universe), which are expected to see significant capacity expansion over the next decade.
Source: xxi, xxii, xxiii, xxiv, xxv Risks to the story: increased competition, cost inflation and lower subsidies are potential headwinds to growthCompetitionGiven the industry's growth prospects, competition in the sector is increasing rapidly. In addition to pureplay developers and utilities, oil majors and infrastructure, and pension funds have all entered the market. This includes the likes of Shell, BP, Total and Macquarie's Green Investment Group[xxvi] According to a 2021 Crown Estate Wind report[xxvii], 15% of offshore wind farms in the UK, both operational and under construction, were held by oil & gas producers (up from 12% in 2020) while financial investors accounted for 19%. Competition will therefore be supportive in reducing required returns and the cost of offshore wind development - supporting its proliferation - but will diminish returns for existing market participants. Non-subsidised bidsGovernments are also providing less financial support to developers as the industry matures. In several recent offshore wind tenders in Germany, Netherlands and Denmark, winning bids were non-subsidised offtake bids. Meanwhile, Denmark's last offshore wind auction for its Thor wind farm used negative bidding, meaning the winner, RWE, will be paying development rights to the government[xxviii]. InflationThe current inflationary environment is also putting pressure on offshore wind developers' returns. A typical offshore project takes several years to be completed. Usually, nominal prices are awarded at the beginning, while development costs are secured in later development stages. Hence, projects with prices awarded under the assumption of low / moderate inflation, with costs that have not yet been fully secured, face the risk of compressed returns, which could jeopardise the investment decision. Additionally, rising costs of steel is putting pressure on turbine manufacturers and ultimately impacting offshore wind developers' returns[xxix]. ConclusionWhile there is obviously huge appeal in capitalising on the growing offshore wind opportunity in Europe, companies do face several hurdles and risks in achieving standalone satisfactory returns on these large capital-intensive projects. At 4D, while monitoring the pureplay operators, we currently see greater opportunity to capitalise on the theme through transmission and distribution networks and integrated utilities. An example is our position in Iberdrola - a well-run, undervalued company we believe has a strong track record in offshore development and a diversified business model (networks, renewables, and supply) which allows flexibility in its capital allocation and allows it to better manage the return pressures faced by pureplay renewable companies. This flexibility was evident in the recent Capital Market Day, where increased focus and capital was allocated to networks over generation in the current environment. |
|
Funds operated by this manager: 4D Global Infrastructure Fund, 4D Emerging Markets Infrastructure FundThe content contained in this article represents the opinions of the authors. This commentary in no way constitutes a solicitation of business or investment advice. It is intended solely as an avenue for the authors to express their personal views on investing and for the entertainment of the reader. [i] https://ec.europa.eu/commission/presscorner/detail/en/ip_19_6691 |


 Whilst being an attractive energy replacement for many key industrial needs, hydrogen can be difficult to handle safely and cost-effectively. Industrial gas companies possess significant domain and IP expertise in hydrogen and are heavily involved in both traditional and Energy Transition uses of hydrogen. We believe they hold prime position as key project integrators in the build out of green hydrogen infrastructure, providing decades of growth investment potential.