NEWS

11 Jul 2024 - EMD outlook: election fever
|
EMD outlook: election fever abrdn June 2024 We look forward to the numerous elections that have the potential to shape the asset class and what it could mean for investors.There is rarely a dull moment in emerging market debt (EMD), and the first six months of 2024 have been no different. While the opening half of the year hasn't produced the blockbuster returns of 2023, there have been plenty of talking points. Most notably around elections and debt restructurings. Bond outlook pieces often mention developed market monetary policy as a driver of returns, and rightly so. For emerging markets (EMs) in 2024, however, a different theme has emerged- elections. To date, voters have gone to the polls in Bangladesh, Taiwan, El Salvador, Pakistan, Senegal, India, Mexico, Turkey and South Africa. We don't have time to run through the individual country outcomes but there are a few that warrant a closer look. Let's turn our attention to Pakistan. In January, a civilian government came to power, pledging fiscal consolidation and promising to build foreign exchange (FX) reserves. Sound familiar? That's because it is. Pakistan is now looking to enter a record 24th International Monetary Fund (IMF) programme. The question remains: will the outcome be different this time? The early signs are promising. Ongoing disinflation has allowed the central bank to loosen monetary policy. The balance of payments recently turned positive. But let's not get carried away. This story is still unfolding, and we'll keep a close eye on developments over the coming months. In Mexico, the election of Claudia Sheinbaum, a protégé of the current president (AMLO), is expected to maintain the political status quo. Sheinbaum will need to focus on reducing the deficit from 6% of gross domestic product to a manageable level. The fiscal deficit blew out in the run-up to the election, as AMLO increased unfunded social security payments - among other social transfers - in a bid to shore up support. It certainly did the trick. Sheinbaum will also have to reckon with Pemex, the state-owned energy company groaning under heavy debt and declining crude production. AMLO's decision to include Pemex's amortisation payments in the national budget for the first time also increased the deficit. It's hard to see how Sheinbaum will address these issues in the near future. Democracy alive and wellLiberal democracy has come under pressure over the last few years. It was therefore encouraging to see the world's largest democracy, India, go to the polls in a general election that was generally seen as free and fair. Such is the scale of proceedings that voting took place over six weeks. President Modi has walked away wounded but victorious. His BJP party remains the largest in congress and coalition partners are unlikely to block his planned economic initiatives. Finally, in South Africa, the loss of the ANC's majority for the first time since the dawn of democracy shocked the party. For the moment, things are likely to remain the same. Yet, looking ahead, there's an increased chance of the government collapsing, leading to either parliament choosing a new president or calling for new elections. Stay tuned. What does this mean for investors?Why are we focusing on country-specific events? Because it's in idiosyncratic stories where we see the most compelling investment opportunities. This plays to our strength in EMD: fundamental bottom-up research to generate alpha. At an index level, spreads across bond markets, including EMD, are tight compared with historic levels. Meanwhile, investment-grade spreads have been unattractive for several quarters. We remain underweight here. Over a year ago, we identified value in the distressed and CCC segments. The near completion of several debt restructurings has validated this view, leading to outperformance. Recently, investors accepted Zambia's debt restructuring deal, crafted by official creditors, the IMF and the private sector. These deals should lead to renewed inflows into Zambia and bodes well for Ghana and Sri Lanka, which are negotiating their own deals. While we haven't seen credit-rating upgrades for CCC-rated issuers - where the most significant spread changes have occurred - further narrowing of spreads is likely should such upgrades occur. What's the outlook?And so to the US Federal Reserve. Its decision to delay rate cuts has notably affected EM local bond markets, which are particularly sensitive to shifts in interest rate cut expectations. At the end of May, the EM Index was down -2.7% year-to-date. Despite the current challenges, rate cuts in EMs are coming. Monetary policy remains tight, growth is lagging long-term averages, and base effects mean inflation should continue to fall. Despite the macro backdrop, local bond markets continue to price-in tight monetary policy. We're holding positions and adding selectively in anticipation of the market delivering elevated returns in the coming months. After lagging EMs in 2023, EM Corporate Debt has outperformed in the first half of the year. Fundamentals remain in good shape, reflected in the low default rate year-to-date. At the end of April, the rate stood at just 0.7%, well-below the historical average. Most defaults in this asset class are coming from China's high-yield property sector. Like the sovereign market, spreads have been tightening recently, reaching near-historic lows. Despite this, the high absolute yield of over 7% remains appealing. For now, there seems to be little that could halt the momentum of the spread rally. Finally, a quick word on frontier local markets. What's changing? The answer is: a lot - and for the better. Policymakers are building external buffers, inflows into the local market are contributing to the rebuilding of FX reserves, and financing from commercial and official sources is on the rise. Meanwhile, fiscal consolidation and tightening monetary policy are helping to establish policy anchors. Finally, high nominal yields and attractive carry in countries like Pakistan, Nigeria, Kenya, and Egypt mean that these markets are garnering investor attention and are worth considering for investment. Author: Leo Morawiecki |
|
Funds operated by this manager: Aberdeen Standard Actively Hedged International Equities Fund, Aberdeen Standard Asian Opportunities Fund, Aberdeen Standard Australian Small Companies Fund, Aberdeen Standard Emerging Opportunities Fund, Aberdeen Standard Ex-20 Australian Equities Fund (Class A), Aberdeen Standard Focused Sustainable Australian Equity Fund, Aberdeen Standard Fully Hedged International Equities Fund, Aberdeen Standard Global Absolute Return Strategies Fund, Aberdeen Standard Global Corporate Bond Fund, Aberdeen Standard International Equity Fund, Aberdeen Standard Multi Asset Real Return Fund, Aberdeen Standard Multi-Asset Income Fund |

10 Jul 2024 - Performance Report: DS Capital Growth Fund
[Current Manager Report if available]

10 Jul 2024 - Performance Report: Airlie Australian Share Fund
[Current Manager Report if available]

10 Jul 2024 - BHP's emissions reduction pathway
|
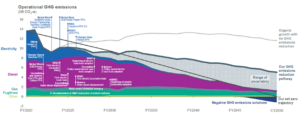
BHP's emissions reduction pathway Tyndall Asset Management June 2024 BHP Group Limited (BHP), a global mining giant, has reaffirmed its commitment to sustainability through an in-depth decarbonisation strategy, which was showcased during an investor presentation on 26 June 2024. The company is making significant strides toward achieving its ambitious medium- and long-term decarbonisation goals, focusing on substantial reductions in greenhouse gas (GHG) emissions across its operations and value chain. This insight delves into BHP's progress, key initiatives, and future plans for decarbonisation. Operational Emissions Reduction: Progress and GoalsBHP is on track to meet its target of reducing scope 1 and 2 emissions by 30% by FY2030, compared to FY2020 levels. By FY2023, the company had already achieved a 32% reduction, predominantly through investments in long term renewable energy power purchase agreements, underscoring its commitment to a sustainable future. To maintain this level of performance as the company - and its emissions - continues to grow is a substantial investment of approximately US$4 billion in decarbonisation initiatives up to FY2030. Key Initiatives:
Figure 1: BHP's operational decarbonisation trajectory |

9 Jul 2024 - Why invest in global equities
|
Why invest in global equities Magellan Asset Management June 2024 |
|
Australian investors often prefer to invest in Australian shares due to their familiarity with local companies. For generations, many have held shares in iconic Australian firms like BHP Billiton, Woolworths, and Westpac Banking, or their predecessors. While many Australians invest locally, they are spending with global companies, regularly choosing to consume products and services from global mega-brands. In our connected lives, we awake to an alarm from our Apple iPhone, sip our morning at-home coffee from Nestlé and tap Visa or Mastercard as we board the train or jump in an Uber. Australians heavily rely on global technology brands such as Microsoft Windows, Netflix, Spotify, Apple iPhone, Alphabet for Google internet searches and Meta Facebook and Instagram for social networking. Our pantries and bathrooms are filled with many of Nestlé's 2000 brands, especially some of its 31 mega-brands (Nespresso, Milo, Kit-Kat, Nescafe, Purina, Nature's Bounty Vitamins) as well as Lóreal's broad array of beauty products (Aesop, Garnier, Redken, Lancome). A stop at McDonalds is a feature of many Australian road trips. We use credit cards and mobile Wallets for almost all payments, via international financial services providers like American Express, MasterCard, Visa and Apple Pay and increasingly shop online using platforms like Amazon. Our medicines are developed by pharmaceutical companies based abroad such as in Switzerland or the US, and our surgeries are undertaken using precision equipment by multinational companies. Despite the familiarity and extensive usage of these international brands and products, many Australians have been less confident to own shares in them. Exploring the potential of investing in international shares could offer two significant benefits: Broadening Investment Opportunities Diversifying Risk Four key attributes that may contribute to achieving these two outcomes with international investing: 1. Look globally for the world's best companies. We consider that many of the world's best companies are found overseas - where 98% of stocks, by market capitalisation, are located. Alphabet (Google's parent company), Apple, Meta (Facebook, Instagram and 2. More industries to choose from. Investing in international equities can offer access to emerging industries poorly represented on the ASX. For example, for those seeking exposure to the prospects of artificial intelligence, 3D-printing, Cloud or cybersecurity, 3. Reduce local exposure. A portfolio that holds only Australian assets such as property, term deposits and Australian stocks is vulnerable to fluctuations in the Australian economy. The lack of diversification may expose investors to higher levels 4. Spreading currency risk. Investing in different markets may help diversify currency risk. Investing in international equities offers exposure to foreign currencies as the global stocks are bought in the local currency of their listing, which may include Investing in global equities offers Australian investors the opportunity to tap into the familiarity they already have with global mega-brands and access broader investment opportunities. By venturing into the global market, investors gain access to a wider array of industries and sectors underrepresented or absent on the Australian stock exchange. Investing in global equities can provide exposure to some of the world's best companies, diversification, and the potential for long-term growth. |
|
Funds operated by this manager: Magellan Global Fund (Hedged), Magellan Global Fund (Open Class Units) ASX:MGOC, Magellan High Conviction Fund, Magellan Infrastructure Fund, Magellan Infrastructure Fund (Unhedged), MFG Core Infrastructure Fund, Magellan Core ESG Fund Important Information: This material has been delivered to you by Magellan Asset Management Limited ABN 31 120 593 946 AFS Licence No. 304 301 ('Magellan') and has been prepared for general information purposes only and must not be construed as investment advice or as an investment recommendation. This material does not take into account your investment objectives, financial situation or particular needs. This material does not constitute an offer or inducement to engage in an investment activity nor does it form part of any offer documentation, offer or invitation to purchase, sell or subscribe for interests in any type of investment product or service. You should obtain and consider the relevant Product Disclosure Statement ('PDS') and Target Market Determination ('TMD') and consider obtaining professional investment advice tailored to your specific circumstances before making a decision about whether to acquire, or continue to hold, the relevant financial product. A copy of the relevant PDS and TMD relating to a Magellan financial product may be obtained by calling +61 2 9235 4888 or by visiting www.magellangroup.com.au. Past performance is not necessarily indicative of future results and no person guarantees the future performance of any financial product or service, the amount or timing of any return from it, that asset allocations will be met, that it will be able to implement its investment strategy or that its investment objectives will be achieved. This material may contain 'forward-looking statements'. Actual events or results or the actual performance of a Magellan financial product or service may differ materially from those reflected or contemplated in such forward-looking statements. This material may include data, research and other information from third party sources. Magellan makes no guarantee that such information is accurate, complete or timely and does not provide any warranties regarding results obtained from its use. This information is subject to change at any time and no person has any responsibility to update any of the information provided in this material. Statements contained in this material that are not historical facts are based on current expectations, estimates, projections, opinions and beliefs of Magellan. Such statements involve known and unknown risks, uncertainties and other factors, and undue reliance should not be placed thereon. No representation or warranty is made with respect to the accuracy or completeness of any of the information contained in this material. Magellan will not be responsible or liable for any losses arising from your use or reliance upon any part of the information contained in this material. Any third party trademarks contained herein are the property of their respective owners and Magellan claims no ownership in, nor any affiliation with, such trademarks. Any third party trademarks that appear in this material are used for information purposes and only to identify the company names or brands of their respective owners. No affiliation, sponsorship or endorsement should be inferred from the use of these trademarks. This material and the information contained within it may not be reproduced, or disclosed, in whole or in part, without the prior written consent of Magellan. |

8 Jul 2024 - Down-trading Megatrend
|
Down-trading Megatrend Insync Fund Managers June 2024
Funds operated by this manager: Insync Global Capital Aware Fund, Insync Global Quality Equity Fund Disclaimer |

5 Jul 2024 - Hedge Clippings | 05 July 2024
|
|
|
|
Hedge Clippings | 05 July 2024 This week we're going to start on politics, and then move on to the economy - or more specifically the outlook for inflation and interest rates. This is partly because last week's Hedge Clippings only touched on the US Presidential Debate as it was still underway as we were putting the finishing touches to our commentary, and partly because we underestimated how badly Biden had performed. We did comment that "early indications were Biden faltered badly on occasions," whereas it turns out even he admitted (finally) that it wasn't his greatest performance. You can say that again! Based on current polling it looks as if Trump (assuming Biden doesn't take the hint and pull out) will be heading back to the White House in early November, complete, thanks to a stacked Supreme Court ruling that gives a President immunity from prosecution for official acts while taken in office. On the face of it, that appears somewhat bizarre, but we have to admit we don't fully understand either US constitutional law (i.e. what constitutes "official") or, if it comes to that, the American political landscape. If we did understand the latter we'd be able to explain how a country, and a democratic one to boot, of 330 million people, only has a choice between Sleepy Joe - aged 81 and showing every bit of it - or the Donald - a convicted felon, confirmed philanderer, and well known golf cheat. The really unfortunate side of the lack of choice is that competition is good - and Trump in particular needs a strong opponent to keep him honest - or at least to call out his more dishonest claims. Assuming Trump wins in November, expect the unexpected. At least there'll be plenty of material for us on a weekly basis! Meanwhile the UK's initial election results are in, and the pollsters seem to have been absolutely spot on the money - much like Rishi Sunak's staff, who somehow thought it would be smart to have a punt on the date of an early election. In politics, much like any other confrontational battle, disunity is death. The fact that the Conservatives went through four Prime Ministers in five years, (Theresa May, Boris Johnson, Liz Truss, and finally Rishi Sunak) resulted in the inevitable. Given that Theresa May (PM 2016 - 2019) achieved some economic success (falling national debt, record employment, and income tax cuts for 32 million people) one could argue that her predecessor David Cameron has a lot to answer for by announcing a divisive and avoidable Brexit referendum dividing the nation (sound familiar?) and promptly quitting once the result was in. Although yesterday's election result was overwhelmingly in favour of a change of government, only time will tell if the UK's many problems are reversible, or if the downhill slope of the past 10 or more years can be reversed. Closer to home, Albo won't have been pleased with the distraction of one of his (now ex) senators crossing the floor, and subsequently leaving the government, just when he was wanting to focus on tax cuts for all, energy relief for all, and wage rises for all lower paid workers. We're not against these moves, but we doubt the RBA would have been overjoyed by their potential inflationary effects at a time that they're trying to curb demand, and tame inflation. The RBA would have been more pleased by household spending data released today by the ABS which showed an increase over 12 months to May of just 0.1%, with services up +2.3% while spending on goods fell -2.5%. Household spending has been trending down since September 2022, and when combined with June quarter CPI and retail trade data both due on the 31st of July will be a key part of the mix when the RBA next meets on the 6th and 7th of August. It will probably be too early at that stage to see the effects of the government's tax cuts and income support, but also too early to hope for a rate cut. News & Insights Market Commentary | Glenmore Asset Management Bull and bear case for Australian shares in the New Financial Year | Airlie Funds Management May 2024 Performance News |
|
|
If you'd like to receive Hedge Clippings direct to your inbox each Friday |

5 Jul 2024 - Sustainable buildings: Beyond solar panels and water tanks
|
Sustainable buildings: Beyond solar panels and water tanks Janus Henderson Investors May 2024 According to the World Green Building Council, buildings and construction are currently responsible for 39% of global energy related carbon emissions: 28% from energy required for heating, cooling and electricity, and the remaining 11% from embodied carbon i.e., materials and construction. As Australia seeks to build more houses to address the current shortage, in addition to ongoing activity in commercial infrastructure, more needs to be done to help the construction industry reach net zero. Energy related carbon emissions are the easiest to tackle with many energy efficient initiatives and the use of renewables for electricity generation available. However, the biggest headwind facing this sector is embodied carbon. The availability and scalability of low-carbon materials remains a challenge as the industry is in a nascent stage. Supply is limited and the cost is high compared with traditional raw materials. As the industry works through the 'hard to abate' sectors, such as cement and steel, there are some ways to make buildings more sustainable now. These include the use of:
What can investors do to help?The Janus Henderson Australian Fixed Interest team has identified 'sustainable buildings' as one of its 'People and Planet' themes and buys 'use of proceeds' green bonds, sustainability bonds and bonds of issuers where capital is directed to improving energy efficiency in homes and creating more sustainable buildings. To improve our country's infrastructure and make our buildings more sustainable, collaborative efforts from a variety of stakeholders will be required. While state governments are likely to do some of the heavy lifting through increasing industry standards at the time of initial build and through their own housing projects, industry can also play a part. Regardless of which parties are involved, these projects require funding. Investors can play a role by putting their capital towards such projects through investing in funds that invest in this sector. In addition to investing in these bonds, Janus Henderson's Australian Fixed Interest team has a role to play through our active engagement. By having conversations with issuers and offering them support to come to market, we seek to increase the supply of public debt that has proceeds directly linked to creating more sustainable buildings. We also discuss climate targets with issuers in engagement meetings we conduct. State GovernmentsOn 1 October 2023, New South Wales (NSW) was the first state to introduce the 'Sustainable Buildings SEPP' which aims to reduce water usage and greenhouse gas (GHG) emissions across NSW. This new regulation, applicable during the construction of buildings, applies to both commercial and residential buildings (excluding three climate zones and apartment buildings up to five storeys). The new standards require: Commercial Buildings:
Residential Builds:
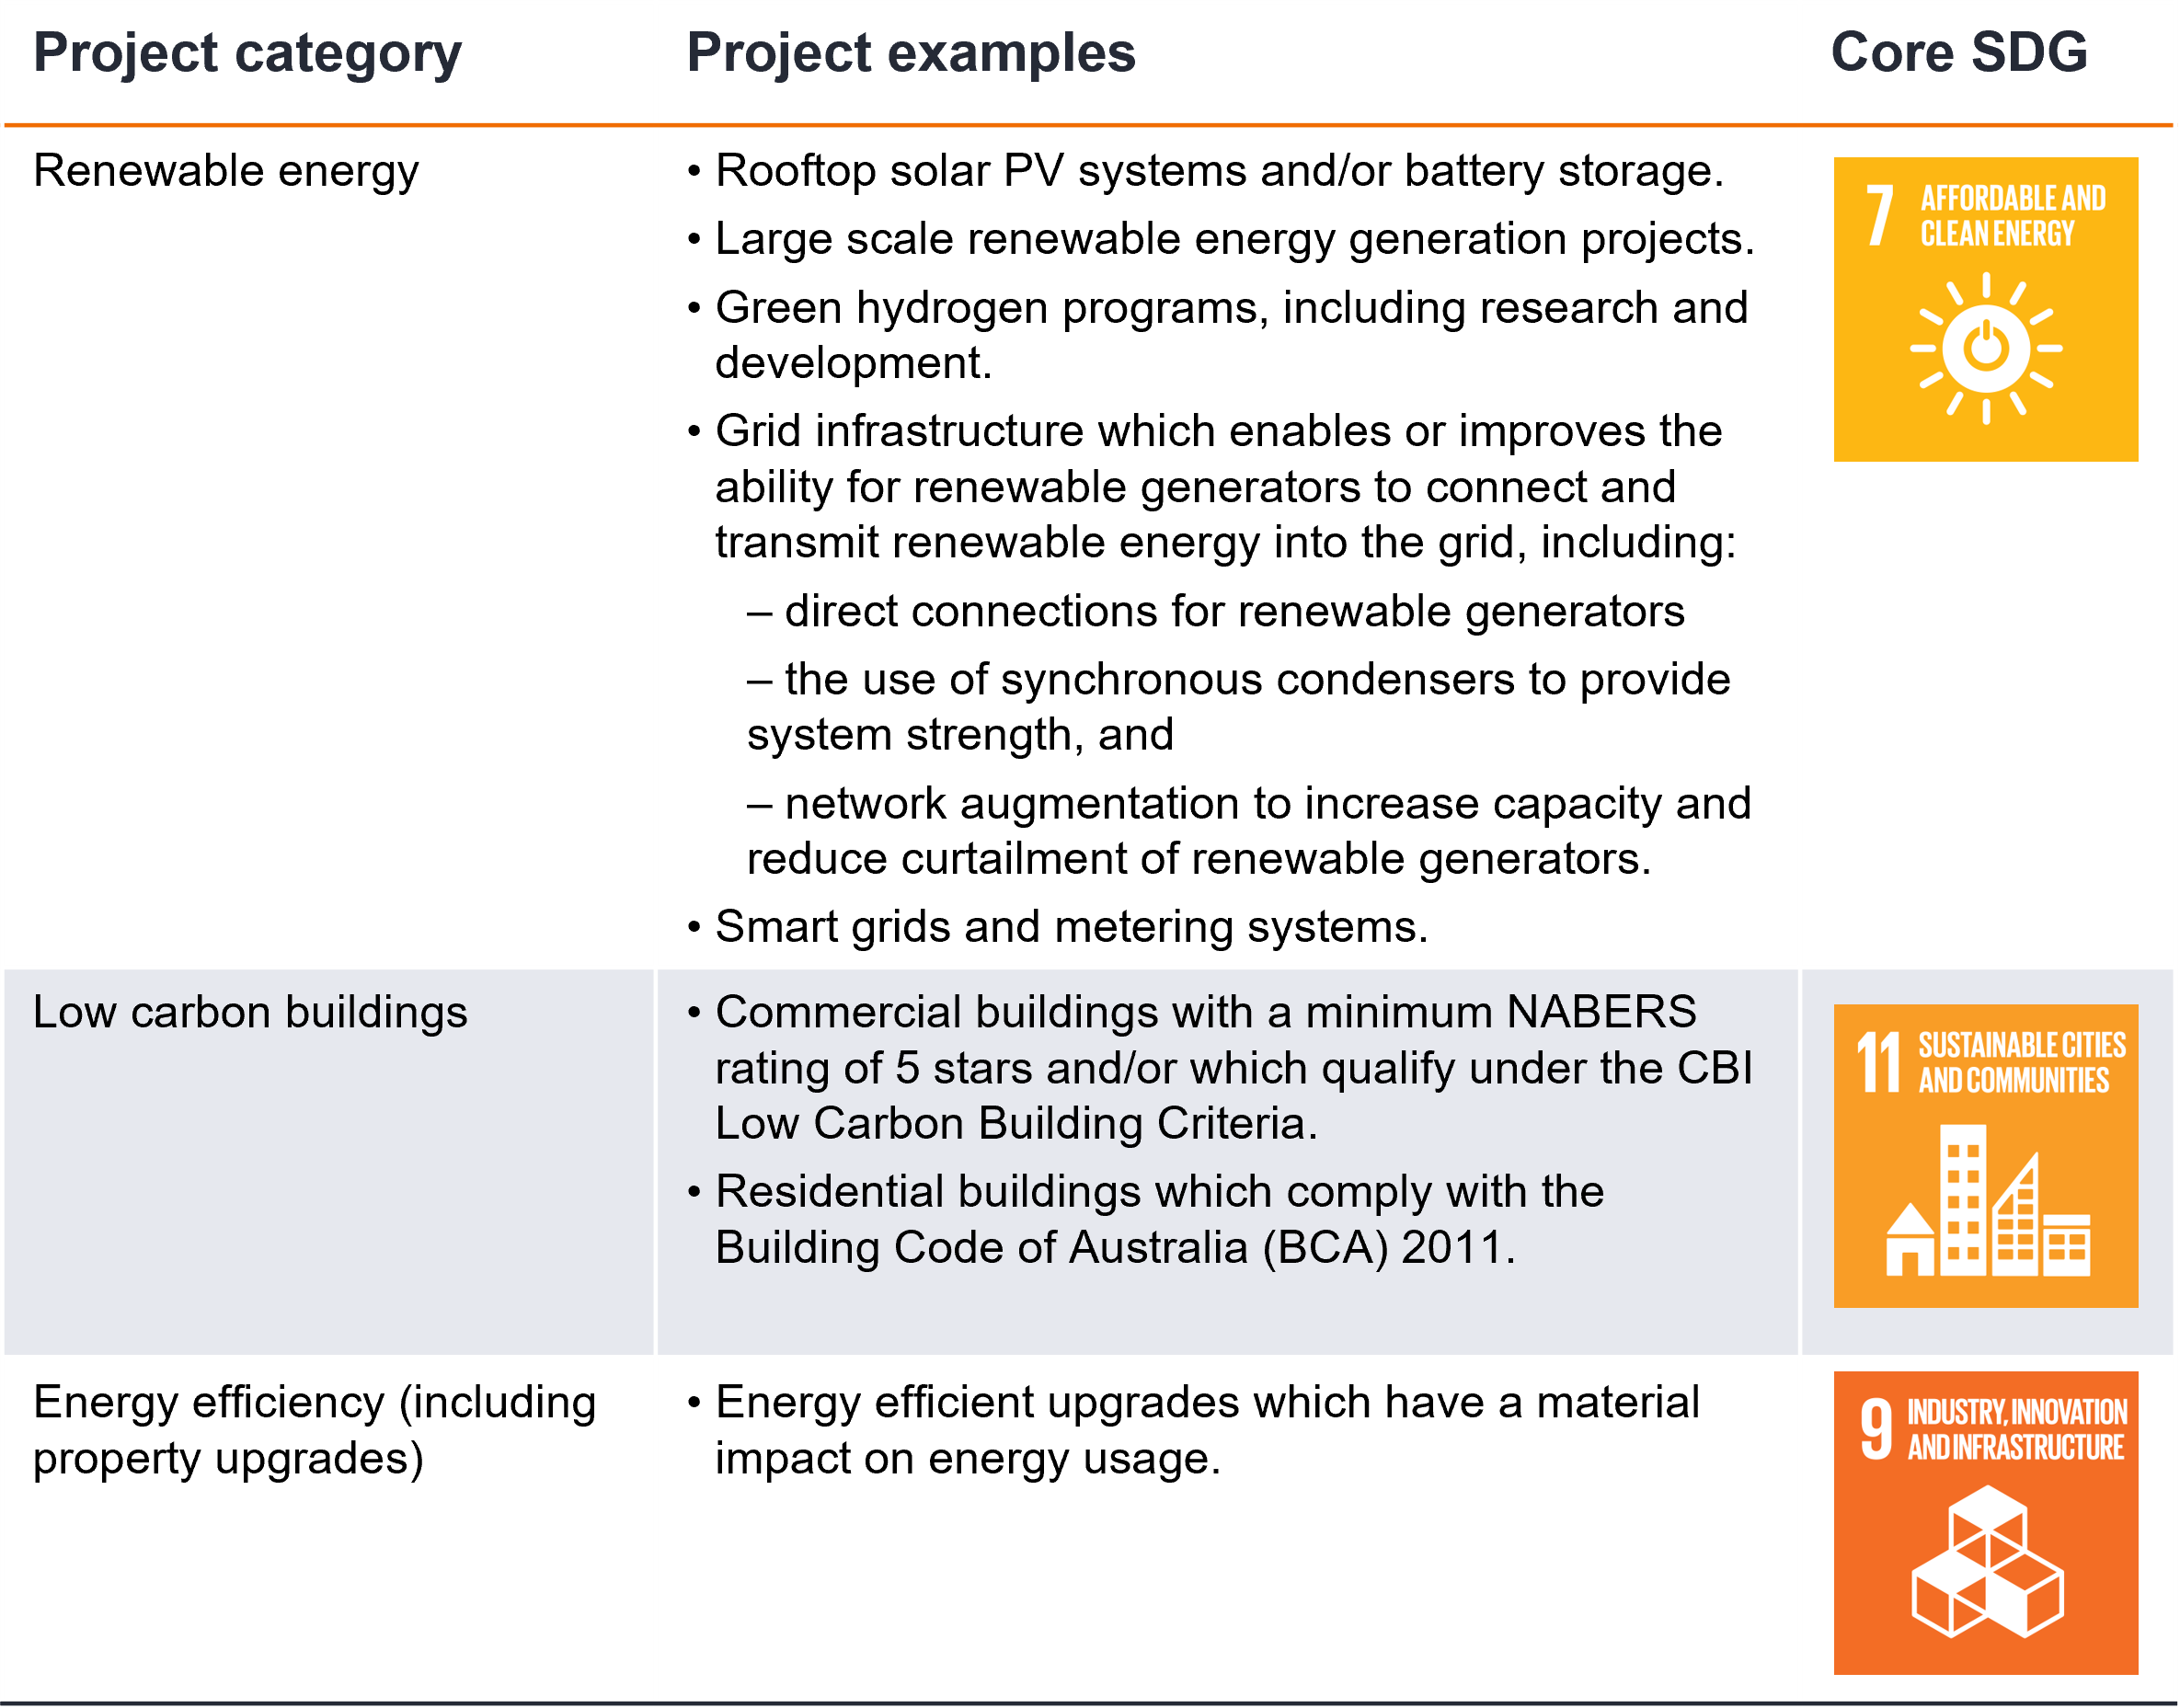
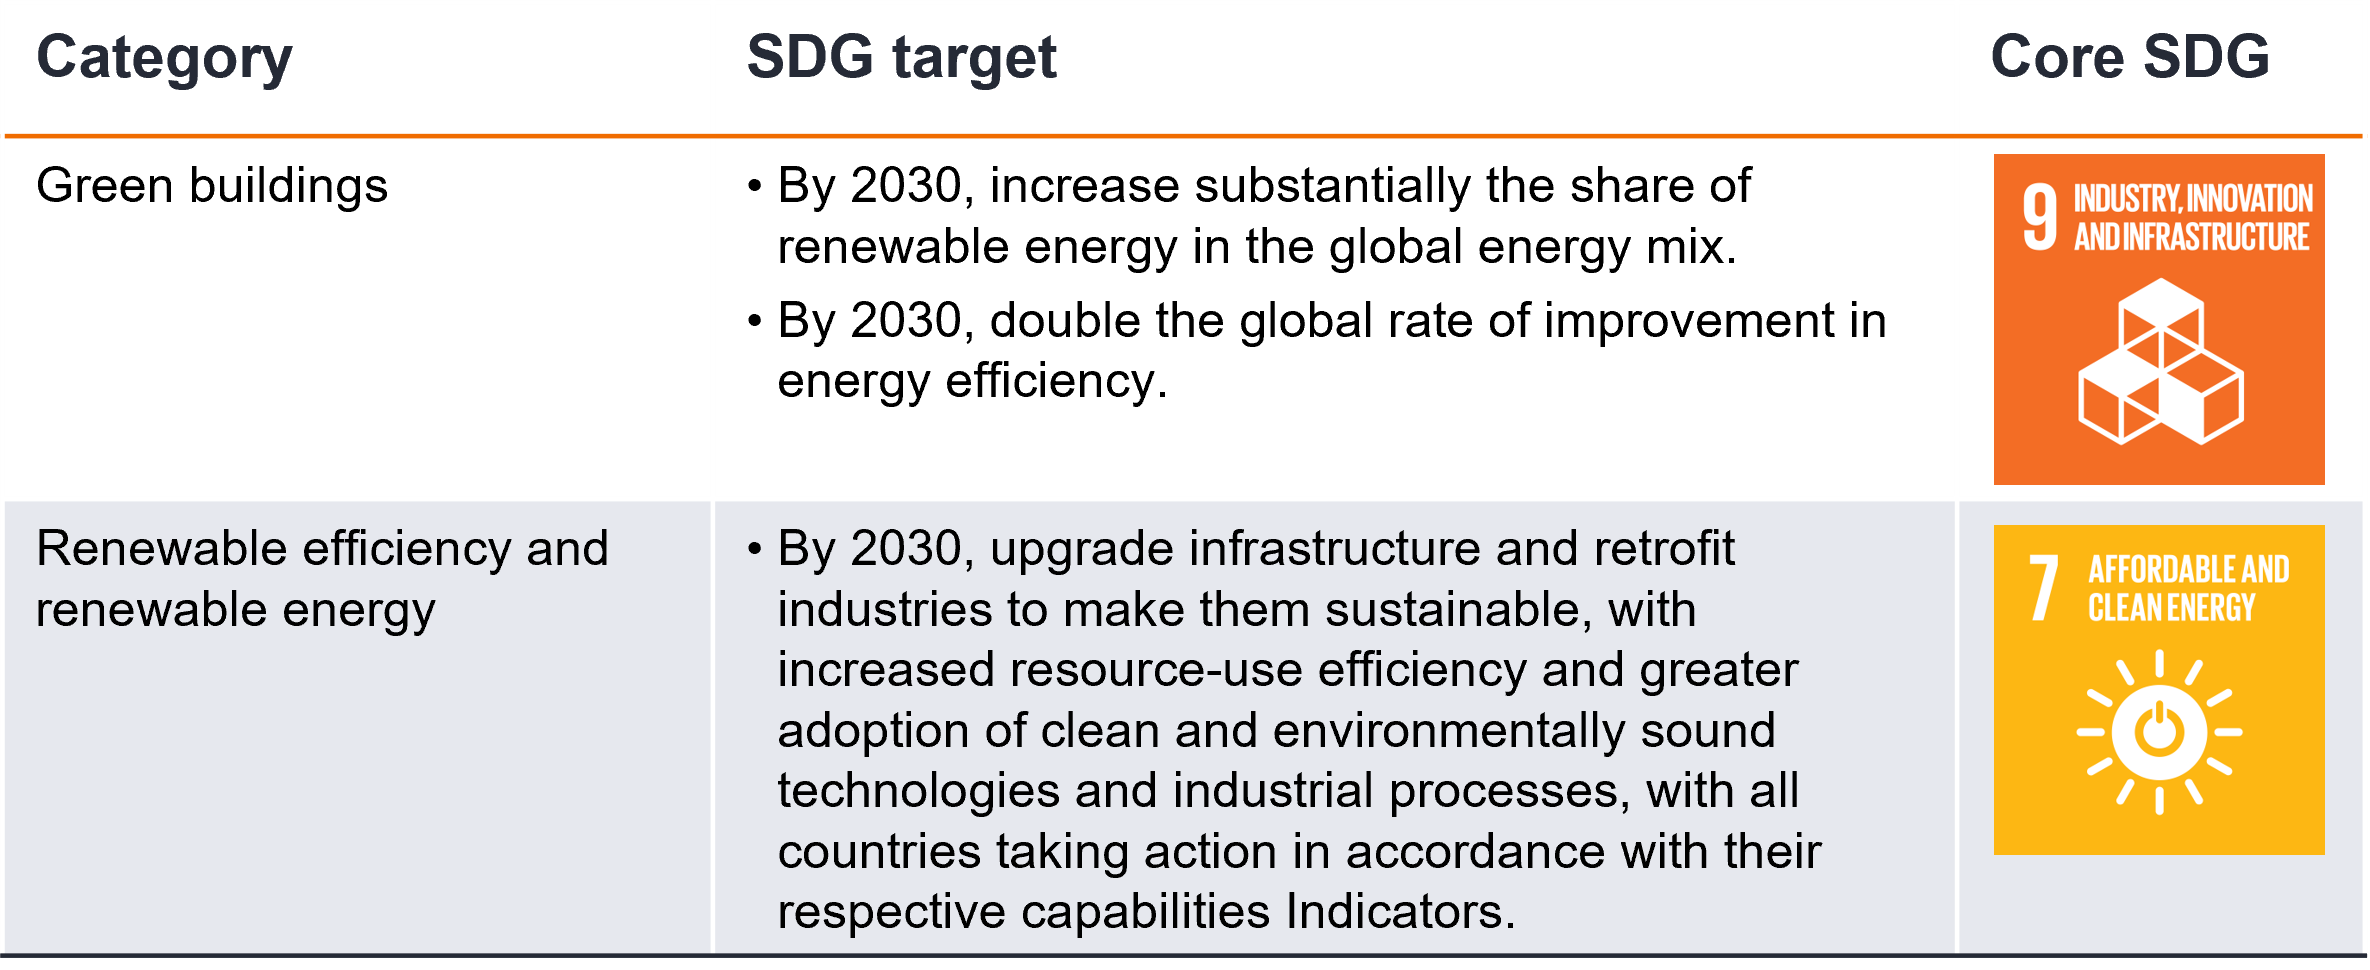
While it is likely that other states will enhance regulatory requirements on new builds, this is not something investors can direct capital towards. However, through the states sustainability frameworks, there is often capital being used for improving energy efficiency in homes. Of note is Treasury Corporation of Victoria's sustainability bonds which has an asset pool with a large weighting towards 'Victoria's Big Housing Build'. Over half of the pool is dedicated to the building of 12,000 new 7-star energy rated social houses. In addition, the Victorian government issues grants towards solar homes, which includes grants for panels, solar hot water, batteries, and household energy efficiency upgrades. The following projects are identified in the Victorian and NSW sustainability frameworks, from which their sustainability bonds are issued. Victoria sustainability framework
NSW sustainability framework
UniversitiesSome of the universities across our country are leading the way on sustainability. La Trobe University and University of Tasmania are two such examples, both of which have issued green bonds which we hold in our Sustainable Credit Fund and across other strategies. In terms of our targeted theme 'Sustainable buildings' they are participating in the following ways: La Trobe University plan to use 100% renewables by 2029, with 30% of their requirements being self-generated through the installation of solar panels on their roofs, and the building of a solar farm adjacent to their Bundoora campus. They are focused on reducing their carbon footprint through energy efficient building upgrades and a minimum 5-star green rating for all new builds. With new buildings they use cross laminated timber (CLT) which reduces embodied carbon compared to traditional methods. The benefits of CLT are that it is renewable, so throughout its growth it is capturing carbon. During the construction process it requires less water, energy and fossil fuels, resulting in a lower carbon profile. The timber is fabricated to a specific size so there is less waste when creating the material and given the pre-fabricated nature of the project it allows for quick build times, again reducing energy for the build. At end-of-life, CLT allows for simpler demolition with less construction waste and more opportunities for reuse/recycling of the materials. La Trobe have also committed to replant multiple trees for every one tree that is removed during the clearing for a new building. University of Tasmania is moving its Sandy Bay campus into the Hobart CBD. Already certified carbon neutral since 2016, the $550m project (which runs through to 2030) presents a significant opportunity to further contribute to decarbonisation. The university aims to reduce the upfront embodied carbon in its building program through the utilisation and adoption of low carbon construction practices and materials (including low carbon cement /concrete, CLT, recycled materials etc). The capital raised from their green bonds is being used to finance campus buildings, targeting a 20% or better reduction in upfront carbon emissions, relative to industry standard. As to the achievability of this target, the university's building projects in the north of the island, had achieved emissions reductions in the low 30%'s. Wider adoption of such innovative practices will be a game-changer for the broader Australian construction industry, and a significant positive as it relates to achievement of longer-term economy-wide emissions reduction commitments. Real estate investment trustsReal estate investment trusts (REITs) are large owners and builders of real estate, and therefore are key players in building, upgrading and maintaining sustainable buildings. Development and management property group Mirvac pride themselves on their sustainability credentials. Their climate targets include zero waste to landfill and net positive carbon (Scope 1-3) and water by 2030. Mirvac states they are committed to using sustainable and low-carbon materials in new developments. They are actively engaged in selecting low-carbon and sustainable materials for their construction projects such as recycled content, responsibly sourced timber, and low-carbon concrete alternatives, and promoting the use of recycled and renewable materials. Mirvac also incorporates sustainable design principles into projects to minimise embodied carbon. This includes optimising building layouts to maximise energy efficiency, using passive design strategies, and integrating renewable energy technologies to reduce reliance on carbon-intensive energy sources. While we like this issuer's overall sustainability framework, accessing 'use of proceeds' bonds that direct capital to specific green projects is more challenging. As it stands, they only have non-green bonds in Australian currency, with the lone green bond on issuance being in Hong Kong Dollars. While arguably a laggard to Mirvac, but still exhibiting strong ESG credentials, Vicinity Centres also aims to be net zero by 2030 (achieving a 41% reduction since 2016). They have recently invested $73m to deliver Australia's largest solar installation program across their shopping centres, and in FY21 managed to recycle 51% of their total generated waste. Investors can access direct investment in the sustainable buildings theme through Vicinity Centre's green bond which was issued in May 2022. The proceeds of this bond were used to finance projects and assets in line with their Sustainability Finance framework (and qualify as eligible under ICMA's Green Bond Principles). This includes financing or refinancing buildings with a minimum 5-star NABERS energy rating or above, of which they have three eligible assets including one which holds the highest rating possible (6 stars). The Banks' green and sustainable bondsMany of the banks (including the 4 majors and smaller banks such as Bank Australia, Bendigo Bank, and RACQ) are now offering, at a discount, 'green mortgages and loans' for customers. The proceeds of the loan are to be used to buy and install eligible small-scale renewables such as solar panels, battery packs and electric vehicle charging stations at the property. To fund these loans and mortgages they usually become a part of the assets pool in the bank's green bond and/or sustainable bond program. Commonwealth Bank of Australia for one has also offered up 'green' term deposits for institutional investors. ConclusionProgress towards building and upgrading more sustainable buildings can be helped along by investors willing to allocate capital to this space through:
Author: Liz Harrison, Fixed Interest Strategist - ESG |
|
Funds operated by this manager: Janus Henderson Australian Fixed Interest Fund, Janus Henderson Australian Fixed Interest Fund - Institutional, Janus Henderson Cash Fund - Institutional, Janus Henderson Conservative Fixed Interest Fund, Janus Henderson Conservative Fixed Interest Fund - Institutional, Janus Henderson Diversified Credit Fund, Janus Henderson Global Equity Income Fund, Janus Henderson Global Multi-Strategy Fund, Janus Henderson Global Natural Resources Fund, Janus Henderson Tactical Income Fund
This information is issued by Janus Henderson Investors (Australia) Institutional Funds Management Limited (AFSL 444266, ABN 16 165 119 531). The information herein shall not in any way constitute advice or an invitation to invest. It is solely for information purposes and subject to change without notice. This information does not purport to be a comprehensive statement or description of any markets or securities referred to within. Any references to individual securities do not constitute a securities recommendation. Past performance is not indicative of future performance. The value of an investment and the income from it can fall as well as rise and you may not get back the amount originally invested. Whilst Janus Henderson Investors (Australia) Institutional Funds Management Limited believe that the information is correct at the date of this document, no warranty or representation is given to this effect and no responsibility can be accepted by Janus Henderson Investors (Australia) Institutional Funds Management Limited to any end users for any action taken on the basis of this information. All opinions and estimates in this information are subject to change without notice and are the views of the author at the time of publication. Janus Henderson Investors (Australia) Institutional Funds Management Limited is not under any obligation to update this information to the extent that it is or becomes out of date or incorrect.
|

4 Jul 2024 - Nothing Wrong With Big Super Funds
|
Nothing Wrong With Big Super Funds Marcus Today June 2024 |
|
For most Australians, picking individual stocks and maintaining stock market vigilance is a passionate hobby. But what if you don't have the time? What if you just want to look after money, not make money? What if you need something more passive? What if you don't want to step onto the stock market battlefield, get distracted from your metier, and take risk?Well I have some good news. There is nothing wrong with that Big Super or Industry Fund that you are already invested in.Almost everybody has Super and for those of you that want a peaceful life, undisturbed by share market volatility and requiring only marginal vigilance, you need do no more than stick with the structure that most of you already have. That is to say, leave your money tucked in one of the large superannuation or industry funds because there is nothing wrong with that, for a number of reasons:
Author: Marcus Padley |
|
Funds operated by this manager: |

3 Jul 2024 - When the equity markets are misjudging risk focus on what you can control
|
When the equity markets are misjudging risk focus on what you can control Redwheel June 2024 |
|
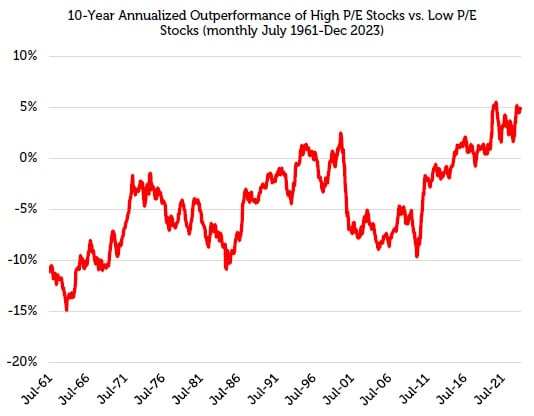
The concept of risk should be simple and straight forward, yet it repeatedly seems to get twisted upside down and back to front, causing bubbles and crashes. For investors, it is the coupling of human behaviour and risk systems that are the root cause of such outcomes. Today, when seven stocks account for 20% of global indices[1], risk seems to have been turned on its head yet again. As excessive valuations and concentration risk in global benchmark indices continue to increase, how can equity investors navigate this environment? We believe the answer lies in accepting what you can control and what you can't. Investors can't control valuations, but they can target income in market conditions where dividends have historically made outsized contributions to total returns. Three quotes that explain how risk can be turned on its head For investors, risk is inseparable from return; both are predicated on an unknowable future. Hence, the risk-free return is usually the lowest: the greater the certainty of future outcomes, the lower both the risk and return. In general, accepting the risk of an uncertain range of future outcomes is necessary to generate a return higher than the risk-free rate. However, it does not guarantee such a return - that's why it is called risk! Therefore, one should strive in an investment process to allocate capital for a range of future outcomes where the probability is skewed towards a favourable return. Naturally this won't always result in a positive outcome. We get things wrong and/or it can take longer to generate a return. The challenge obviously is to get it right more often than not. However, there can be times when, despite leaning the statistics in one's favour, performance can remain sub-par for a period. A coin toss is 50/50 but you can still get a run of heads. Howard Marks wrote, "...human nature makes it hard for many to accept the idea that the willingness to live with some losses is an essential ingredient in investment success". [2] Within active equity management, relative underperformance is "hard for many to accept" despite being "an essential ingredient in investment success". The reasons why are multi-faceted, yet at the kernel of it is a catch created by our own industry. Active managers assume risk in order to generate decent returns. Clients are then told to measure the success of this risk return approach by comparing the outcome to a benchmark. It is therefore assumed that active managers take risk while the benchmark is risk free. Most of the time this makes sense. Within equities, markets are typically rational and accurate at allocating capital, and the risk reward is skewed favourably. However, there are periods where irrationality can take a hold. Benjamin Graham, mentor to Warren Buffett, said: "In the short-run, the stock market is a voting machine, in the long-run, it is a weighing machine". The "weighing" of risk reward becomes replaced by emotion or "voting". It is usually at these times of excessive greed or fear that the benchmarking system turns on its head. In extreme conditions, underperformance becomes magnified and it becomes "hard for many to accept the idea .... to live with some losses". When the herd mentality creates a concentrated market, being different from such a majority feels increasingly wrong. It's at these times, when pressure on fund managers is greatest, that career risk is highest. It's also during these periods that risk systems are most likely to drive investors to move closer to the herd, to the benchmark, in order to reduce the risk of further relative "losses". Yet it is exactly at these times that the understanding of risk is turned on its head. Given the extreme valuations in the benchmark, it is there that the risk is greatest. Despite this, investors are encouraged by emotion and risk systems to invest in the benchmark in an attempt to reduce risk! In the words of Oscar-winning actress Geena Davis: "If you risk nothing, then you risk everything". By trying to reduce risk, you generally succeed only in increasing it. Global equity markets carry considerable risk Right now, equities are a prime example of this inverted appreciation of risk. Once again, the market has become concentrated. A narrow part of the market has created a highly concentrated market. US equities now account for c.70% of the MSCI World index, up from c.30% back in the late 1980's (when as an aside, Japan was c.45% of the MSCI World and is now c.6%!). [3] Within that US dominance, the Magnificent 7 account for c.20% of the MSCI World on their own. Of the S&P 500, the Mag 7 [4] account for c.30% of the index [5], yet only account for 18% of the index's earnings, evidencing the premium valuation applied to these stocks. [6] The chart below illustrates how the market has historically disregarded valuation at extremes (when "voting" takes over), increasing both concentration and risk in the benchmark.
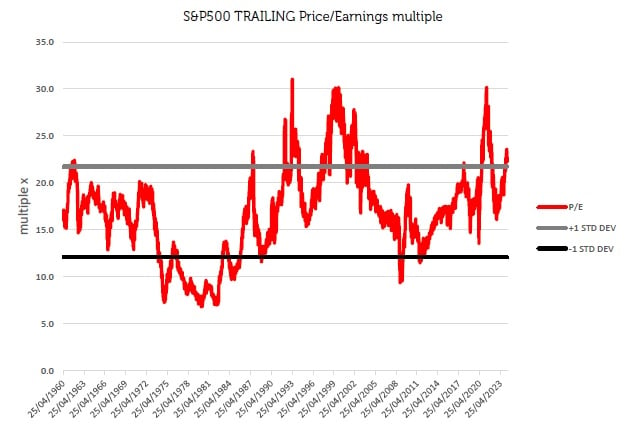
Source: Ken French Data Library, CRSP database, 07/31/1961 - 12/30/2023. Stocks separated into Top Price/Earnings minus Bottom Price/Earnings. The information shown above is for illustrative purposes. Past performance is not a guide to future results. Whether it's the Nifty Fifty bubble in the 1970's or the Magnificent Seven bubble today, the market has repeatedly marched a narrow cohort of the market to excessive valuations, only to see them crash. Yet, it is at these highs and lows, when emotion is dominant, that the pressure is greatest to join the herd. During times of exuberance, when valuation is no longer a concern, investors that follow the benchmark are practically betting on rising valuations. The valuation multiple reflected by the benchmark moves significantly over time, as illustrated by the chart below.
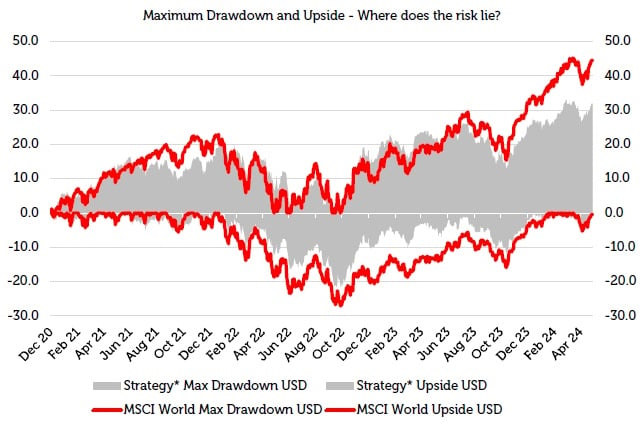
Source: Bloomberg, Redwheel 22 April 2024. The information shown above is for illustrative purposes. Past performance is not a guide to future results. The chart shows that the aggregate price to earnings (P/E) of the S&P 500 since 1960 has spanned a low of 8x to a high of 30x. Today the S&P 500 is above one standard deviation from the average over this period, driven primarily by just seven stocks. The valuation can be influenced by an almost inexhaustible list of things - sentiment, psychology, media, macro events, interest rates, politicians, wars and many more - but it can't be controlled. Despite this, at the extremes when the pressure is greatest to join the herd, investors are simply betting that the valuations will keep rising. Effectively, they are betting on something that is beyond their control, which continues to increase risk while they attempt to reduce it. The chart below demonstrates this well. It shows the maximum drawdowns and upswings in the Redwheel Global Equity Income Strategy (USD) since re-launch in December 2020, compared to the same for the MSCI World index (USD).
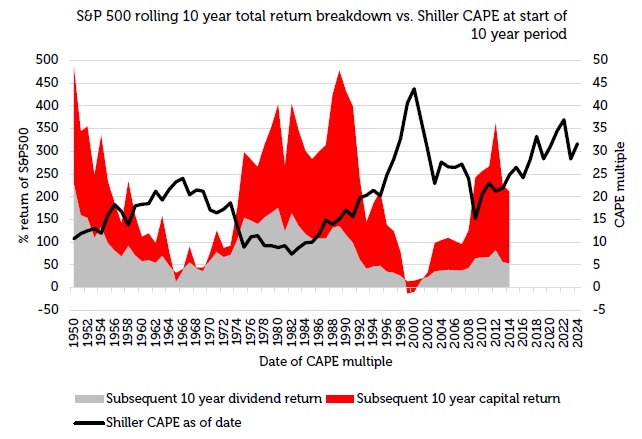
Source: Bloomberg, Redwheel 22 April 2024. The information shown above is for illustrative purposes. Past performance is not a guide to future results. *Please see the disclaimer at the end of this document for further information on the Representative Portfolio. It shows clearly that the moves have fluctuated more in the index than in the strategy. For the most part, the strategy lags during the upswings, but outperforms during the drawdowns. Yet, because the benchmark is seen as lower risk by risk management systems, and due to our own encouragement as an industry, adhering to the benchmark to reduce risk after a period of relative underperformance typically achieves the complete opposite. Focus on what you can control: durable dividends The chart below shows how the periods where emotions ("voting") dominate fundamentals ("weighing") can drive changes in the composition of total returns.
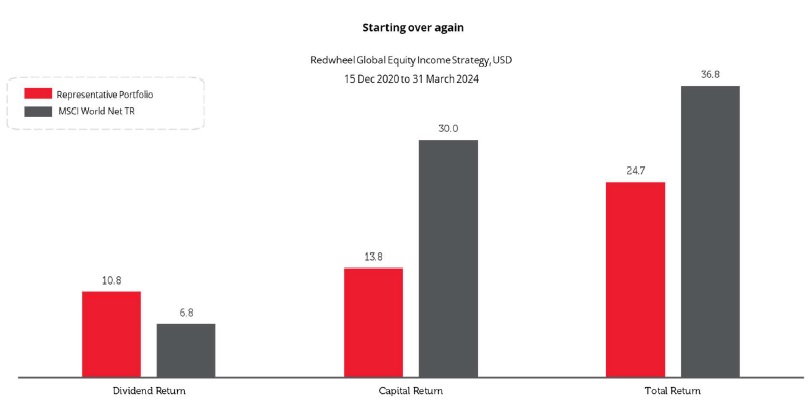
Source: Source: Bloomberg for S&P500 / Shiller Cyclically Adjusted Price to Earnings Ratio (CAPE) www.multpl.com/shiller-pe/table/by-month 31st December 2023. The information shown above is for illustrative purposes. Past performance is not a guide to future results. The chart shows the rolling 10-year returns (USD) for the S&P 500. One can see that the composition of the total return over the rolling 10-year periods changes meaningfully. Sometimes capital return dominates, sometimes the dividend return. The capital return is driven by earnings growth and the multiple applied to those earnings (valuation), which as discussed earlier, are beyond investors' control. However, the dividend return can be controlled. Active managers can invest in companies that aim to deliver durable dividends. Those dividends can then be reinvested to compound a return to drive the total return over time. Of note from the chart above, is that the cycle of the composition of total returns over rolling 10-year periods tends to correlate with the current valuation (Shiller Cyclically Adjusted P/E - CAPE) at the start of the period. The higher the starting valuation, the greater the probability that the next 10 years' total return will be driven by the dividend component, the lower the starting valuation and it is the capital that will likely dominate. Thus, in the current market, where valuations are high, where the last 10-year period has been driven by capital gains, where concentration has once again peaked, many investors are being encouraged by emotions and risk systems to herd into the most uncontrollable, more volatile aspect of total returns to reduce risk! Instead, we believe investors should be focusing upon what is achievable, what is within their control: durable dividends, compounded over time. The less volatile path over time. This is what the Redwheel Global Equity Income Strategy is focused on to deliver robust total returns over time. We focus on what we have a degree of control over: dividends and the yield we get on them.
Source: Redwheel, Bloomberg, 31 March 2024 ,USD Dividend yields should drive total returns from here Since resuming the strategy at Redwheel, already the income contribution is greater than the market[1], despite compounding that income at a far lower rate than the market. [7] That is because of the higher starting yield. Given where risk really resides today, we believe that over time, the capital return element of the strategy will normalise in line with the market, allowing the compounding of dividends yields to drive long-term outperformance. Today's relative losses reflect our "willingness to live with some losses [as] an essential ingredient in investment success". However, it is precisely at times like today when it is most appropriate to invest in a strategy like ours that focuses on what can be controlled, rather than the benchmark, where risk has been turned on its head. |
|
Funds operated by this manager: Redwheel China Equity Fund, Redwheel Global Emerging Markets Fund |
|
[1] Source: Factset end of March 2024. [2] Howard Marks, Fewer Losers, or More Winners? Memo September 2023. [3] Source: Factset end of March 2024. [4] Microsoft, Amazon, Google (Alphabet), Tesla, Facebook (Meta), Nvidia and Apple [5] Source: Factset end of March 2024. [6] Source: Factset end of March 2024. [7] MSCI World Net TR index Key Information |



.png)
