NEWS

18 Jul 2024 - Performance Report: Altor AltFi Income Fund
[Current Manager Report if available]

18 Jul 2024 - Interrogating the bull case for housing
|
Interrogating the bull case for housing Challenger Investment Management June 2024 Over the past few months, we've been puzzled by the strength of the bullish tone around house prices. Puzzled because the argument supporting house prices seems to be hanging on the lack of supply/strong migration creating a supply demand imbalance. Most other factors seem to be flashing warning signals. Consider:
With all these negative indicators we are heavily reliant on the housing supply/demand argument holding up house price valuations. So how confident are we in the supply/demand imbalance? The first indicator for low supply seems to be the lack of vacant rental housing. Pre-COVID vacancy rates were around 2.5%, close to 20 year peaks. When COVID hit, vacancy rates spiked then declined sharply as household formation rates plummeted.
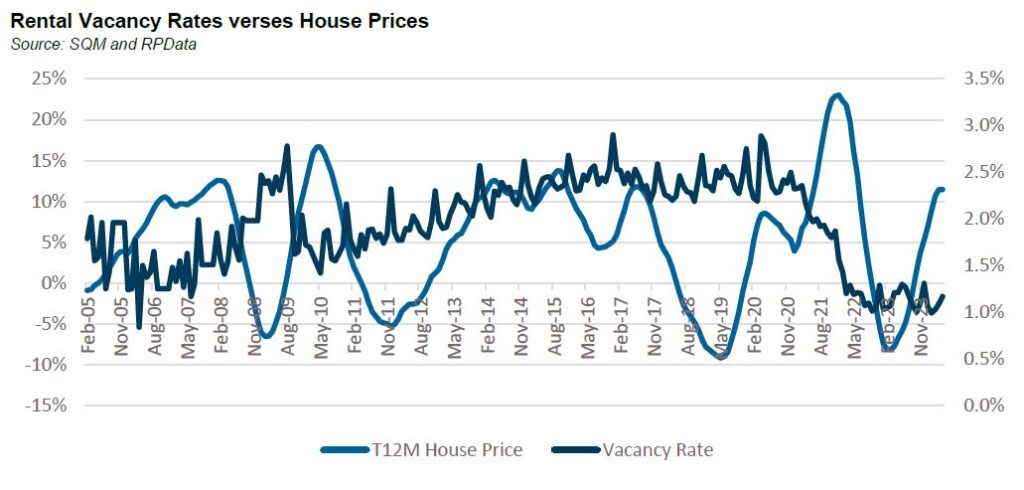
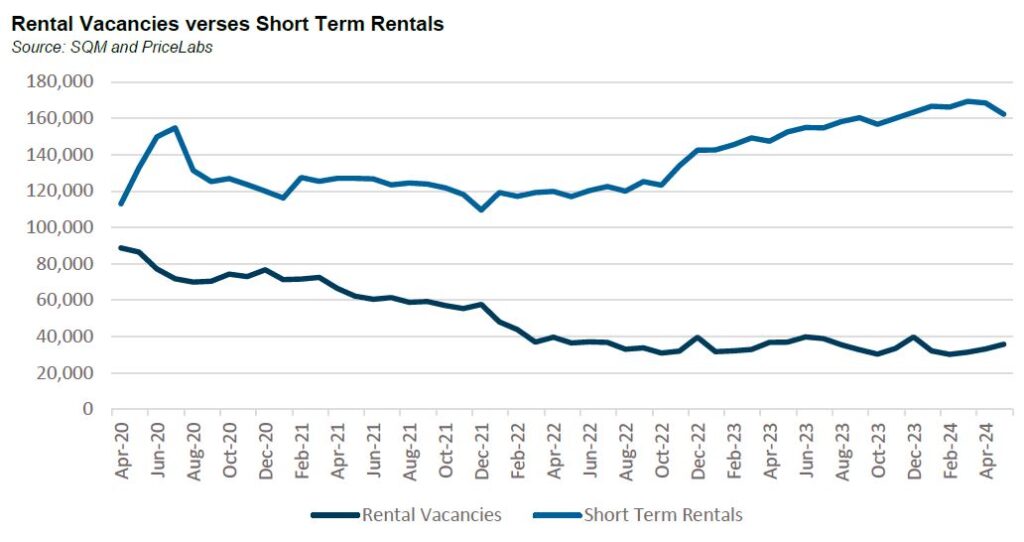
However, the relationship between vacancy rates and house prices does not appear to be as strong as the headlines suggest[1]. Coming out of the GFC, house prices rose strongly even as vacancy rates increased. For much of the 2010s vacancy rates were rangebound between 2-3% but in the second half of the decade prices began to decline. In fact, the last time vacancy rates were this low, it was prior to the GFC. When a vacancy rate of 1% is quoted, it's calculated as a percentage of total rental stock, not total housing stock. Total housing stock is c. 11 million units compared to rental stock of 3 million. To put in context the decline in the vacancy rate from March 2020 to current is equivalent a reduction of around 30,000 dwellings. Contrast this figure with the amount of unoccupied houses which was over 1 million on the night of the 2021 census of which 10,000 dwellings were completely vacant, 100,000 were secondary dwellings with the remaining 890,000 being primary dwellings which were empty. Historically there has always been around 10% of total housing stock that is unoccupied at any point in time. Related to this are short term rentals. These do not show up in the rental vacancy statistics mentioned above but according to PriceLabs, a site which tracks short term rentals, listings are up by close to 50,000 since the start of COVID. It's not unreasonable to assume that some of the rental stock taken out of the market has moved into the short term rental market.
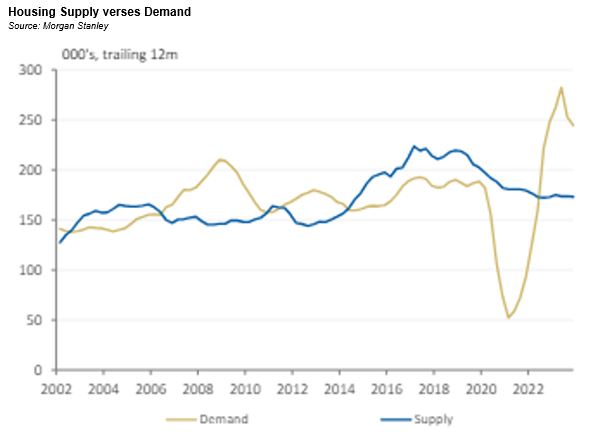
The question is, could it come back? Having rebounded strongly post COVID RevPAR[2] is down slightly on a year over year basis. With interest rates higher, the economics of short term rentals (and for that matter, long term rentals) is under pressure. Add to this, increases in land taxes for investors in Victoria plus an upcoming levy of 7.5% to be charged for short term rentals which is to be charged from 2025. It's not inconceivable that as financial conditions tighten, supply could come out of existing stock, either via second houses or short term rentals. On the supply side, it is clear that the government's target of building 1.2 million homes in 5 years is not happening. The National Housing Supply and Affordability Council estimated in May that around 903,000 dwellings would be built with a further 40,000 social and affordable dwellings built, figures that appear to be far more achievable. But they also expect demand to stabilise with around 871,000 new households forming as migration normalises. So, looking forward we don't seem to have a major housing supply issue. The question is whether we are grossly under supplied now. The below chart from Morgan Stanley attempts to answer this. It shows that we were undersupplying during the GFC and early 2010s and oversupplying from around 2015 until 2022 from which point the housing market became historically undersupplied. In fact, it is arguable that we are undersupplied right now; our view is that the market is extrapolating incremental demand exceeding incremental supply into a more significant and permanent imbalance than likely exists[3].
So, what does this all mean? We think the supply-demand argument is overbaked. The state of the housing market has much more to do with the amount of stimulus and lagged effect of interest rate increases than migration and construction. As the economy goes so too does the housing market. Already house prices in New Zealand and the United Kingdom, two markets with very tight supply demand characteristics, are declining. House prices in Canada are flat and slowing in the United States. House prices have had a strong run in Australia, but we expect some normalisation over the second half of 2024. Funds operated by this manager: Challenger IM Credit Income Fund, Challenger IM Multi-Sector Private Lending Fund For Adviser & Investors Only
[1] Academic research has shown there is a relationship between rental vacancy rates and rents and then a relationship between rents and house prices. Our view is simply that there are much more important factors at play driving house prices such as real incomes, interest rates, sentiment and asset prices. [2] RevPAR refers to Revenue Per Available Room. It is a standard acronym within the hotel sector and is used within the short term rental market. [3] We haven't discussed migration in this piece and instead relied on the NHSAC estimates for new household formation. Suffice to say migration is a highly politicised issue and risks are likely to the downside given the rhetoric from both sides of the aisle. |

17 Jul 2024 - Performance Report: Skerryvore Global Emerging Markets All-Cap Equity Fund
[Current Manager Report if available]

17 Jul 2024 - Performance Report: Quay Global Real Estate Fund (Unhedged)
[Current Manager Report if available]

17 Jul 2024 - Research in Focus: Fast food companies down, but not out
|
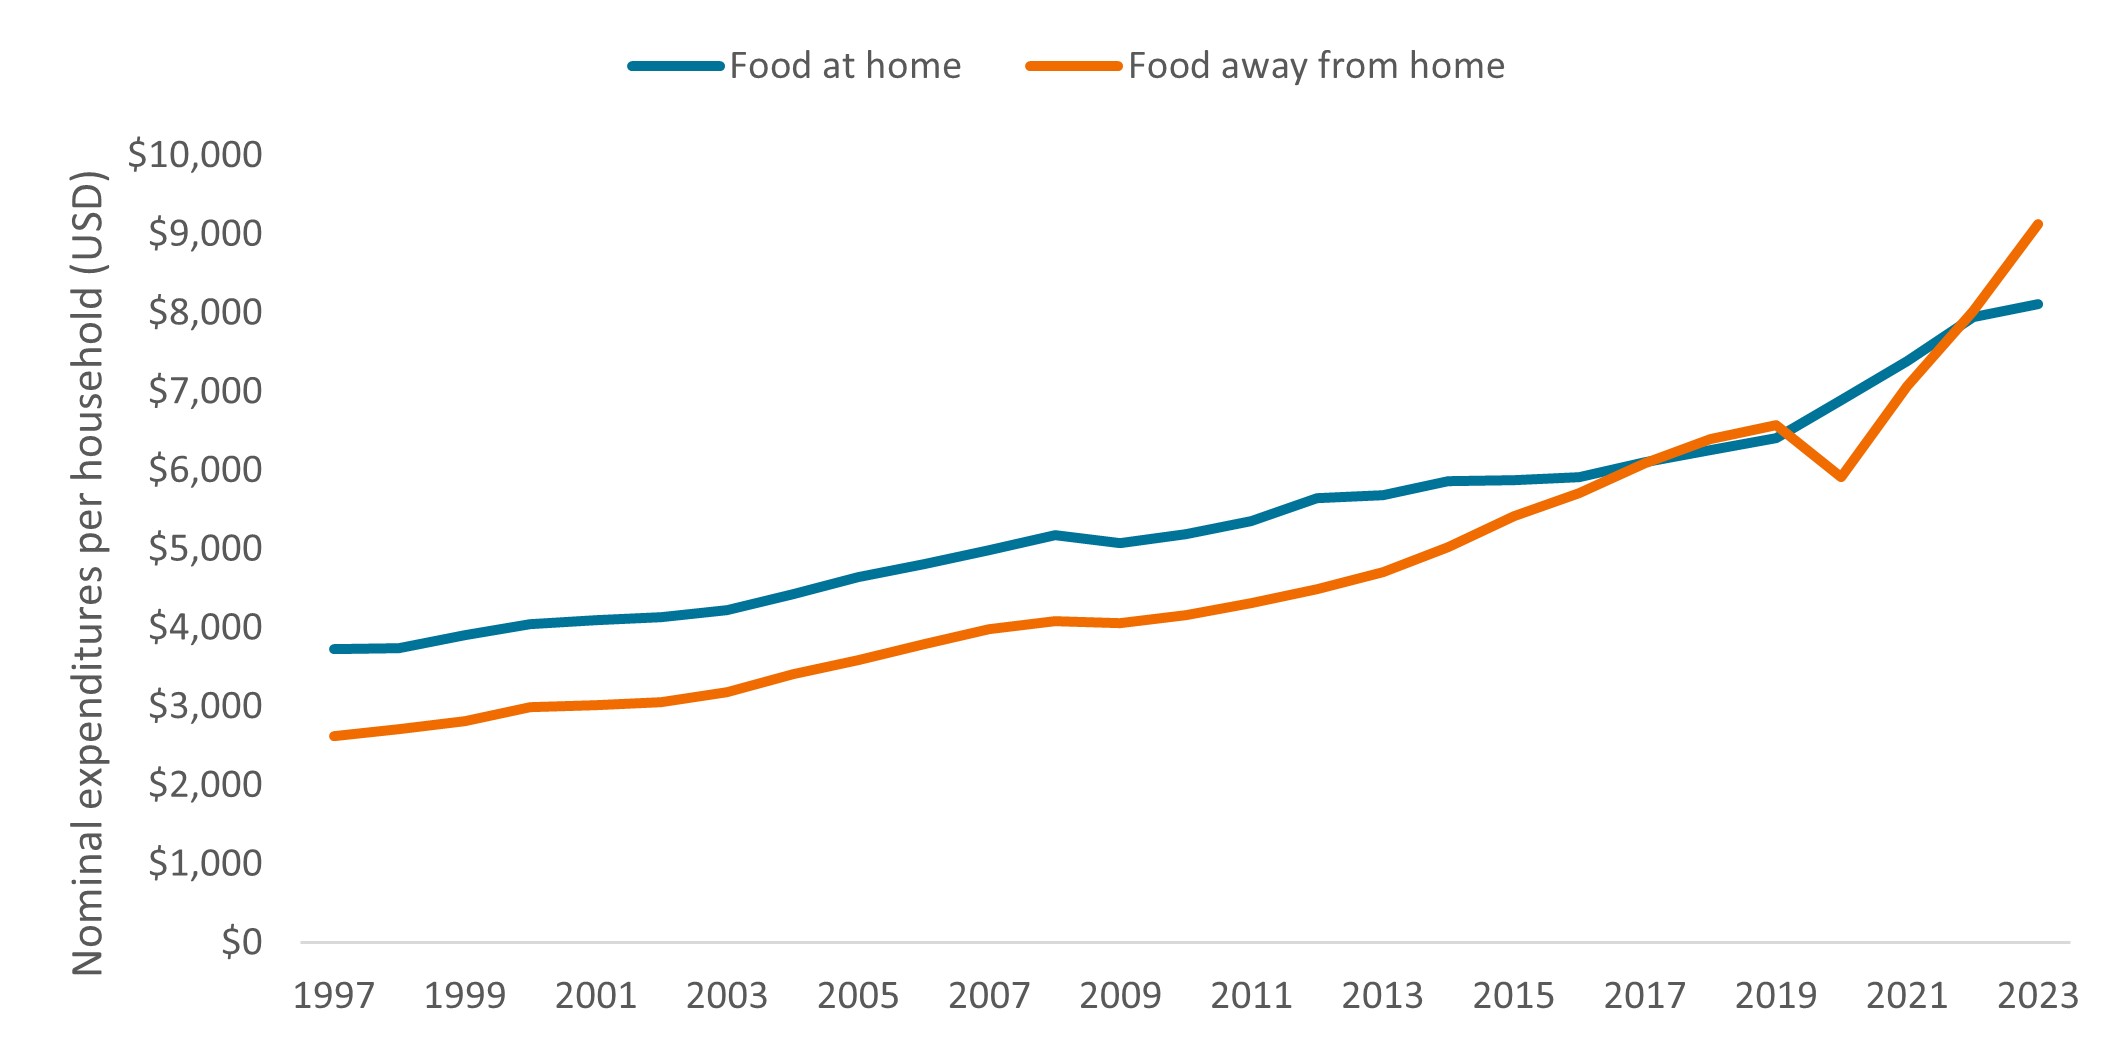
Research in Focus: Fast food companies down, but not out Janus Henderson Investors July 2024 Portfolio Manager and Research Analyst Joshua Cummings, from the Global Research Team, says that while inflation-weary consumers are pushing back against the price of fast food today, the industry's long-term prospects still appear strong. In a time of elevated inflation, anyone might reasonably think the fast-food industry would thrive as consumers seek out low-cost dining options. But judging by recent headlines and viral social media posts, these days, even fast food is getting pushback from cash-strapped consumers. "Americans are choking on surging fast-food prices," said one news report in May. "$18 Big Mac meals," exclaimed another headline, followed by social media posts purporting the famous hamburger deal now costs 100% more than it did five years ago. The furor became so deafening that in late May, Joe Erlinger, president of McDonald's USA, felt compelled to write a "Myth vs. Facts" blog post, defending the fast food chain's price increases. (Fact: the average Big Mac Meal is now $9.29, up only 27% from 2019.1) Even so, the damage has been done: During the latest quarterly reporting period, many fast-food chains reported a decline in year-over-year same-store sales growth. Their stocks have also lagged the broader equity market in 2024. And to win back customers, many companies are rolling out new value deals and adopting a "street-fighting mentality to win." Investor takeawayIn our view, the fast-food saga signals that more households are beginning to feel the cumulative impact of nearly three years of above-average inflation. Whether $5 value deals and other promotions will be enough to win them back in the short term remains to be seen. But we'd encourage investors to also consider longer-term trends and remember that business fundamentals - not headlines - tend to matter more to companies' long-term prospects. Over the last few months, the annual rate of inflation in the U.S. for food away from home (FAFH) has exceeded that of food at home (FAH), but since the pandemic, price increases in the two categories have largely kept pace (albeit with exceptions in some regions due to factors such as local minimum wage laws).2 And eating out has always been more expensive than FAH regardless of the inflation backdrop. Furthermore, data show that when looking at long-term patterns, consumers are increasingly choosing to dine out. The average household spent more on FAFH as a portion of their overall food budget for the first time starting in 2018. And that percentage - with the exception of 2020, during pandemic lockdowns - has continued to climb since (See "By the numbers"). To that end, while growth has recently slowed for some companies, sales are still well above where they were before the pandemic, allowing firms to boast double-digit operating margins. Will inflation reverse this trend? In a recent survey, nearly 80% of Americans said fast food is now a luxury because of price increases. But three-quarters of respondents also said they eat fast food at least once a week, and nearly half said they use store apps to unlock deals.3 In our view, these data points suggest fast food enterprises that are perceived to offer "value" - whether through loyalty programs, new menu items, quick service, and so on - have room for further growth. Geography could also come into play: One popular fast-casual restaurant serving up burritos still has 99% of its stores in the U.S. It is among the most popular fast food options with Americans, and while management has plans to nearly double the domestic footprint, they are also eyeing non-U.S. expansion. In our view, that suggests opportunity for significantly more - not less - growth ahead. By the numbers - U.S. household spending on food at home vs. away from home
Source: Calculated by U.S. Department of Agriculture, Economic Research Service from various sources. As of 3 June 2024. Author: Joshua Cummings, CFA |
|
Funds operated by this manager: Janus Henderson Australian Fixed Interest Fund, Janus Henderson Australian Fixed Interest Fund - Institutional, Janus Henderson Cash Fund - Institutional, Janus Henderson Conservative Fixed Interest Fund, Janus Henderson Conservative Fixed Interest Fund - Institutional, Janus Henderson Diversified Credit Fund, Janus Henderson Global Equity Income Fund, Janus Henderson Global Multi-Strategy Fund, Janus Henderson Global Natural Resources Fund, Janus Henderson Tactical Income Fund
This information is issued by Janus Henderson Investors (Australia) Institutional Funds Management Limited (AFSL 444266, ABN 16 165 119 531). The information herein shall not in any way constitute advice or an invitation to invest. It is solely for information purposes and subject to change without notice. This information does not purport to be a comprehensive statement or description of any markets or securities referred to within. Any references to individual securities do not constitute a securities recommendation. Past performance is not indicative of future performance. The value of an investment and the income from it can fall as well as rise and you may not get back the amount originally invested. Whilst Janus Henderson Investors (Australia) Institutional Funds Management Limited believe that the information is correct at the date of this document, no warranty or representation is given to this effect and no responsibility can be accepted by Janus Henderson Investors (Australia) Institutional Funds Management Limited to any end users for any action taken on the basis of this information. All opinions and estimates in this information are subject to change without notice and are the views of the author at the time of publication. Janus Henderson Investors (Australia) Institutional Funds Management Limited is not under any obligation to update this information to the extent that it is or becomes out of date or incorrect.
|

16 Jul 2024 - Performance Report: Bennelong Emerging Companies Fund
[Current Manager Report if available]

16 Jul 2024 - Performance Report: ASCF High Yield Fund
[Current Manager Report if available]

16 Jul 2024 - Why Anchoring is Sabotaging Your Stock Market Success
|
Why Anchoring is Sabotaging Your Stock Market Success Marcus Today July 2024 |
|
A landscape image representing the stock market and stock market analysis. The background features a digital chart with rising and falling stock prices, candlestick graphs, and financial data overlays. On the side of the image, a large anchor is more apparent and appears submerged into the stock market scene, symbolizing stability amidst the market fluctuations. The overall color scheme includes shades of blue, green, and red to reflect the dynamic nature of the stock market. No ocean or people are present in the image. Understanding Anchoring and Its Impact on Stock Market Investments What is Anchoring in Financial Markets? We all have a lot of trouble buying stocks that have gone up a lot and selling stocks that have gone down a lot. If that's you then I regret to inform you that you are being affected by a well-established financial concept that only affects soft brained investors. It is called "Anchoring". Anchoring, also known as a 'focusing bias', is the use of a reference point against which to judge value. You hear the issue every day in a broking office, it's when someone says "I can't buy that because the share price is up XYZ%" or "You can't sell that the price is down XYZ%". An even more soft brained development on the theme is when you find yourself saying "It's down XYZ% so it's cheap" or "It's up XYZ% so it's expensive". But making money in shares is all about where the share price is going. In that equation, where the share price has been is pretty much irrelevant and the fact that we don't buy or sell a stock because it is up X percent or down X percent, because of where the share price 'was', is unscientific. What you paid for a stock, what price it was in the past, in fact, any reference to the share price history, ignores the only relevant consideration which is what the share price is going to do tomorrow. BHP five years ago was priced on a different set of facts to BHP now, so what relevance is that old high or old low. It's irrelevant. Despite that it is common practice to reference how much a stock has moved from the lowest low or highest high and it is commonplace to take those past prices (laughably - the extreme highs or lows) as an anchor point from which to judge the current price as being expensive or cheap based on how far it is up or down since then. But past prices are simply a statement of where a price was. The more important consideration is what the company is worth now coupled with an understanding that the market's appreciation of what the company was worth at some point in the past has almost certainly changed. As soon as the value of a company changes, which arguably it does every day, you have to move your thinking along. If your decision making starts with a reference point from the past (It's up XYZ% from the low") you have proven yourself a bit amateur. To make a stock judgement past prices are the most unscientific of starting points. Another amateur manifestation of anchoring is buying stocks because they have fallen a lot. This is technically wrong to do (you should sell stocks going down not buy them). Buying bombed-out stocks (catching the knife) because they have fallen a lot, ignores the fact that the market's assessment of the company's value has changed, a lot, for the worse, so the 'attraction' of a big fall is irrelevant. The other very widespread use of anchoring is when traders use their purchase price as a reference point. "I'll sell it if it goes up 10%" or "I'll sell if it goes below my purchase price". All very nice but not rational, although, in its defence, anything, even unscientific anchoring, is better than nothing when it comes to having some trading discipline. An extension of anchoring is 'lazy jargon'. Saying that a stock is "cheap" or "undervalued" because it has fallen a lot. Or "expensive" or overvalued" if it's gone up a lot. A stock can only be valued with reference to what it is worth, not with reference to what the share price used to be. The best way to avoid anchoring is to forget the past price as a reference point and simply assess 'cheap or expensive' on some other criteria. PE history perhaps, or price relative to an intrinsic value calculation would be more useful. Meanwhile you can amuse yourself by listening out for anyone, you perhaps, making comments or decisions on the basis that a stock is up X% or down X% because your sole focus should be whether a stock is going up or not. The fact that it's gone up or not, that, is irrelevant. Anchoring - Another reason humans aren't wired to trade successfully. Author: Marcus Padley |
|
Funds operated by this manager: |

15 Jul 2024 - Performance Report: Delft Partners Global High Conviction Strategy
[Current Manager Report if available]

15 Jul 2024 - 10k Words | July 2024
|
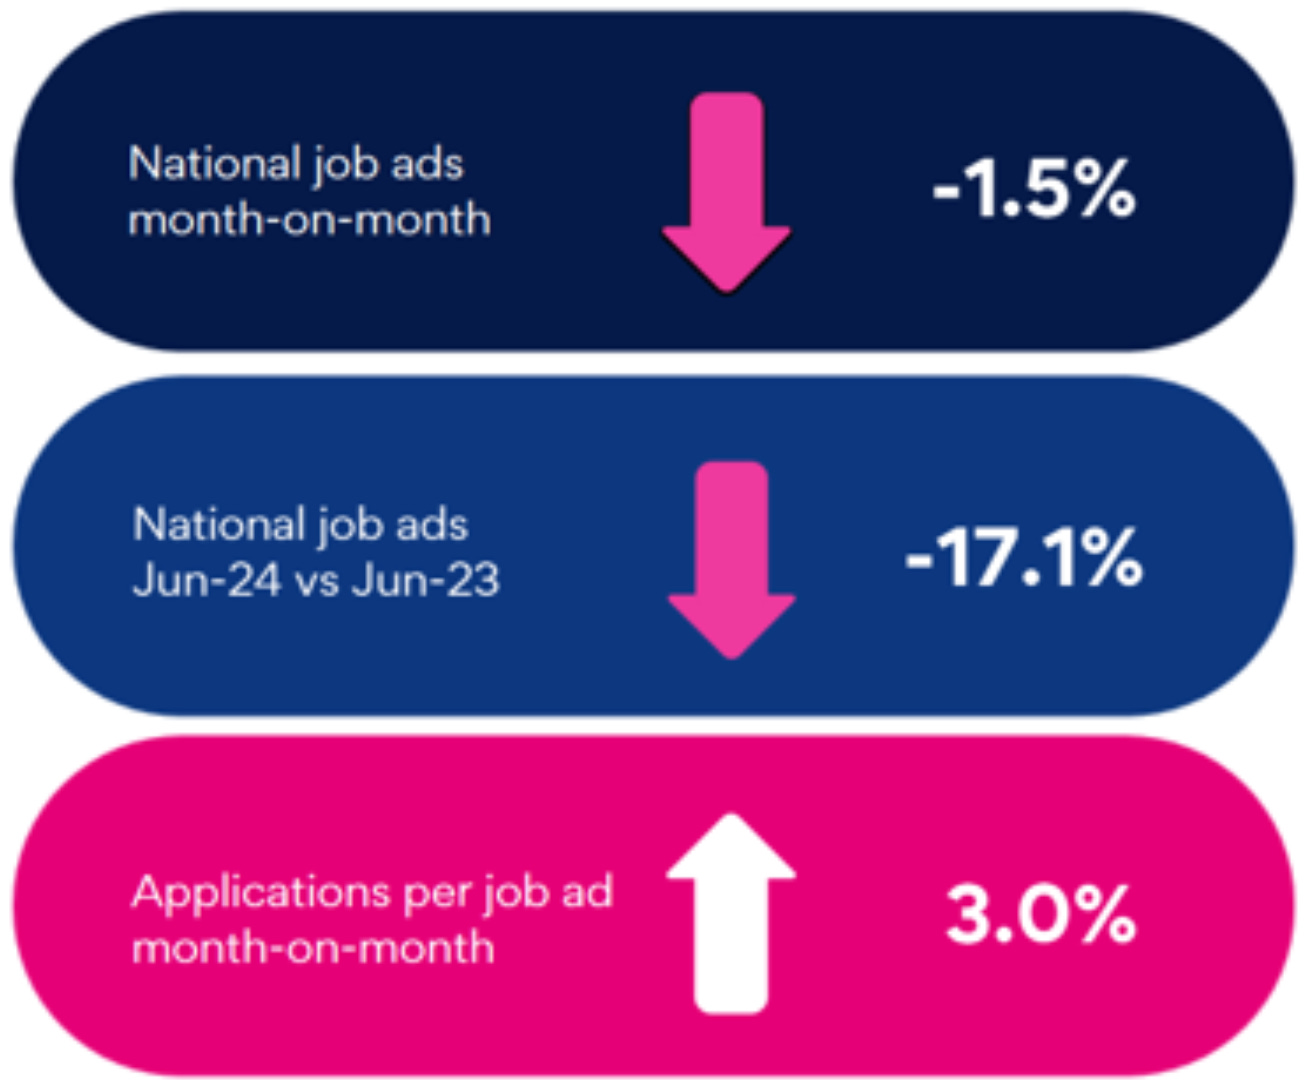
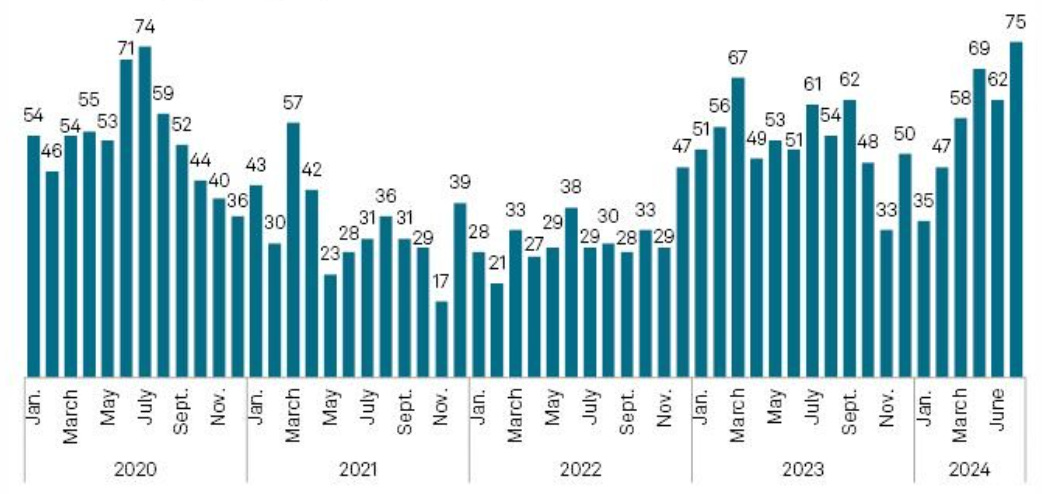
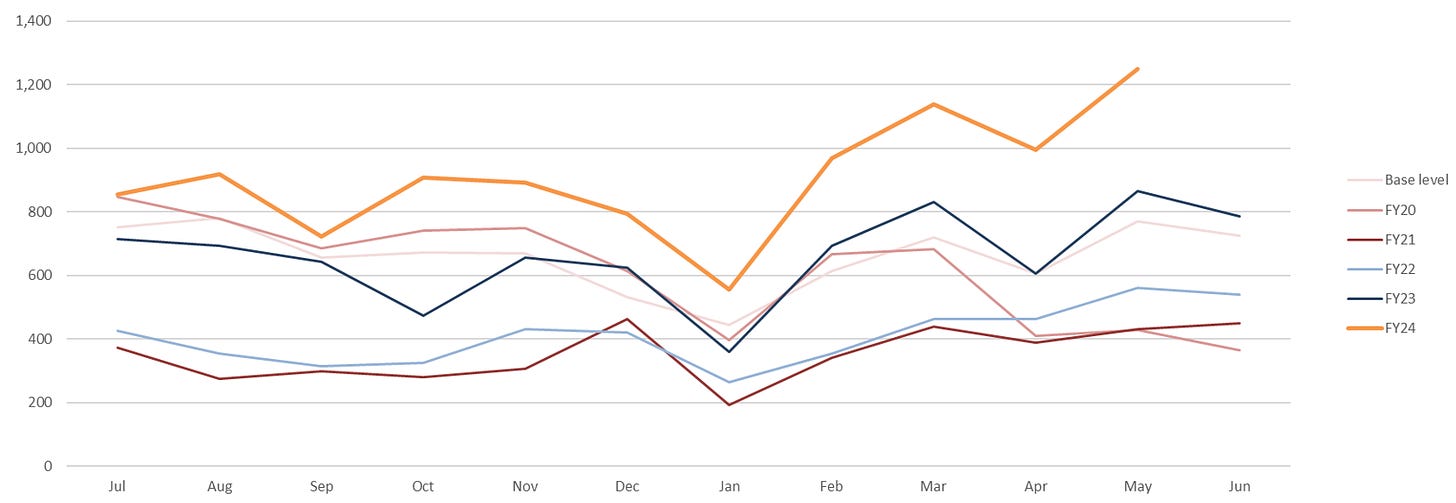
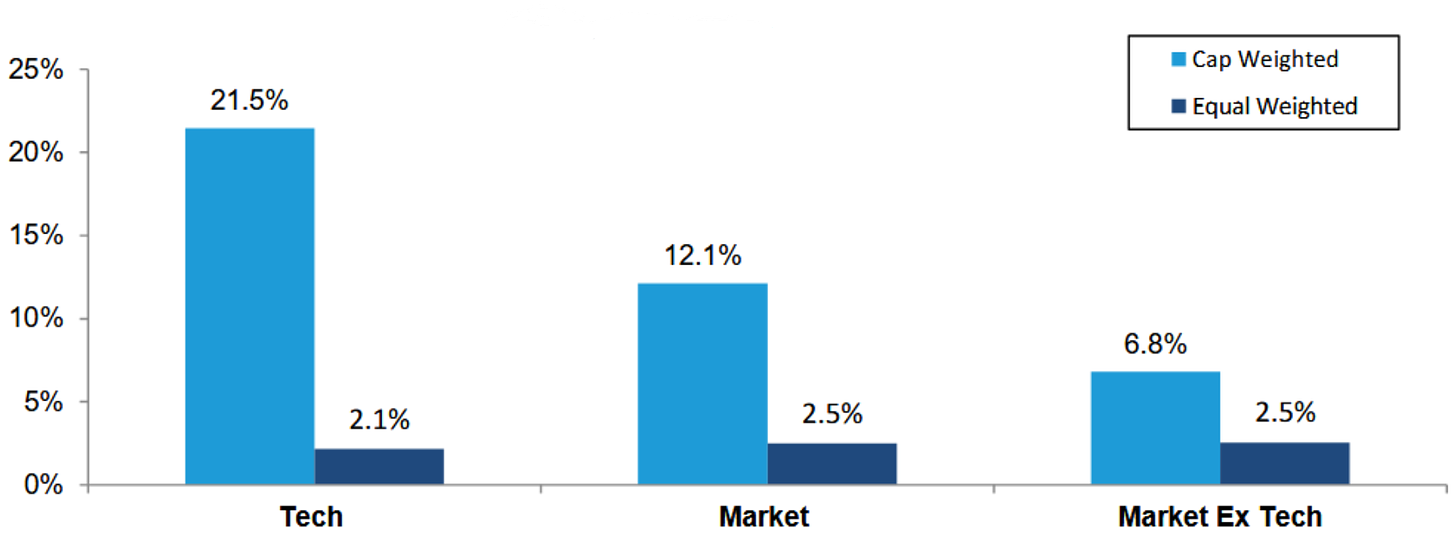
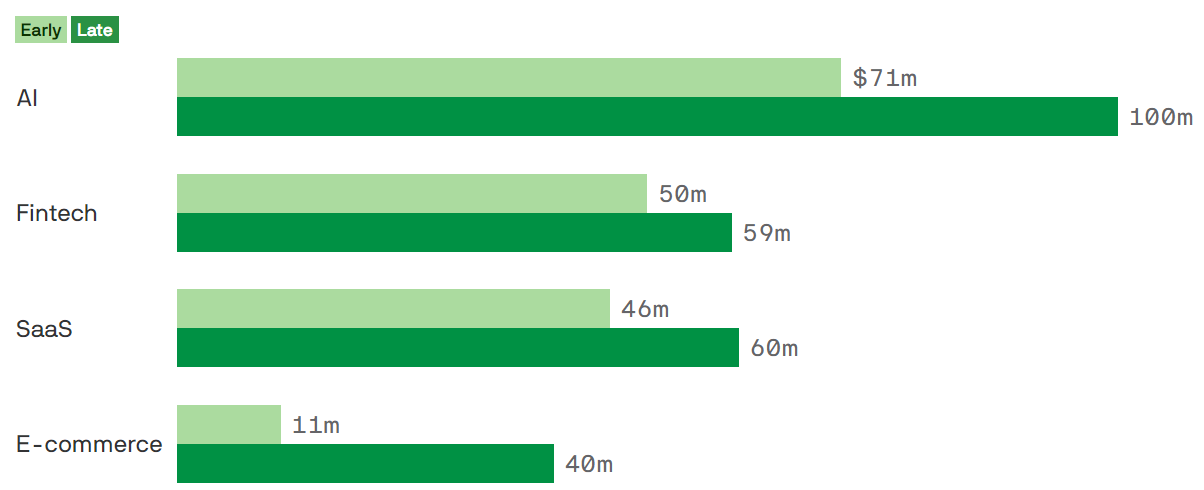
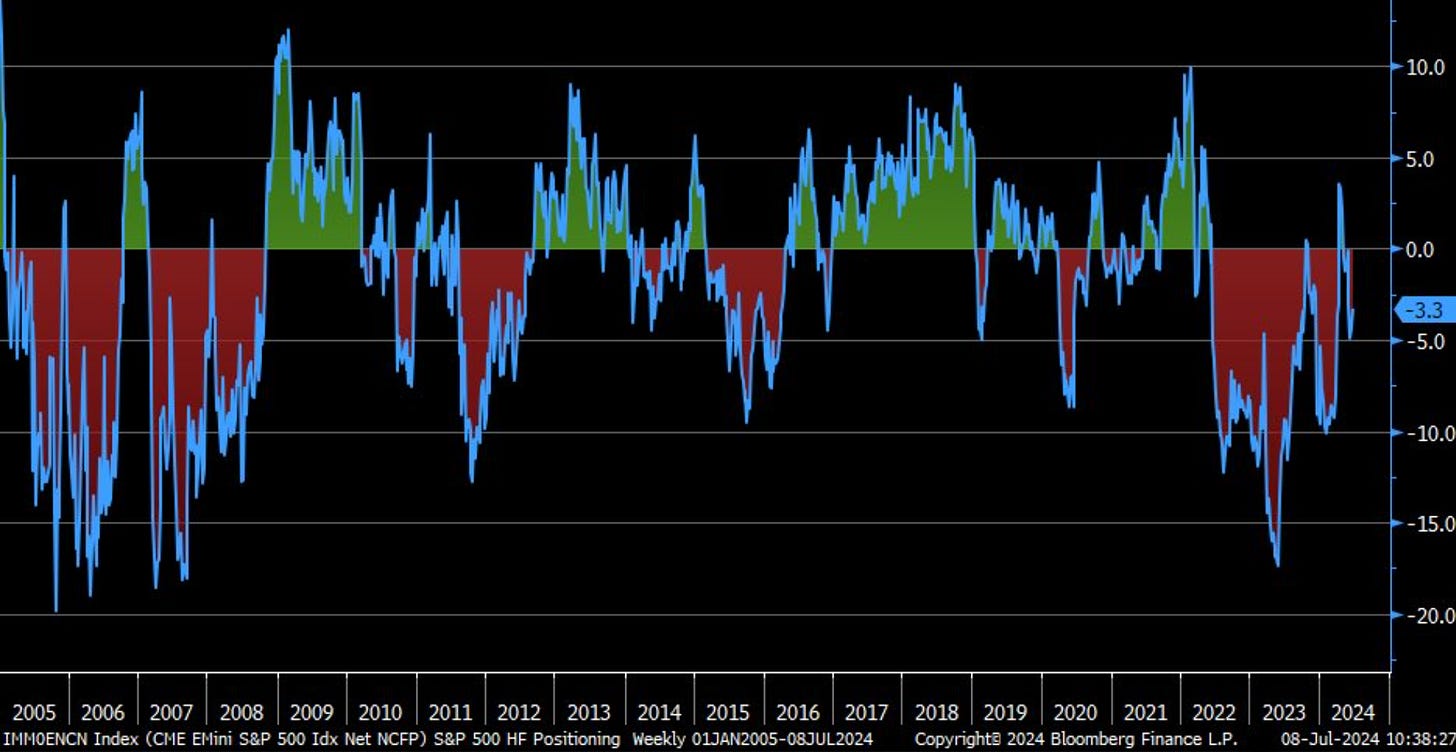
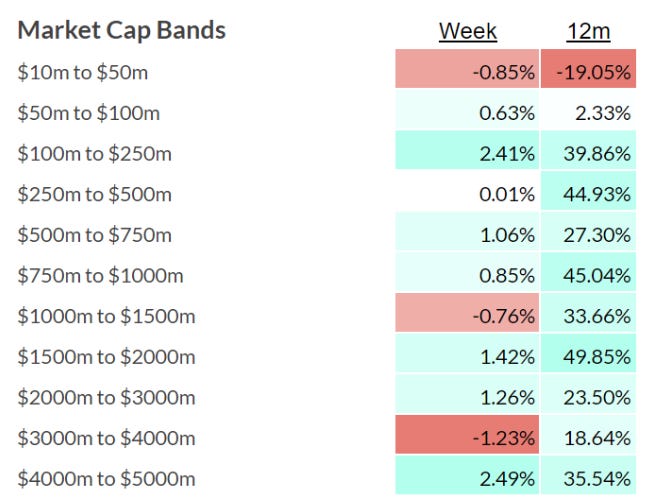
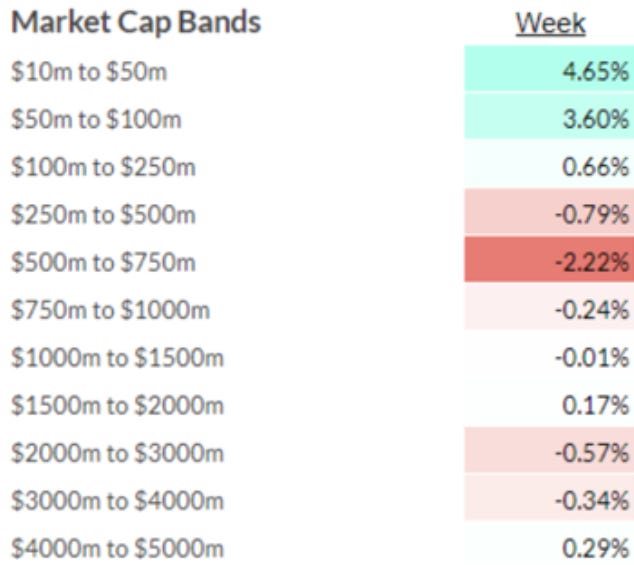
10k Words Equitable Investors July 2024 Seek's national job ads count is down 17% over 12 months; corporate bamkruptcy/administration filings at multi-year highs; equal-weighted tech stocks are lagging cap-weighted tech performance by even more than the broader US market; AI valuations holding up VC space too; sustained net short positon on S&P 500; ASX nano/micro caps and the seasonal performance driven by tax loss selling in June, with a rebound in July; and finally the volume of downgrades coming into ASX reporting season is in-line with prior years. Seek's June 2024 Australian job ads
Source: Seek US bankruptcies by month
Source: S&P Australian external administration appointments by year
Source: ASIC 2024 YTD absolute performance - tech v. rest of the market
Source: Bernstein via @modestproposal1 2024 VC-backed tech valuations of select verticals, by stage
Source: Axios E-Mini S&P 500 net non-commercial futures positions % of open interest
Source: @LizAnnSonders, Bloomberg ASX ex-resoures by market cap band over 12 months of CY2024
Source: Equitable Investors
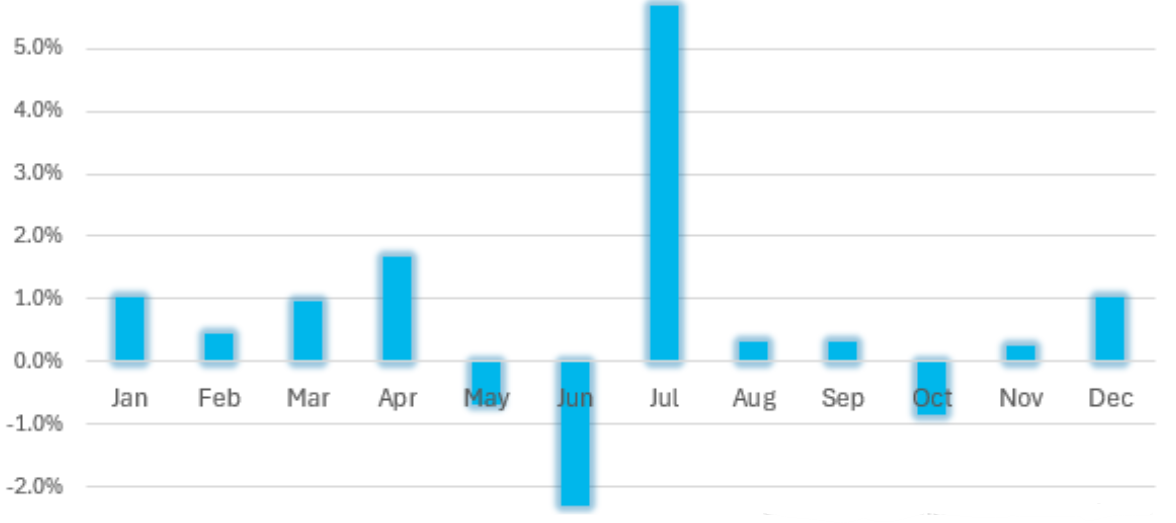
ASX ex-resoures by market cap band - first week of FY2025 Source: Equitable Investors Average monthly return of S&P/ASX Emerging Companies Index (since March 2016, excluding COVID-impacted CY2020)
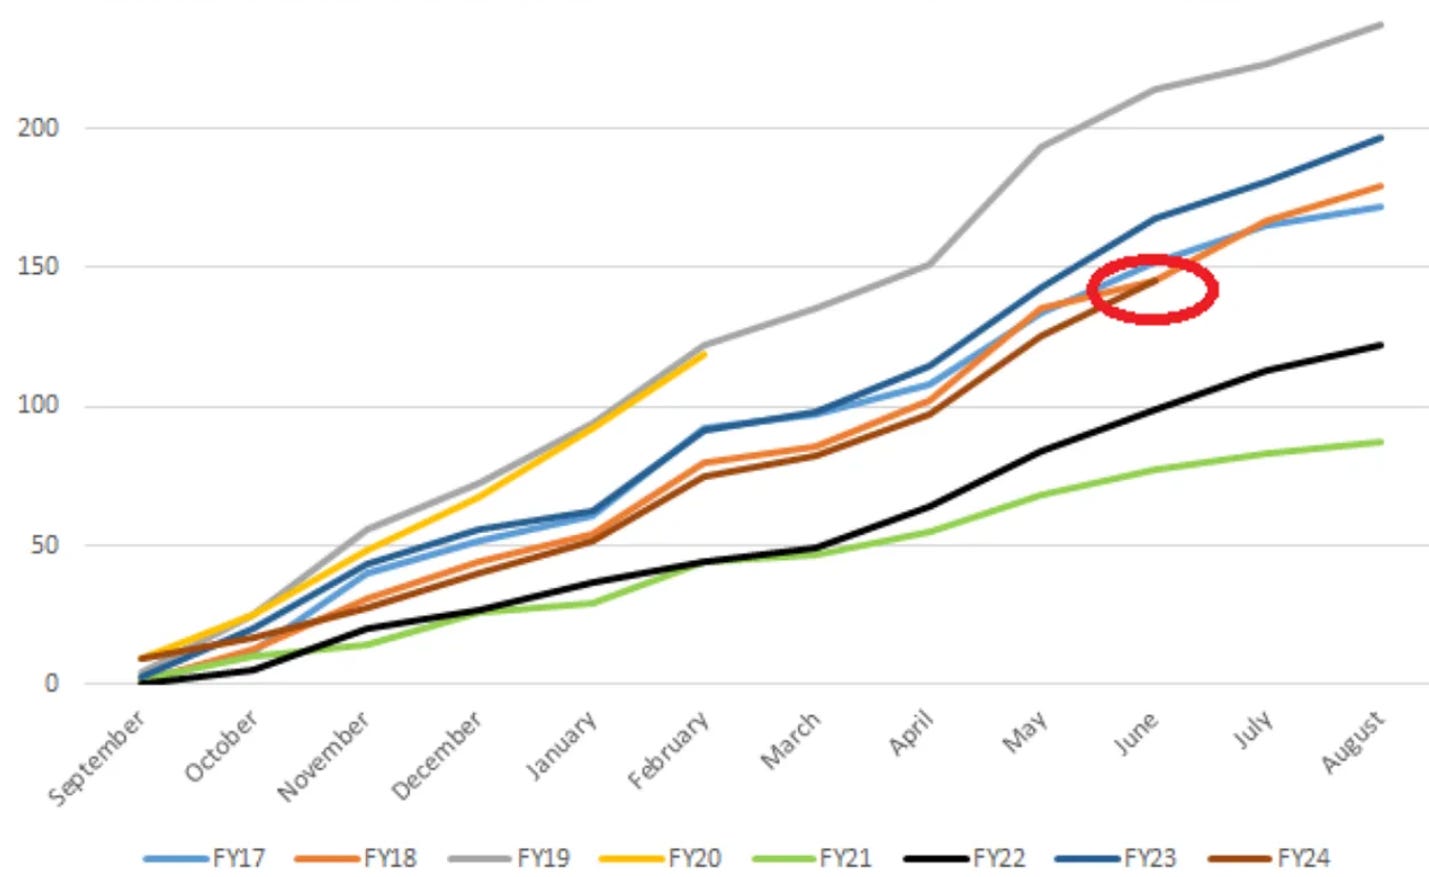
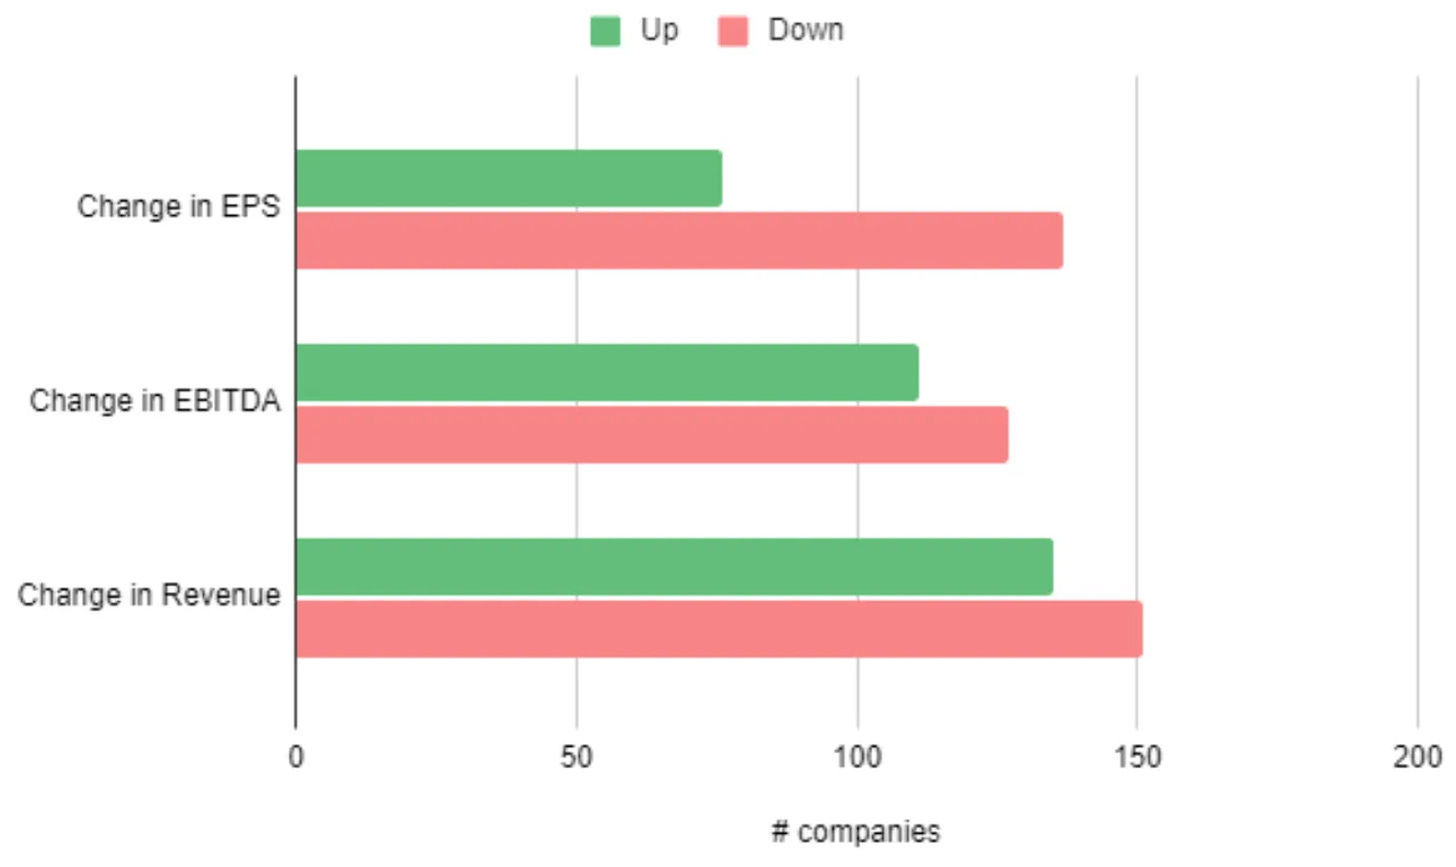
Source: Equitable Investors Number of ASX downgrades - comparison with past financial years (FY20 cut short by COVID) "FIT" universe (ASX micro-to-mid, ex resources) - changes to consensus estimates over past 12 months Source: Equitable Investors July 2024 Edition Funds operated by this manager: Equitable Investors Dragonfly Fund Disclaimer Past performance is not a reliable indicator of future performance. Fund returns are quoted net of all fees, expenses and accrued performance fees. Delivery of this report to a recipient should not be relied on as a representation that there has been no change since the preparation date in the affairs or financial condition of the Fund or the Trustee; or that the information contained in this report remains accurate or complete at any time after the preparation date. Equitable Investors Pty Ltd (EI) does not guarantee or make any representation or warranty as to the accuracy or completeness of the information in this report. To the extent permitted by law, EI disclaims all liability that may otherwise arise due to any information in this report being inaccurate or information being omitted. This report does not take into account the particular investment objectives, financial situation and needs of potential investors. Before making a decision to invest in the Fund the recipient should obtain professional advice. This report does not purport to contain all the information that the recipient may require to evaluate a possible investment in the Fund. The recipient should conduct their own independent analysis of the Fund and refer to the current Information Memorandum, which is available from EI. |

