
NEWS

29 Sep 2021 - Reduce your risk and pick outstanding companies
|
Reduce your risk and pick outstanding companies Emma Fisher, Airlie Funds Management September 2021 Despite the record reporting season past and the major wall of cash returned to investors this year, we at Airlie can't help but feel things in markets are a little gloomy. We believe that this is due to two sources of dismay.
In cutting through this doom and gloom we think it is important to talk about uncertainty and risk. It may seem obvious, but it is worth pointing out that uncertainty and risk are different concepts. We think the market is pretty bad at distinguishing between the two and punishes both evenly. Uncertainty is not knowing what is going to happen in the future. Put this way, you realise uncertainty is a fact of investing and ultimately a fact of life. In our view, uncertainty in markets creates opportunity. We're always looking for the uncertainty that may create a mispriced asset. What we don't like is risk. Risk is the chance of a permanent loss of capital and in our view, often comes down to two reasons:
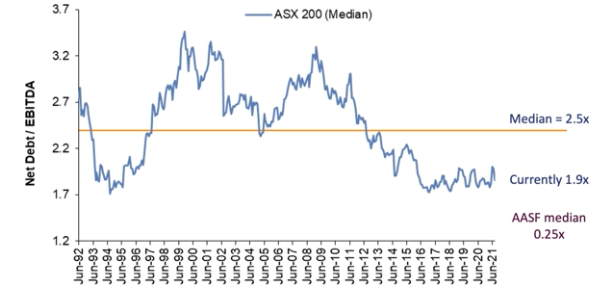
At Airlie, we use a four-stage investment process tailored specifically to take advantage of uncertainty while minimising risk. #1 Focus on financial strengthStrong balance sheets The first place we always start is with a focus on the balance sheet. Making sure that the financial position of our companies is rock-solid is the first way that we limit the permanent loss of capital. These businesses can weather the storm of whatever markets throw at them and help portfolios perform through all cycles. When we consider the share market as a whole, it's important to note that balance sheet risk is much lower than it has been historically. Over the last few decades, net debt to EBITDA has had a median of 2.5 times. Right now it's much lower at about 1.9 times. This is a good sign. While we believe valuation risk is highly elevated right now, the lowered level of balance sheet risk is in essence telling us to proceed with caution at the moment. Heading into the GFC, both measures of risk were highly elevated. If you were to consider it as two signals - we had both lights showing red. Right now we see one showing orange and one showing green.
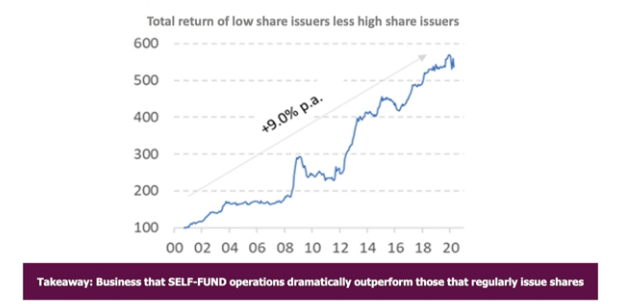
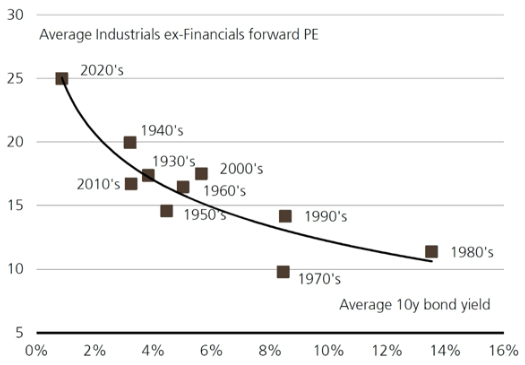
Self-funding businesses The other element of financial strength we like to consider is whether the business is self-funding its operations. This is simply because it has been proven that over the long term that these businesses outperform. They are able to fund their own growth profile through earnings and do not dilute shareholder capital. Alternatively, the businesses that are constantly tapping the market for equity to sell investors the dream and fund the business growth underperform, as seen below. #2 Don't overpayWhen investors reflect on the 2001 tech bubble, it is important to remember that it wasn't only tech stocks caught up in the hype. If you bought Disney, Coca-Cola or Walmart at their peak during that period, you would have had to wait 11 to 16 years to get your money back. Investing during peak periods is a real risk to a permanent loss of capital. Now we don't believe that we are at similar levels in the Australian market but we do see pockets of extremely optimistic valuations. As the risk-free rate falls, the multiples you have to pay for future cash flows increases. Right now markets have never been more expensive since yields have never been this low. In our view, if you're investing in the most expensive parts of the market, you're taking a bet against bond yields. And that's not a risk we are comfortable taking. #3 Buy quality businessesAt Airlie, we see quality businesses as those with a high return on capital. This is because, for every dollar that is earned by a business, a greater portion will be returned to shareholders and not lost in capital expenditures. The issue that unfortunately presents itself here, is that high-quality businesses can often be the most expensive. Therein lies the greatest challenge of this current market and what we look for in our investments - which are the quality businesses available at good prices. We believe there are three main reasons why a high-quality business may not trading at high valuations.
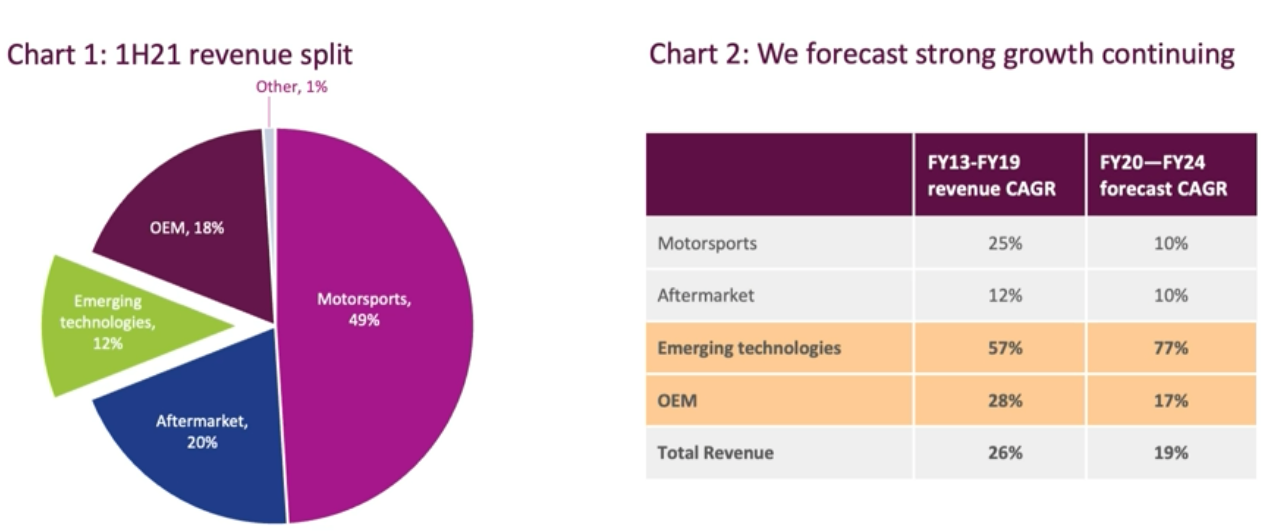
The best example of a past "jewel in the crown" business is Wesfarmers (ASX: WES). It was not until the demerger of Coles that Bunnings was able to shine as one of the best businesses in Australia. Bunnings generates a return on capital of more than 70%, so when Bunnings went from a third of WES' earnings to 70%, Wesfarmers re-rated. We believe a similar unlocking of value is happening with Tabcorp (ASX: TAH). We believe Tabcorp's lottery business deserves a very high valuation. This business has proven to be a resilient growth story over time. Their growth is underpinned by state monopoly licenses that run for decades in most states and an ever-increasing spend on lottery tickets online, meaning they no longer have to pay a commission to the newsagent. The issue is that the wagering division of the business proves to be somewhat of a problem child. The wagering arm doesn't offer the same attractive low cost of capital, and many investors who would be interested in the lotteries business do not want exposure to the gaming division. So the answer the company is pursuing here is a de-merger. We think in about a year's time Tabcorp will be worthy of a significant re-rate. #4 Find good managementThe final factor of focus in reducing risk is finding businesses with good management teams and founder-led businesses. We like these companies because it often means that management tends to focus on the long term, their interests are aligned with shareholders, and they are passionate about the business. An example of one of these businesses we are really excited about is PWR Holdings (ASX: PWH). PWR is also an example of a company we think is currently flying under investor's radar. Most of the company's revenue comes from selling cooling systems to motorsports companies. The founder and CEO, Kees Weel, started his business as a mechanic in the 70s. After a while, he decided he would give making radiators a try. Now, 40 years later, he's making the best radiators in the world and is the radiator supplier of every Formula One team. But it's not only the motorsports arm that excites us. In our view, the most exciting reason to own PWR is the growth happening in the emerging technologies division.
They are currently working on the development of cooling systems for electric vehicles. This is likely to be a huge secular growth area for the company over the next few decades. Additionally, the team is working with a number of exciting companies to develop cooling systems in aerospace and defence applications. The passion their CEO Kees Weel has for the business and his staff is why we love founder-led businesses. Earlier this year we had a chance to visit the PWR headquarters in the Gold Coast and at the first stop of our site tour, Kees presented us all with a copy of the company's yearly cookbook. Kees showed us the on-site cafeteria that had been built so that the welders and engineers could have healthy, freshly cooked meals for free. That sort of passion for the culture and experience of the team is really infectious and something we love to see in the companies we invest in. Summing it all upIn conclusion, we want to highlight the importance of the difference between uncertainty and risk. While we love uncertainty, like the doom and gloom we see in markets, we hate risk. In our view, these four factors are the key to reducing risk and creating long term wealth. Invest where fair value exceeds market price We identify Australian companies based on their financial strength, attractive durable business characteristics and the quality of their management teams. The above article is a summary of the recent webinar hosted by Matt Williams and I. |
|
Funds operated by this manager: Airlie Australian Share Fund |

28 Sep 2021 - Performance Report: Laureola Australia Feeder Fund
| Report Date | |
| Manager | |
| Fund Name | |
| Strategy | |
| Latest Return Date | |
| Latest Return | |
| Latest 6 Months | |
| Latest 12 Months | |
| Latest 24 Months (pa) | |
| Annualised Since Inception | |
| Inception Date | |
| FUM (millions) | |
| Fund Overview | Life Settlements are resold life insurance policies and can be thought of as a form of finance extended to an individual backed by the person's life insurance policy. This financing is repaid upon maturity by collecting the death benefit from the insurance company. Risk mitigation measures implemented by Laureola include science-driven due diligence of policies, active monitoring of insured through a vertically integrated operation, and investor aligned fund design. |
| Manager Comments | Laureola noted they're very happy with that result given the Fund's size. The average size of the matured policies ytd is about $500k, 2/3rds the average size of the policies in the portfolio, which has had a small negative effect on performance. But, they noted, the number of policies is a strong indication that the portfolio is being managed properly, and also indicates that it is not due to luck or randomness. It highlights the quality of the posted returns: 75% of the total returns for the year have come from realised gains. |
| More Information |

28 Sep 2021 - Performance Report: Bennelong Twenty20 Australian Equities Fund
| Report Date | |
| Manager | |
| Fund Name | |
| Strategy | |
| Latest Return Date | |
| Latest Return | |
| Latest 6 Months | |
| Latest 12 Months | |
| Latest 24 Months (pa) | |
| Annualised Since Inception | |
| Inception Date | |
| FUM (millions) | |
| Fund Overview | The Fund is managed as one portfolio but comprises and combines two separately managed exposures: 1. An investment in the top 20 stocks of the markets, which the Fund achieves by taking an indexed position in the S&P/ASX 20 Index; and 2. An investment in the stocks beyond the S&P/ASX 20 Index. This exposure is managed on an active basis using a fundamental core approach. The Fund may also invest in securities expected to be listed on the ASX, securities listed or expected to be listed on other exchanges where such securities relate to ASX-listed securities.Derivative instruments may be used to replicate underlying positions and hedge market and company specific risks. The companies within the portfolio are primarily selected from, but not limited to, the S&P/ASX 300 Accumulation Index. The Fund typically holds between 40-55 stocks and thus is considered to be highly concentrated. This means that investors should expect to see high short-term volatility. The Fund seeks to achieve growth over the long-term, therefore the minimum suggested investment timeframe is 5 years. |
| Manager Comments | The fund's returns over the past 12 months have been achieved with a volatility of 9.84% vs the index's 10.33%. The annualised volatility of the fund's returns since November 2009 is 13.71% vs the index's 13.23%. Over all other periods, the fund's returns have been more volatile than the index. The fund's Sharpe ratio has ranged from a high of 3.33 for performance over the most recent 12 months to a low of 0.85 over the latest 36 months, and is 0.75 for performance since November 2009. By contrast, the ASX 200 Total Return Index's Sharpe for performance since November 2009 is 0.53. Since November 2009 in the months where the market was positive, the fund has provided positive returns 97% of the time, contributing to an up-capture ratio of 128.82%. Over all other periods, the fund's up-capture ratio has ranged from a high of 144.85% over the most recent 24 months to a low of 124.9% over the latest 60 months. An up-capture ratio greater than 100% indicates that, on average, the fund has outperformed in the market's positive months. |
| More Information |

28 Sep 2021 - Global small caps: From unrecognised growth to future global titans
|
Global small caps: From unrecognised growth to future global titans Tobias Bucks and Simon Wood, Ausbil Investment Management September 2021 |
|
Small companies offer the potential for growth that can exceed their larger peers over the long term, an assertion supported by the data. Small Companies offer investors early stage entry into names destined to become future global titans. Tobias Bucks and Simon Wood from Ausbil's global small-cap team answer some key questions on how to access such unrecognised opportunities. Q: Can you give us the elevator pitch for what you do? TB: We find global companies that are early in their stages of development, are not actively covered yet by the market, and have latent, unrecognised growth prospects with the potential for major rerates and sustainable unrecognised earnings growth. Finding uncovered 'gems', the names that offer what we call 'unrecognised growth' is where an active global investment manager like Ausbil can help investors take advantage of smallcap idiosyncrasies, while helping to reduce the typical level of risk that come with early-stage small-cap investing. We like global small caps because over the long-term, smaller companies consistently show outperformance against their larger peers, as evidenced in Chart 1 Chart 1: Small is beautiful: The compelling performance of smaller companies From Chart 1, since the inception of the MSCI indices in 2000, small companies have compounded well in advance of mid and large-cap peers. Over this twenty-plus years, small caps have risen by a factor of almost 6-times, mid caps buy almost 4-times, and large caps by the best part of 2.5-times. The outperformance of small companies has been shown consistently in the empirical long-term evidence provided by esteemed researchers such as Siegel (2015). Banz (1981) and Fama and French (1992), and in the market data. Q: Can you explain the term, 'unrecognised growth'? SW: Unrecognised growth is where a company exhibits the signs and potential for future earnings growth that is conceptually ahead of peers or the market in general, but for which there is no consensus as the company is not yet covered by a bevvy of institutional analysts. The company is 'unrecognised' because, due to size, it is yet to become large enough to warrant broad institutional coverage. Chart 2 illustrates how analyst coverage changes as companies become bigger. Global small caps operate in a 'sweet spot' of opportunity that has yet to be noticed or acknowledged by the institutional equity research machine. Chart 2: What 'unrecognised' looks like Ausbil's global small-cap team seeks the opportunities in the 231 developed markets in which we invest before any reliable institutional consensus has been established. In the case of some companies, there might be a consensus based on the views of a handful of analysts, as illustrated in Chart 1, but there is typically a significant divergence in views on valuation, opportunity and risk. The essential idea is that we focus on companies where growth will surprise, in companies that are attractively valued, and which we believe demonstrate relatively less risk in proportion to the opportunity. Combined with a lack of analyst coverage, forward surprise potential at attractive valuations reveals companies with unrecognised growth, which ultimately drives share prices. Q: Why do these companies go 'unrecognised' for a period of time? TB: Fast growing smaller companies are proving their business models, their sales and earnings can be volatile, and their businesses can be undiversified in terms of steady-state earnings. Institutions, like insurance companies which are not specialist small-cap investors, typically look for larger-cap equities with steady historical earnings, and more mature business models. However, large super and pension funds often carry significant allocations to small cap equities for the superior long-term returns they can offer in equity portfolios. Small companies, when the fundamentals are sound, the management is strong, and the business model is relatively unassailable, can offer upside potential for investors who are comfortable with riding-out shorter term bursts of volatility. From the sell-side perspective, small companies are often supported by specialist financiers, angel investors, cornerstone investors, large insider holdings and small broking houses in their early years, before they graduate into the bigger leagues and into larger capital raisings with larger investment banks. This creates significantly more opportunity for astute smallcap investors to participate in funding rounds for businesses that are on a trajectory for major growth, ownership transition events and other ongoing capital raisings and block trades that offer the potential to steadily build positions in companies with the potential to become the next global titans. Q: In your experience, what are the features of a good unrecognised opportunity? SW: Our fundamental and quantitative research seeks to unearth the unrecognised winners that have a high probability of earnings upgrades. Chart 3 illustrates how, to date, we have been able to consistently track ahead of the market on capturing earnings upgrades. Chart 3: Beating the consensus on identifying quality and upgrades There is no exact template for finding companies with significant unrecognised growth that are also in the process of exceeding market expectations on earnings growth, however there are some key elements that appear in the excellent examples we have found in the past. A great, unrecognised growth company often starts as a niche leader, that has global ambitions and products that are capable of contesting position in the global market place. Unrecognised growth companies often invest capital into their own expansion, as opposed to paying higher dividends, as they are able to earn a greater return on capital for investors through reinvestment. Quality unrecognised growth companies seek expansion, but not at the expense of strong ESG characteristics, which ensure critical elements are in place for successful expansion: strong corporate governance; and low environmental and social risks. An attractive company that exhibits unrecognised growth offers the potential for earnings surprise in future years, which ultimately draws the attention of the institutional market and eventually catalyses significant re-ratings. It may be an oft-repeated cliché, but what holds all together, from the development of great strategy to the execution of a successful local and global business strategy, is the quality of leadership. Great unrecognised growth companies invariably boast great management. People matter in successful companies, and as active investors, we are well positioned to meet with, review, question and assess management as part of our due-diligence process. Q: What about risk? Aren't small caps riskier investments than larger companies? SW: In theory, small caps should be riskier than larger companies when compared on crude measures of diversified income and size, however, when adjusted for risk, small caps can be surprisingly rewarding. As illustrated in Charts 1 and 4, using the Sharpe Ratio measure of risk adjusted returns, global small caps typically demonstrate a superior risk-adjusted returns (higher Sharpe ratios), than both mid and large-cap stocks. Moreover, an active investment approach can increase this Sharpe ratio through concentration in high-quality unrecognised growth companies, and the active avoidance of low quality small caps that do not match the criteria we apply. Chart 4: The risk-return profile of small caps in perspective
In taking a wider range of risks into consideration with the application of additional ESG risk filters, it is possible to further improve the risk-return outcome for small caps. ESG considerations can help reduce many tangible and intangible, un-quantifiable risks that help select winners and deselect losers in the risk-return equation. 5 Contactus@ ausbil.com.au Finally, liquidity management is key to success in global small-cap investing. Unlike mid and large-cap stocks that typically have deep order books in the marketplace, global small caps can display shallower order books, to the point of illiquidity. A company needs market trade flow in order for the execution of a clean investment thesis through the clean entry and exit of positions. In an illiquid stock, news can hamper the ability of investors to trade or exit. Ausbil manages exposure to liquidity risk very closely, and we will not enter positions that we cannot exit at any time, and within a reasonable timeframe. Relative to all small caps, this further improves the riskreward positioning of our approach, and can also materially improve our Sharpe ratio. In today's volatile markets, large companies are not a guaranteed mitigation for risk. The market has rapidly sold down many large caps regardless of size, and institutional share registers can be brutal to large caps, as much as they can to smaller companies. Q: So can you give us some examples of what a great, unrecognised growth story looks like? TB: Australia is only 2% of the world market. There is a lot of potential on offer in the other 98% of markets, and a lot of companies and sectors that are just not available in Australia. Moreover, small caps in larger markets have a natural advantage in being 'small fish in very large ponds'. One such company is theTradeDesk (TTD). The Global SmallCap Fund invested in TTD in June 2018. At the time, TTD was marketing online banner ads and content that rivalled Google Ads, but protected the identity of advertisers. TTD was a small fish in a very large pond, but it offered a compelling challenger solution to the dominant player in one of the world's most profitable spaces. TTD displayed many of the crucial characteristics we look for as a sign of quality, unrecognised growth. It was a niche leader in digital advertising, with global expansion ambitions for developed and emerging markets. It offered new and unique products, especially in universal IDs that was not being offered by Google. The management team were already proven, and reinvesting a growing earnings stream back into expansion of the business. With strong ESG credentials and a focus on improved data privacy, a competitive edge in the market, TTD was able to build and expand, and generate earnings surprises that were not recognised by the market. The result is that from the $87 entry price in June 2018, earnings surprises drove the stock price to $900 by January 2021, at which time the Fund exited, with TTD graduating 'with honours' as an emerging global titan, moving from the Fund's benchmark into the mid-cap benchmarks. Another example from the Fund's portfolio is Generac, a world leader in generators, based in the United States. Generac (GNRC) is another company that demonstrates the features of an emerging global titan, similar to our experience with TTD. Generac started as a niche leader in generators and smart energy. Growth ambition has since seen it expand globally, into South America and Europe. GNRC has expanded its product offering into inverters and smart grid tech, further investing through accretive mergers and acquisitions that expand both its capabilities and its footprint. GNRC has strong ESG credentials, especially with its link to future sustainable energy demand, and like TTD, it has a highly regarded management team. The Fund has seen its investment to date rise to over $280, from an entry point of $50 in May 2018, with the stock a key holding for future earnings surprise. Q: Can you summarise the benefits of adding global small caps to a portfolio? SW: We think the proposition for investors is simple. Global small caps offers a superior riskadjusted return from a global opportunity set of companies, many of which are not represented in Australian equity sectors. The opportunity to invest early in the next theTradeDesk, Google or even Tesla are waiting to be discovered in these 23 developed markets. They are not common, but with the criteria we apply in selecting companies demonstrating superior unrecognised growth potential, we believe the odds are significantly shortened for investors capturing the growth of future global titans. |
|
Funds operated by this manager: Ausbil 130/30 Focus Fund, Ausbil Australian Active Equity Fund, Ausbil Global SmallCap Fund, Ausbil MicroCap Fund |
|
References Banz, R. W. (1981). The Relationship between Return and Market Value of Common Stocks. Journal of Financial Economics, 9(1), 3-18. Fama, E.F. & French. K.R. (1992). The Cross-Section of Expected Stock Returns. The Journal of Finance, 47(2), 427. Siegel, J. J. (2013). Stocks for the long run: The definitive guide to financial market returns and long-term investment strategies. New York: McGraw-Hill. DISCLAIMER Important Information: Australia, Canada, Denmark, Kuwait, Netherlands, Sweden, United Arab Emirates, USA, United Kingdom. General Research provided to a client may vary depending upon various factors such as a client's individual preferences as to the frequency and manner of receiving communications, a client's risk profile and investment focus and perspective (e.g., market wide, sector specific, long-term, short-term, etc.), the size and legal and regulatory constraints. This information is for distribution only as may be permitted by law. It is not directed to, or intended for distribution to or use by, any person or entity who is a citizen or resident of, or located, in any locality, state, country or other jurisdiction where such distribution, publication, availability or use would be contrary to law or regulation or would subject Ausbil to any registration or licensing requirement within such jurisdiction. This information is a general communication and is educational in nature; it is not an advertisement nor is it a solicitation or an offer to buy or sell any financial instruments or to participate in any particular trading strategy. Nothing in this document constitutes a representation that any investment strategy or recommendation is suitable or appropriate to an investor's individual circumstances or otherwise constitutes a personal recommendation. By providing this document, none of Ausbil or its representatives has any responsibility or authority to provide or have provided investment advice in a fiduciary capacity or otherwise. Investments involve risks, and investors should exercise prudence and their own judgment in making their investment decisions. None of Ausbil or its representatives is suggesting that the recipient or any other person take a specific course of action or any action at all. By receiving this document, the recipient acknowledges and agrees with the intended purpose described above and further disclaims any expectation or belief that the information constitutes investment advice to the recipient or otherwise purports to meet the investment objectives of the recipient. The financial instruments described in the document may not be eligible for sale in all jurisdictions or to certain categories of investors. The value of any investment or income may go down as well as up, and investors may not get back the full (or any) amount invested. Past performance is not necessarily a guide to future performance. Neither Ausbil nor any of its directors, employees or agents accepts any liability for any loss (including investment loss) or damage arising out of the use of all or any of the Information. Prior to making any investment or financial decisions, any recipient of this document or the information should take steps to understand the risk and return of the investment and seek individualised advice from his or her personal financial, legal, tax and other professional advisors that takes into account all the particular facts and circumstances of his or her investment objectives. Any prices stated in this document are for information purposes only and do not represent valuations for individual securities or other financial instruments. There is no representation that any transaction can or could have been effected at those prices, and any prices do not necessarily reflect Ausbil's internal books and records or theoretical model-based valuations and may be based on certain assumptions. Different assumptions by Ausbil or any other source may yield substantially different results. No representation or warranty, either expressed or implied, is provided in relation to the accuracy, completeness or reliability of the information contained in any materials to which this document relates (the "Information"), except with respect to Information concerning Ausbil. The Information is not intended to be a complete statement or summary of the securities, markets or developments referred to in the document. Ausbil does not undertake to update or keep current the Information. Any opinions expressed in this document may change without notice and may differ or be contrary to opinions expressed by other business areas or groups, personnel or other representative of Ausbil. Any statements contained in this Report attributed to a third party represent Ausbil's interpretation of the data, Information and/or opinions provided by that third party either publicly or through a subscription service, and such use and interpretation have not been reviewed by the third party. In no circumstances may this document or any of the Information (including any forecast, value, index or other calculated amount ("Values")) be used for any of the following purposes: (i) valuation or accounting purposes; (ii) to determine the amounts due or payable, the price or the value of any financial instrument or financial contract; or (iii) to measure the performance of any financial instrument including, without limitation, for the purpose of tracking the return or performance of any Values or of defining the asset allocation of portfolio or of computing performance fees. By receiving this document and the Information you will be deemed to represent and warrant to Ausbil that you will not use this document or any of the Information for any of the above purposes or otherwise rely upon this document or any of the Information. Except as otherwise specified herein, these materials are distributed by Ausbil, to persons who are eligible counterparties or professional clients and are only available to such persons. The Information does not apply to, and should not be relied upon by, retail clients. The information contained in this document is given by Ausbil Investment Management Limited (ABN 2676316473) (AFSL 229722) (Ausbil) and has been prepared for informational and discussion purposes only and does not constitute an offer to sell or solicitation of an offer to purchase any security or financial product or service. Any such offer or solicitation shall be made only pursuant to an Australian Product Disclosure Statement or other offer document (collectively Offer Document) relating to an Ausbil financial product or service. A copy of the relevant Offer Document may be obtained by calling Ausbil on +612 9259 0200 or by visiting www.ausbil.com.au. You should consider the Offer Documents in deciding whether to acquire, or continue to hold, any financial product. This document is for general use only and does not take into account your personal investment objectives, financial situation and particular needs. Ausbil strongly recommends that you consider the appropriateness of the information and obtain independent financial, legal and taxation advice before deciding whether to invest in an Ausbil financial product or service. The information provided by Ausbil has been done so in good faith and has been derived from sources believed to be accurate at the time of completion. While every care has been taken in preparing this information. Ausbil make no representation or warranty as to the accuracy or completeness of the information provided in this video, except as required by law, or takes any responsibility for any loss or damage suffered as a result or any omission, inadequacy or inaccuracy. Changes in circumstances after the date of publication may impact on the accuracy of the information. Ausbil accepts no responsibility for investment decisions or any other actions taken by any person on the basis of the information included. Past performance is not a reliable indicator of future performance. Ausbil does not guarantee the performance of any strategy or fund or the securities of any other entity, the repayment of capital or any particular rate of return. The performance of any strategy or fund depends on the performance of its underlying investments which can fall as well as rise and can result in both capital gains and losses. Canada This document does not pertain to the offering of any securities. This document is not, and under no circumstances is to be construed as, an advertisement or a public offering of the securities described in Canada. No securities commission or similar authority in Canada has reviewed or in any way passed upon this document or the merits of the securities, and any representation to the contrary is an offence. Sweden The information contained in the document is given by Ausbil and has been prepared for information and discussion purposes only and does not constitute an offer to sell or solicitation of an offer to purchase any security or financial product or service. It is provided to you as an institutional investor as that term is understood under Swedish law. By reading this document, you agree to be bound by these limitations, terms and conditions set out in the paragraphs above. United Arab Emirates & Kuwait This information relates to a Fund which is not subject to any form of regulation or approval by the Dubai Financial Services Authority ("DFSA"). The DFSA has no responsibility for reviewing or verifying any Prospectus or other documents in connection with this Fund. Accordingly, the DFSA has not approved this or any other associated documents nor taken any steps to verify the information set out in this Prospectus, and has no responsibility for it. The Units to which this Report relates may be illiquid and/or subject to restrictions on their resale. Prospective purchasers should conduct their own due diligence on the Units If you do not understand the contents of this document you should consult an authorized financial adviser. This information does not constitute or form part of any offer to issue or sell, or any solicitation of any offer to subscribe for or purchase, any securities or investment products in Kuwait, UAE (including the Dubai International Financial Centre) and accordingly should not be construed as such. Furthermore, this information is being made available on the basis that the recipient acknowledges and understands that the entities and securities to which it may relate have not been approved, licensed by or registered with the UAE Central Bank, the UAE Securities & Commodities Authority, the Dubai Financial Services Authority or any other relevant licensing authority or governmental agency in the UAE. The content of this Report has not been approved by or filed with the CBK, UAE Central Bank, the UAE Securities & Commodities Authority or Dubai Financial Services Authority. United Kingdom This information may be issued in the United Kingdom to, and/or is directed at, only persons to or at whom it may lawfully be issued, or directed under the Financial Services and Markets Act 2000 (Financial Promotion) Order 2005 (as amended) including persons who are authorised under the Financial Services and Markets Act 2000 ("FSMA"), certain persons having professional experience in matters relating to investments, high net worth companies, high net worth unincorporated associations or partnerships, or trustees of high value trusts. The services described in it are only available to such persons in the United Kingdom and this document must not be relied or acted upon by any other persons in the United Kingdom. By reading this document, you agree to be bound by these limitations, terms and conditions set out in the paragraphs above. Australia The information contained in this Report has been prepared for general use only and does not take into account your personal investment objectives, financial situation or particular needs. Ausbil is the issuer of the Ausbil Australian Active Equity Fund (ARSN 089 996 127), Ausbil Australian Geared Equity Fund (ARSN 124 196 407), Ausbil Australian Emerging Leaders Fund (ARSN 089 995 442), Ausbil MicroCap Fund (ARSN 130 664 872), Ausbil Australian SmallCap Fund (ARSN 630 022 909), Ausbil Balanced Fund (ARSN 089 996 949), Ausbil Active Dividend Income Fund (ARSN 621 670 120), Ausbil Australian Concentrated Fund (ARSN 622 627 696), Ausbil Active Sustainable Equity Fund (ARSN 623 141 784), Ausbil Global SmallCap Fund (ARSN 623 619 625), Candriam Sustainable Global Equity Fund (ARSN 111 733 898), Ausbil 130/30 Focus Fund (ARSN 124 196 621), Ausbil Long Short Focus Fund (ARSN 642 635 498), Ausbil Global Essential Infrastructure Fund (ARSN 628 816 151), Ausbil Global Resources Fund (ARSN 623 619 590) and MacKay Shields Multi-Sector Bond Fund (ARSN 611 482 243) (collectively known as 'the Funds').The information provided is factual only and does not constitute financial product advice. It does not take account of your individual objectives, financial situation or needs. Before you make any decision about whether to invest in a financial product, you should obtain and consider the Product Disclosure Statement of the financial product. The information provided by Ausbil Investment Management Limited (ABN 26 076 316 473 AFSL 229722) has been done so in good faith and has been derived from sources believed to be accurate at the time of compilation. Changes in circumstances, including unlawful interference and unauthorised tampering, after the date of publication may impact on the accuracy of the information. Ausbil Investment Management Limited accepts no responsibility for any inaccuracy or for investment decisions or any other actions taken by any person on the basis of the information included. Past performance is not a reliable indicator of future performance. Ausbil Investment Management Limited does not guarantee the performance of the Funds, the repayment of capital or any particular rate of return. The performance of any unit trust depends on the performance of its underlying investment which can fall as well as rise and can result in both capital losses and gains. Consequently, due to market influences, no assurance can be given that all stated objectives will be achieved. United States AN INVESTMENT IN THE FUND IS SPECULATIVE AND INCLUDES A HIGH DEGREE OF RISK, INCLUDING THE RISK OF A TOTAL LOSS OF CAPITAL. INTERESTS IN THE FUND WILL BE ILLIQUID AND SUBJECT TO SIGNIFICANT RESTRICTIONS ON TRANSFER. PROSPECTIVE INVESTORS SHOULD BE AWARE THAT THEY MAY BE REQUIRED TO BEAR THE RISKS ASSOCIATED WITH SUCH INVESTMENT FOR AN INDEFINITE PERIOD OF TIME. A PRIVATE OFFERING OF INTERESTS IN THE FUND WILL ONLY BE MADE PURSUANT TO THE FUND'S PRODUCT DISCLOSURE STATEMENT (THE "PDS"), AND RELATED DOCUMENTATION FOR THE FUND, WHICH WILL BE FURNISHED TO QUALIFIED INVESTORS ON A CONFIDENTIAL BASIS AT THEIR REQUEST FOR THEIR CONSIDERATION IN CONNECTION WITH SUCH OFFERING, WHO SHOULD CAREFULLY REVIEW SUCH DOCUMENTS PRIOR TO MAKING AN INVESTMENT DECISION. ANY INVESTMENT DECISION WITH RESPECT TO SUCH INTERESTS MUST BE BASED SOLELY ON THE DEFINITIVE AND FINAL VERSIONS OF SUCH DOCUMENTS. The information contained herein will be superseded by, and is qualified in its entirety by reference to the PDS, which contains additional information about the investment objective, terms and conditions of an investment in the Fund and also contains tax information, information regarding conflicts of interest and risk disclosures that are important to any investment decision regarding the Fund. No person has been authorized to make any statement concerning the Fund other than as set forth in the PDS and any such statements, if made, may not be relied upon. The information contained in this Report must be kept strictly confidential and may not be reproduced (in whole or in part) or redistributed in any format without the express written approval of AUSBIL INVESTMENT MANAGEMENT LIMITED (together with its affiliates, the "Firm"). Neither the Firm nor any of its affiliates makes any representation or warranty, express or implied, as to the accuracy or completeness of the information contained herein and nothing contained herein should be relied upon as a promise or representation as to past of future performance of the Fund or any other entity. Except where otherwise indicated herein, the information provided in this Report is based on matters as they exist as of the date of the document and not as of any future date, and will not be updated or otherwise revised to reflect information that subsequently becomes available, or circumstances existing or changes occurring after the date hereof. This Report has not been approved by the U.S. Securities and Exchange Commission (the "SEC"), the Financial Industry Regulatory Authority ("FINRA"), or any other regulatory authority or securities commission in the United States or elsewhere and does not constitute an offer to sell, or a solicitation of any offer to buy, any securities. This Report is not to be relied upon as investment, legal, tax, or financial advice. Any investor must consult with his or her independent professional advisors as to the investment, legal, tax, financial or other matters relevant to the suitability of an investment in the interests of the Fund. The reader is urged to read the sections in the PDS addressing risk factors, conflicts of interest and other relevant investment considerations. The Interests may not be transferred or resold except as permitted under the Securities Act and any applicable U.S. or non-U.S. securities laws. The Interests have not been reviewed or approved by any U.S. federal, other U.S. or non-U.S. securities commission or regulatory authority. Interests are not and will not be insured by the U.S. Federal Deposit Insurance Company or any government agency, are not guaranteed by any bank and are subject to investment risks, including the loss of an investor's entire principal amount invested. Investors should be aware that they may be required to bear the financial risks of an investment in the Interests for an indefinite period of time because the Interests (i) cannot be sold unless they are subsequently registered under any and all applicable securities laws in the United States, or an exemption from registration exists and (ii) are subject to the restrictions on transfer contained in the offering document or limited partnership agreement of the Fund. The reader must comply with all applicable laws and regulations in any jurisdiction in which it subscribes for an investment; and the reader, by its acceptance of this report, agrees that the Firm and the Fund will not have any responsibility for the reader's compliance with such laws and regulations. The Firm is registered as an investment adviser with the U.S. Securities & Exchange Commission. Certain information contained in this Report constitutes "forward-looking statements," which can be identified by the use of forward-looking terminology such as "may," "will," "should," "expect," "anticipate," "target," "project," "estimate," "intend," "continue" or "believe," or the negatives thereof or other variations thereon or comparable terminology. Due to various uncertainties and risks, actual results and performance of the Fund may differ materially from those reflected or contemplated in such forward-looking statements A short notice on the COVID-19 public health event, and how it can impact investments Given the currently evolving issues around the Coronavirus (or Covid-19) globally, which has officially been designated a pandemic by the World Health Organisation, we wish to notify that, as with many firms, business may be disrupted. A public health crisis, pandemic, epidemic or outbreak of a contagious disease, such as the recent outbreak of Coronavirus (or Covid-19) in Australia, Italy, China, South Korea, the United States and other countries, could have an adverse impact on global, national and local economies, which in turn could negatively impact investment returns in any of Ausbil Investment Management Limited's registered managed investment schemes (the Funds). Disruptions to commercial activity relating to the imposition of quarantines or travel restrictions (or more generally, an inability on behalf of authorities to contain this pandemic) may adversely impact any investment, including by delaying or causing supply chain disruptions or by causing staffing shortages. The outbreak of Coronavirus has contributed to, and may continue to contribute to, volatility in financial markets. The impact of a public health crisis such as the Coronavirus (or any future pandemic, epidemic or outbreak of a contagious disease) is difficult to predict, which presents material uncertainty and risk with respect to any investment or fund performance. |

27 Sep 2021 - Performance Report: Delft Partners Global High Conviction Strategy
| Report Date | |
| Manager | |
| Fund Name | |
| Strategy | |
| Latest Return Date | |
| Latest Return | |
| Latest 6 Months | |
| Latest 12 Months | |
| Latest 24 Months (pa) | |
| Annualised Since Inception | |
| Inception Date | |
| FUM (millions) | |
| Fund Overview | The quantitative model is proprietary and designed in-house. The critical elements are Valuation, Momentum, and Quality (VMQ) and every stock in the global universe is scored and ranked. Verification of the quant model scores is then cross checked by fundamental analysis in which a company's Accounting policies, Governance, and Strategic positioning is evaluated. The manager believes strategy is suited to investors seeking returns from investing in global companies, diversification away from Australia and a risk aware approach to global investing. It should be noted that this is a strategy in an IMA format and is not offered as a fund. An IMA solution can be a more cost and tax effective solution, for clients who wish to own fewer stocks in a long only strategy. |
| Manager Comments | The strategy's Sharpe ratio has ranged from a high of 2.82 for performance over the most recent 12 months to a low of 0.81 over the latest 36 months, and is 1.18 for performance since inception. Its Sortino ratio (which excludes volatility in positive months) is 2.23 for performance since inception. Since inception in August 2011 in the months where the market was positive, the strategy has provided positive returns 89% of the time, contributing to an up-capture ratio for returns since inception of 101.25%. Over all other periods, the strategy's up-capture ratio has ranged from a high of 116.64% over the most recent 12 months to a low of 85.62% over the latest 60 months. An up-capture ratio greater than 100% indicates that, on average, the strategy has outperformed in the market's positive months over the specified period. The strategy's down-capture ratio for returns since inception is 93.69%. A down-capture ratio less than 100% indicates that, on average, the strategy has outperformed in the market's negative months. |
| More Information |

27 Sep 2021 - The Rate Debate - Episode 20
|
The Rate Debate - Episode 20 Yarra Capital Management September 2021 The RBA expects a material slowdown in economic growth in September, but is forecasting a bounce-back in December that will stretch into the first half of 2022. Given market uncertainties, is the RBA's confidence justified, and could it mean higher interest rates are coming? Darren and Chris answer this question and more in episode 20 of The Rate Debate. |
|
Funds operated by this manager: Yarra Australian Equities Fund, Yarra Emerging Leaders Fund, Yarra Enhanced Income Fund, Yarra Income Plus Fund |

24 Sep 2021 - Hedge Clippings | 24 September 2021
|
||||||||||||||
|
If you'd like to receive Hedge Clippings direct to your inbox each Friday
|


24 Sep 2021 - Performance Report: Frazis Fund
| Report Date | |
| Manager | |
| Fund Name | |
| Strategy | |
| Latest Return Date | |
| Latest Return | |
| Latest 6 Months | |
| Latest 12 Months | |
| Latest 24 Months (pa) | |
| Annualised Since Inception | |
| Inception Date | |
| FUM (millions) | |
| Fund Overview | The manager follows a disciplined, process-driven, and thematic strategy focused on five core investment strategies: 1) Growth stocks that are really value stocks; 2) Traditional deep value; 3) The life sciences; 4) Miners and drillers expanding production into supply deficits; 5) Global special situations; The manager uses a macro overlay to manage exposure, hedging in three ways: 1) Direct shorts 2) Upside exposure to the VIX index 3) Index optionality |
| Manager Comments | Since inception in July 2018 in the months where the market was positive, the fund has provided positive returns 80% of the time, contributing to an up-capture ratio for returns since inception of 217.49%. Over all other periods, the fund's up-capture ratio has ranged from a high of 321.13% over the most recent 24 months to a low of 145.19% over the latest 12 months. An up-capture ratio greater than 100% indicates that, on average, the fund has outperformed in the market's positive months over the specified period. The fund's Sharpe ratio has ranged from a high of 1.58 for performance over the most recent 12 months to a low of 0.88 over the latest 36 months, and is 0.89 for performance since inception. Its Sortino ratio (which excludes volatility in positive months) has ranged from a high of 3.71 for performance over the most recent 12 months to a low of 1.17 over the latest 36 months, and is 1.18 for performance since inception. |
| More Information |
24 Sep 2021 - Fund Review: Bennelong Twenty20 Australian Equities Fund August 2021
BENNELONG TWENTY20 AUSTRALIAN EQUITIES FUND
Attached is our most recently updated Fund Review on the Bennelong Twenty20 Australian Equities Fund.
- The Bennelong Twenty20 Australian Equities Fund invests in ASX listed stocks, combining an indexed position in the Top 20 stocks with an actively managed portfolio of stocks outside the Top 20. Construction of the ex-top 20 portfolio is fundamental, bottom-up, core investment style, biased to quality stocks, with a structured risk management approach.
- Mark East, the Fund's Chief Investment Officer, and Keith Kwang, Director of Quantitative Research have over 50 years combined market experience. Bennelong Funds Management (BFM) provides the investment manager, Bennelong Australian Equity Partners (BAEP) with infrastructure, operational, compliance and distribution services.
For further details on the Fund, please do not hesitate to contact us.
24 Sep 2021 - What is a Life Settlements Investment?
|
What is a Life Settlements investment? Tony Bremness, Laureola Advisors September 2021 The sale in the USA of a life insurance policy to a 3rd party
Imagine having the ability to benefit from the diligent financial habits of middle America. Like most residents of advanced countries, Americans have a tradition of establishing a life insurance policy as they start a family, take on a mortgage or build their own business. Over a period of responsible financial discipline, the children become independent, and debt is paid off. The need for insurance cover diminished. Some policyholders realise that their life policy is a financial asset and would seek to cash in its value. Unfortunately, there is a low level of understanding of the options available to cash in life insurance policies. This resulted in over 90% of life policies being terminated in the US without paying a death benefit in 2018. To provide a better outcome, the life settlements market was formed to match policyholders wishing to sell their unwanted cover to investors looking for a non-correlated asset class with the potential for stable returns. A life settlement market will give policyholders additional options in obtaining a higher value of their policies. A life settlement transaction starts with a policyholder selling their life insurance policies to an investor (usually a fund). The life settlement investor buys the life insurance policy from the policyholder and commits to paying future insurance premiums until the insured person dies. The investor then collects the death benefit payout from the insurance company as the concluding repayment of the life settlement transaction. The path of an illustrative policy is shown below. Illustrative example - assume a life settlement transaction backed by a policy with a death benefit of $100k Hence, a life settlement transaction is clearly win-win transaction for the seller and for the investor. The returns to the investor are embedded in the benefit payout collected upon the maturity of the policy. Most market observers estimate a long-term range of 6-12% p.a. as potential returns going forward as long as the portfolio is managed properly. Funds operated by this manager: |
