
NEWS
21 Oct 2021 - When Opportunity Knocks
|
When Opportunity Knocks Aitken Investment Management 29 September 2021 |
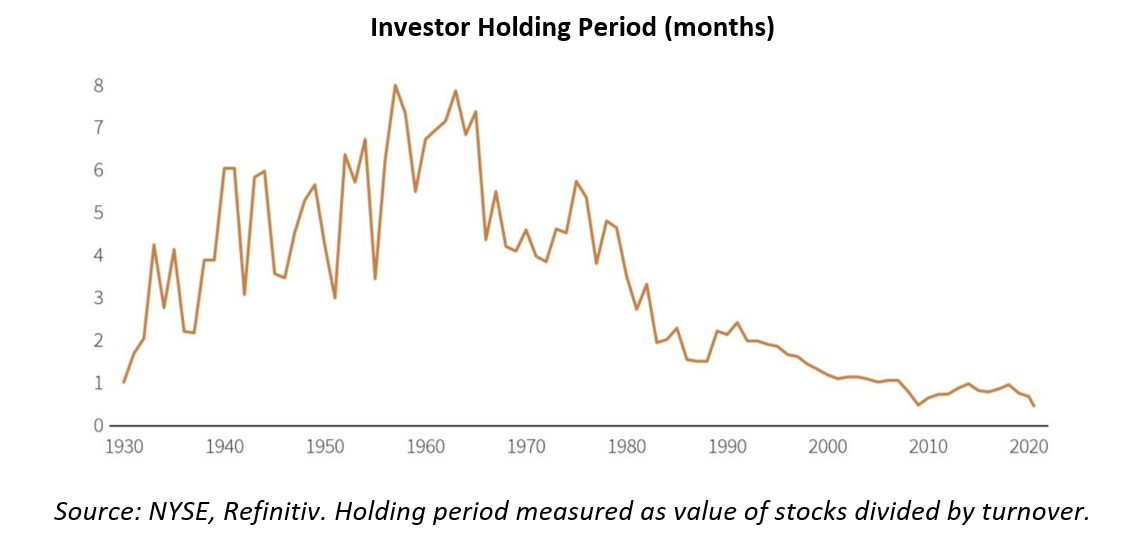
The Facts about Market TimingTo begin with, we subscribe to the view that the attraction of equities is the availability of compound total returns ahead of inflation over time. This comes with a cost: investors will only enjoy the effect of the compounding process if they remain invested for the medium to longer-term. An investor's friend is time, conviction, fundamental research and a business ownership mindset. Nevertheless, the temptation to 'take some risk off' is ever-present. While each individual investor will have unique circumstances driving their personal asset allocation, we don't attempt to engage in market timing within the Fund. (A piece of investing wisdom we take to heart is that there are two types of investors when it comes to market timing: those who cannot do it, and those who know they cannot do it). We believe that the reasons for market timing rarely working can be boiled down to two underlying issues: 1. The risk of missing out on big 'up' days can have incredibly negative impacts on long-term returns… and not surprisingly, the big 'up' days tend to be clustered around the big 'down' days during periods of increased volatility. Giving in to the temptation to 'get out' on the big down days dramatically increases the risk of missing the rebound. Many studies have borne this phenomenon out; according to a recent piece of research by JP Morgan Asset Management, $10,000 invested in the S&P 500 on 3 January 2000 would have turned into $32,421 by 31 December 2020 for an annual compound rate of return of 6.06%. Missing the 10 biggest 'up' days cuts that compound rate of return to 2.44%, while missing the 20 biggest days reduces it yet further to a paltry 0.08% per year. Missed the 30 best days? You would actually end up with less money than you started, having compounded at -1.95% per year for 20 years. 'Getting out' to avoid the psychological pain of short-term paper losses is not worth the increased risk of long-term damage to returns, in our opinion. 2. Markets are second-level systems. It is not enough to accurately predict an event; one must also correctly predict what the market was anticipating prior to the event and then correctly deduce how the market might react to the new information. We think that getting all three of those variables correct - and then being right on the timing, to boot - is nigh-on impossible to do repeatably. Since 1950, the S&P 500 has experienced 36 separate drawdowns of 10% or more. Ten of these double-digit declines ended up exceeding 20% (the popular definition of a 'bear market') peak-to-trough, while the other 26 ended up somewhere between -10% and -20% (a 'correction, euphemistically.) Statistically speaking, if there have been 36 double-digit drawdowns over the past 70-odd years, it works out that investors should expect this to happen with a frequency of about once every two years. Corrections and pullbacks are essentially an unavoidable part of the investment journey - and when seen in perspective as a period of prudent capital allocation with a margin of safety, is more likely to provide opportunity than lasting damage. Investor Time-Horizons: Shorter Than EverClosely linked to this point - using periods of market weakness to allocate capital - is the fact that investor time horizons have almost never been shorter. Based on an analysis of turnover, the average investor in US equities hold their positions for less than a year.
As the chart above shows, investor holding periods have been steadily decreasing since essentially the early 1990's, meaning this dynamic is not a new one. Over the past 18 months or so, access to cheap leverage and commission-free trading has likely exacerbated the trend. We recently tested this thesis on some of the high-profile, high-growth businesses that have come to market since the start of the pandemic. After adjusting for management ownership and strategic investors, it appears to us that a number of businesses essentially see their free float turned over in full every two to four months. Keep in mind, this is for businesses where the drivers of value lie several years in the future. We have very little doubt that there is substantial short-term speculating about long-term variables occurring in the equity of certain businesses. Of course, shortening holding periods also create opportunity. If an investor can simply take a 12 to 18-month forward view, one is already looking out further than the majority of the daily activity in markets. (We generally try to formulate a view on a 3-to-5-year basis). When a high-profile business suffers the inevitable disappointment relative to the sky-high expectations embedded in its price, the pullback can provide a window to the patient investor. The narrative behind any pullback can be varied: stalled US debt ceiling negotiations, fears of a slowdown in China, rising energy prices, ongoing supply chains disruptions, resurgent COVID cases or lockdowns all seem like likely candidates. However, to the investor who takes a business ownership perspective and understands the quasi-permanent nature of equity ownership (particularly in competitively advantaged businesses), such pullbacks usually provide the time to wisely allocate capital. Getting scared off by a compelling narrative around risk is exactly what causes inactivity when the market goes on sale. The Psychology of Uncertainty -Prepare, Don't PredictFred Schwed Jr. was a professional broker active on Wall Street active during the crash of 1929. Several years after the event, he wrote the seminal Where Are The Customer's Yachts?, in which he provided a true, timeless and hilarious view on the inner workings of investment markets and Wall Street culture. Despite being nearly 100 years old, the observations in it remain timely, and we highly recommend it to our investors - it is a quick read, and extremely funny to boot. In Where Are The Customer's Yachts?, Schwed writes: For one thing, customers have an unfortunate habit of asking about the financial future. Now, if you do someone the single honour of asking him a difficult question, you may be assured that you will get a detailed answer. Rarely will it be the most difficult of all answers - "I don't know." We strongly agree with this statement. The one thing markets (and by extension, investors) hate is uncertainty. Uncertainty leads to volatility, which leads to those troublesome corrections everyone is trying to avoid. It is therefore no surprise that market commentators hold forth on a variety of subjects with great certainty: "inflation will do X", "the currency will do Y", etc. The problem is this: absolutely no one knows what will happen with 100% certainty. All of the knowable facts lie in the past, while all of the value lies in the unknowable future. Following the recent experience of navigating markets in 2020, one maxim of AIM's investment team is that among the four most dangerous words in investing (alongside Sir John Templeton's famous "this time it's different") are "we know for sure" - particularly when it comes to macro-economic prediction. Instead of selling you certainty, we believe in working alongside our investors to get comfortable in living with the psychology of uncertainty. Our motto in this regard: prepare, don't predict. We limit our predictions about the future to businesses we believe we understand, and by sticking to this circle of competence - and owning businesses with prodigious amounts of cash on hand and cash being generated - we believe we are prepared for the 'vicissitudes of fate' that will play out in the real economy. When we believe we have both an edge in understanding as well as a margin of safety, we prudently invest your capital, effectively handing it over to the right business managers at the right price. We believe this approach is likely to lead to far more beneficial outcomes over time than trying to predict and position for short-term macro-economic outcomes. Sustained, Incremental, SensibleAs exciting as it may feel to time the market, worry about every headline promising impending doom and trading in and out based on some forecast of an imminent correction (which may or may not happen), the evidence proves that such strategies rarely work. Instead, far more is achieved when sticking to a strategy that allows for the aggregation of small gains - in other words, compounding - to build up over time. Practically speaking, this means that most investors are almost always going to be better off by simply using a dollar-cost averaging strategy through time. By mentally sticking with an allocated amount to invest through thick and thin, investors generally do better over the long term than by making big calls to get in and out of the market. The reason is simplicity itself: this strategy keeps you invested - and more importantly, still investing - when the proverbial lean years come around in the market. (Logically, one may consider whether it is appropriate within their personal circumstances and risk appetite to accelerate such a strategy when market volatility offers a greater margin of safety when a correction (or bear market) does occur.) If the conclusion to this note seems somewhat boring, we have achieved our goal in writing it. 'Sustained, incremental and sensible' as a capital allocation strategy is hardly going to get the blood pumping on any particular day, but it makes all the difference when adhered to for long periods of time through the wonders of compounding. Through a number of market cycles, we have found that time in the market matters more than timing the market. |
|
Funds operated by this manager: AIM Global High Conviction Fund |

21 Oct 2021 - Our principles-based approach to Environmental, Social and Governance (ESG)
|
Our principles-based approach to Environmental, Social and Governance (ESG) Claremont Global October 2021 Growth in ESG awareness ESG awareness among investors continues to increase on a global scale. This has been made most evident via the growing prominence of the United Nations Principles for Responsible Investment (PRI) among institutional investors. Launched in 2006, the PRI was initially established to raise awareness of Environmental, Social and Governance (ESG) considerations among the investment community, as part of developing a more sustainable financial system. Since that time the PRI has become the world's leading proponent of responsible investment and as of 2020 exceeded 3,000 signatories and represented over US$100 trillion of assets under management.1 PRI signatories and assets under management (AUM) Alignment with our investment framework With a central focus on sustainable long-term company performance, the Claremont Global Fund is now a signatory to the PRI. Whilst a new and welcome development, in reality we expect there will be little change to our proven investment process. Our underlying strategy and our rigorous research-backed process naturally leads to investment in well-run businesses with strong management teams and a culture attuned to the long-term needs of all stakeholders. Since the inception of the strategy in 2011, our goal has been to generate returns of 8-12 percent per annum, through the cycle, for our investors. We have always stressed to clients the importance of keeping a long-term perspective. Our ability to achieve this requires us to remain true to our investment process and invest in sustainable businesses - something we believe is largely unachievable, without serious consideration of ESG principles. Research has shown that when companies adopt good ESG policy it's a positive for all stakeholders, which includes improving financial performance for investors.2 Relationship to our investment pillars Our philosophy and process are based on four key investment pillars: ESG considerations comprise an important part of our research on the first three pillars when we analyse a company to determine its investment suitability. Notes: 1. Principles for Responsible Investment, "an investor initiative in partnership with UNEP finance initiative and the UN global Compact", 2020 Management quality and ESG We believe that a first-class ESG approach is unlikely to have a tick-the-box methodology. Rather, it is driven by the principles, values and, most importantly, actions that underpin company culture. This flows from the actions of management and the board of directors - with management quality one of the fund's key investment pillars, (or in ESG parlance, a focus on good governance). This requires a long-term mindset; a focus on delivering value to customers; equitable treatment of employees and communities; and continuous operational improvement that benefits all stakeholders. Our experience is that this long-term mindset is typically found within stable, well-tenured management teams - it is unlikely to be built overnight - and is something we seek in all the companies we invest. However, culture is more difficult to measure and requires some judgment on our behalf. With a relatively finite universe of companies that meet our quality investment criteria, we can consistently engage with management teams, allowing us to better assess management's mentality and actions, and gain deeper insight into the prevailing culture. Prior to investment in a company, we will always speak with ex-employees, competitors and industry experts where possible. We also look at the composition of the executive team and board, tenure and strategy. This, we believe, allows us to pass both an independent and educated judgement on a key facet of a business that cannot be screened for, lifted from a broker report, or extracted from an ESG score from one of the rating agencies. Capital structure and ESG A strong balance sheet - another of our key investment criteria - is often illustrative of good governance, and is an area frequently overlooked, due to a focus on maximising short-term profitability. Companies that engage in 'financial engineering', such as taking on excessive debt to reward shareholders in the short-term, through share buybacks and poor M&A - only to then go seeking government and/or shareholder assistance in times of crisis - is in our eyes a complete governance failure. Our process deliberately aims to keep us clear of such businesses and industries, allowing us to research and ultimately invest in businesses that are managed to successfully navigate, and indeed prosper, through adverse economic events. The average age of the companies in our portfolio is currently over 80 years and these businesses have seen many economic cycles and stood the test of time. Their durability is a combination of tested business models; the value proposition they offer their customers and employees, and prudently managed balance sheets. It is difficult to overstate the power of incentives and we always analyse management compensation closely. We engage with our companies regularly (at least quarterly), highlighting what we believe are important considerations, as well as voting on the remuneration of executives on an annual basis. Incentives for some companies are skewed to short-term financial metrics (such as "adjusted EPS") and a misaligned remuneration structure may lead to short-term gains, but result in perverse outcomes both for the broader community and ultimately for the longer-term shareholder. When considering the Environmental impact of a business, we find that management teams with a strong culture and good ethics, coupled with the right incentives, are comfortable investing in areas such as energy and water efficiency, waste reduction, and/or proper remediation of historical environmental issues. These investments can often have a negative impact on short-term profitability but deliver long-term benefits, ranging from reduced carbon emissions, employee safety, favourable reception by local communities, regulators, and customers - all while reducing operating costs over time. As a result, we prefer to see a large proportion of management compensation based on a variety of long-term metrics such as organic growth, margins, cash flow and return on invested capital, rather than measures such as "adjusted" EPS, which can be more easily manipulated in the short term. Business quality and ESG Of course, a definition of business quality is broader than simple financial metrics. In the past, Social issues may have been limited to the human resources division, however, today they expand far beyond this narrow remit. For us, social considerations cover the relationships the company has within its ecosystem. From the impact the company's products/services have on communities, to the treatment of their employees, places of manufacturing and suppliers. We have no doubt that failure to adequately respect all subsegments of a company's value chain will impair the long-term sustainability of a business. Globalisation, transparency, investor awareness and ESG are increasingly (and rightfully) calling into question how a company's profits are made. We routinely engage with management to better understand whether they may be compromising on the quality of their product/service (for example, buying materials from a cheaper source that does not adhere to local emission or labour practises) to simply meet a short-term financial objective. We believe such actions are not sustainable over the long-term but also highlight management's failure to seriously consider the impact of their business on society and the culture of the organisation. Identifying quality growth businesses for the long-term Despite the best intentions, the rise of ESG within the investment community has not been spared the hype that generally accompanies an emerging area of interest where financial gain is possible. Increasingly, the industry is looking to capitalise on the trend, launching 'green' funds (which often come with higher fees), while investors have looked to profit from the share price appreciation of companies they think will be beneficiaries of ESG- focused buying. With a clear focus on capital preservation, investors in our fund can take comfort that we will remain disciplined when it comes to the price we pay for businesses and exercise caution by avoiding areas of speculation and thematic investing. As illustrated, the principles of ESG have been - and will continue to be - critical to our investment process and our portfolio of companies. However, ESG factors are nuanced and typically cannot be reduced to specific metrics or rules that are comparable across businesses. As a result, we believe it is prudent to use independent judgement and consider each business on a case-by-case basis, rather than be governed wholly by externally generated ESG metrics. To conclude, whilst ESG in the mainstream is a relatively new phenomenon, our investment process has always emphasised management teams with a strong commitment to their customers, employees, communities and wider society. We believe when these factors are combined with good governance and prudent balance sheets, the end result is better risk-adjusted outcomes for long-term shareholders like ourselves. Funds operated by this manager: |

20 Oct 2021 - Performance Report: Surrey Australian Equities Fund
| Report Date | |
| Manager | |
| Fund Name | |
| Strategy | |
| Latest Return Date | |
| Latest Return | |
| Latest 6 Months | |
| Latest 12 Months | |
| Latest 24 Months (pa) | |
| Annualised Since Inception | |
| Inception Date | |
| FUM (millions) | |
| Fund Overview | The Investment Manager follows a defined investment process which is underpinned by detailed bottom up fundamental analysis, overlayed with sectoral and macroeconomic research. This is combined with an extensive company visitation program where we endeavour to meet with company management and with other stakeholders such as suppliers, customers and industry bodies to improve our information set. Surrey Asset Management defines its investment process as Qualitative, Quantitative and Value Latencies (QQV). In essence, the Investment Manager thoroughly researches an investment's qualitative and quantitative characteristics in an attempt to find value latencies not yet reflected in the share price and then clearly defines a roadmap to realisation of those latencies. Developing this roadmap is a key step in the investment process. By articulating a clear pathway as to how and when an investment can realise what the Investment Manager sees as latent value, defines the investment proposition and lessens the impact of cognitive dissonance. This is undertaken with a philosophical underpinning of fact-based investing, transparency, authenticity and accountability. |
| Manager Comments | Since inception in June 2018 in the months where the market was positive, the fund has provided positive returns 83% of the time, contributing to an up-capture ratio for returns since inception of 123.38%. Over all other periods, the fund's up-capture ratio has ranged from a high of 142.68% over the most recent 24 months to a low of 92.95% over the latest 12 months. An up-capture ratio greater than 100% indicates that, on average, the fund has outperformed in the market's positive months over the specified period. The fund's Sharpe ratio has ranged from a high of 1.75 for performance over the most recent 12 months to a low of 0.65 over the latest 36 months, and is 0.65 for performance since inception. By contrast, the ASX 200 Total Return Index's Sharpe for performance since June 2018 is 0.63. |
| More Information |

20 Oct 2021 - Performance Report: NWQ Fiduciary Fund
| Report Date | |
| Manager | |
| Fund Name | |
| Strategy | |
| Latest Return Date | |
| Latest Return | |
| Latest 6 Months | |
| Latest 12 Months | |
| Latest 24 Months (pa) | |
| Annualised Since Inception | |
| Inception Date | |
| FUM (millions) | |
| Fund Overview | The Fund aims to produce returns after management fees and expenses of RBA Cash Rate + 4.0-5.0% p.a. over rolling five-year periods. Furthermore, the Fund aims to achieve these returns with volatility that is a fraction of the Australian equity market, in order to smooth returns for investors. |
| Manager Comments | Since inception in May 2013 in the months where the market was negative, the fund has provided positive returns 51% of the time, contributing to a down-capture ratio for returns since inception of 14.09%. Over all other periods, the fund's down-capture ratio has ranged from a high of 38.31% over the most recent 12 months to a low of 21.72% over the latest 60 months. A down-capture ratio less than 100% indicates that, on average, the fund has outperformed in the market's negative months over the specified period. The fund's Sortino ratio (which excludes volatility in positive months) has ranged from a high of 4.94 for performance over the most recent 12 months to a low of 0.94 over the latest 36 months, and is 1.31 for performance since inception. By contrast, the ASX 200 Total Return Index's Sortino for performance since May 2013 is 0.69. |
| More Information |

20 Oct 2021 - Manager Insights | Aitken Investment Management
|
Chris Gosselin, CEO of Australian Fund Monitors, speaks with Charlie Aitken, CEO & Portfolio Manager at Aitken Investment Management. The AIM Global High Conviction Fund has been operating since July 2019 and has delivered investors an annualised return of 17.30% since then vs the Global Equity Index's +14.83%. These returns have been achieved with the same level of volatility as the market. Its capacity to outperform on the downside is supported by its down-capture ratio (since inception) of 83%.
|

20 Oct 2021 - Iron Ore - some perspective on a polarising market
|
Iron Ore - some perspective on a polarising market Luke Smith, Ausbil August 2021 |
|
Iron Ore remains a commodity that polarises the market. While supply continues to be the main focus of the market, demand has been just as important to the strength of Iron Ore over the last 12-18 months. There were some extreme circumstances that resulted in the market being in the situation where Iron Ore broke through and maintained levels above $200/t. We discuss these below. On demand, Chinese economic activity and steel demand was impacted materially in early 2020, given the implications of COVID-19, however, this recovered extremely quickly from 2Q20 and into 2H20 on the back of supportive stimulatory government policies. Similarly, the Rest of the World was significantly impacted in 2020, and while it took longer to recover, it is now accelerating in terms of steel demand as economies recover and strengthen. On supply, issues commenced with the dam failures in Brazil (both Samarco and Brumadinho), then tightened further on the back of COVID-19 related issues (labour in particular) further impacting supply. The Pilbara has also had its issues, which shouldn't be ignored, which from our perspective relate to the diversified majors underinvesting in sustaining capex through the downturn. These mixed causes have conspired with the pandemic to tighten overall supply, ultimately pushing Iron Ore prices higher. A number of these factors, both in terms of supply and demand, will ease over coming years, so we expect Iron Ore prices to continue to taper from current levels. While the diversified major resources companies (whose earnings are dominated by Iron Ore) may still outperform, given ongoing earnings upgrades, strength in balance sheets and free cash flow, limited M&A activity and strength in returns, we have a relative preference towards other commodities within the complex. Our preferred exposures remain Base Metals (Copper and Nickel), Battery Materials and Oil & Gas. The following outlines some of the background to our view on the commodity. Demand: What was driving the rapid growth in Chinese steel production?The strength in Chinese steel demand growth through early 2021 was a continuation from the strength seen through 2H2020. China slowed quickly and aggressively in 1Q CY2020, given the implications of Covid-19, but likewise, the reopening was quick and robust, hence production rates were high during 2H2020, and continued into early 2021, as outlined in Chart 1. Construction accounts for roughly 60% of Chinese steel demand (arguably significantly more when machinery is included). All three major construction-related components of the Chinese economy benefited from loose monetary and stimulatory fiscal policy, which resulted in an acceleration of infrastructure, real estate and manufacturing-related activity. The result has been booming steel demand for construction, and ultimately significant iron ore demand as a result. This positive steel demand backdrop has clearly been tempered in recent months, with the policy changes focused towards both infrastructure and property investment being key factors resulting in easing demand as we entered the second half of the year. This in turn has clearly been one of the major driving forces in the correction in Iron Ore prices. Chart 1: Chinese annualised steel production (Mtpa) Source: World Steel Data, JP Morgan Demand: What other factors are important when assessing the demand backdrop?The rest of the world (RoW) demand picture for steel should also not be ignored. Right now, we have a situation where Chinese steel consumption was recovering to higher levels, whereas global steel production is still in the process of recovering and ultimately accelerating (despite an extremely strong backdrop). During 2020, the clear demand driver for Iron Ore was a China recovery. In 2021, demand is more about the rest of the world starting to normalise. Chinese steel production rose ~60mt in 2020 versus 2019, but the rest of the world fell by ~110mt. In 2021, we have Chinese growth rates moderating, but a recovery in the rest of the world, to almost normalised production rates. Supply: What are your expectations for Vale iron ore production in Brazil?Vale, who are one of the four major Iron Ore producers globally (with RIO, FMG and BHP), cut production guidance for 2021 to 315-335Mt in December 2020. By way of comparison, the overall global market for Iron Ore is 1.5Bt pa. This downgrade compares to their original guidance of 375Mt, and has therefore removed a significant amount of expected supply from the marketplace. Vale continues to have issues with its tailings dams (recently a 15mtpa facility was taken offline as a result). The company are also having issues restarting suspended capacity, and there was a fire in January at their Madeira Port which is limiting shipments. We are cautious on Vale production increases in subsequent years. Vale are targeting roughly 400Mtpa run-rate for capacity by year-end 2022, however this likely only implies reaching that run-rate in the final quarter. The wet season and continued issues with restarts are likely to impact output leading into those run-rates, and as a result, we continue to take their growth forecasts with a grain of salt. Price: What is your iron ore price forecast? How does this compare to historical assumptions?Given the market backdrop, we have described, we currently forecast Iron Ore prices (62% Fines) to taper from current levels towards $140/t in CY22 and $110/t in CY23. We had certainly been surprised by the absolute level of strength in the commodity over the last 6-9 months. The combination of stronger than expected demand and supply weakness exceeded our expectations during this period. COVID only exacerbating market tightness, through Chinese construction-related stimulus and COVID-related supply issues in Brazil. Clearly, this had unwound in recent weeks, with China's tightening measures have a significant impact on the demand backdrop. As a result of the stronger than expected backdrop in recent years, we have been in a continual upgrade phase to our own commodity and earnings expectations. That said, for the last three years (at least) we have been well above consensus expectations, supporting our view of significant ongoing earnings upgrades through this period, which ultimately was the key driving factor for share prices across the diversified majors and pure-play iron ore miners, in our view. Price: Are your forecasts conservative or optimistic?Our forecasts reflect detailed supply and demand analysis for the commodity. Some extreme circumstances have seen the market in Iron Ore breakthrough and until recently maintain levels above $200/t. As we highlight regarding the supply issues we have seen in Brazil, this supply contraction commenced with the tailings dam failures (both Samarco and Brumadinho), then tightened further on the back of COVID-19 related issues impacting supply further. The Pilbara has also had its issues, which should not be ignored, which from our perspective, simplistically relate to the diversified majors underinvesting in sustaining capex through the downturn. Secondarily, in terms of demand, last year was an exceptional year. Post-COVID, China reverted to traditional mechanisms to support its economy. This saw renewed stimulus focused on construction-related industries (notably infrastructure and manufacturing, but increased liquidity also supporting property markets), which in turn supports the demand for steel-related commodities. A number of these factors, both in terms of supply and demand, will continue to ease over the coming years, so we are comfortable with our forecasts at this stage. On the supply side, it is worth noting that we are seeing some early signs of a supply response from non-traditional producers, and also from a number of smaller producers. The numbers are small, but a small increase in supply is evident. What is your long-term Iron Ore price and has it increased?We currently use US$70/t real as our benchmark for the longer-term underlying price for Iron Ore. This increased in recent years from roughly US$60/t previously. This step-change reflected stronger longer-term demand projections (from China in particular) which in turn require the incentive price for Chinese domestic Iron Ore mine supply to be higher. Chinese GDP growth, population growth and per capita steel consumption were the key factors driving up our expectations for higher than expected demand growth. We expect the Chinese domestic Iron Ore supply will remain the marginal source of supply. The key question for us is how large (and how quickly) the Simandou project in Guinea will be brought online over the medium term, in order to displace this marginal domestic Chinese supply. China has set plans in motion for more independence in terms of Iron Ore, which involves the development of additional African supplies. While we expect the Simandou project to come online faster and larger than market expectations (similar to what we have seen with China's investment in Bauxite in Guinea, and supporting China's aim to diversify away from Australian supply), ultimately Chinese domestic iron ore supply is likely to remain the marginal tonne. So how are we positioning the Ausbil Global Resources Fund with this in mind?Our expectations for Iron Ore prices to soften from their elevated levels were confirmed in recent weeks and had been based on two premises. Firstly, and of more immediate concern, Chinese demand was likely to soften from the elevated levels as credit tightened and construction-related activity softened (clearly confirmed by recent activity). Secondly, and of more medium-term concern, supply eventually recovers, with marginal supply and Brazilian tonnes expected to continue to respond to the enticement of current high prices. While Vale's growth guidance should be taken with a pinch of salt, supply is still expected to continue to increase into 2022. As a result, positioning within the Ausbil Global Resources Fund, based on relative value within the commodities complex, and concerns regarding the now confirmed softening outlook for Iron Ore, resulted in negative positioning on the equities exposed to the commodity. Important to highlight though, that this was a relative call amongst commodities, given our overarching positive thesis towards resources over the medium term. This negative positioning on Iron Ore equities enabled us to allocate towards equities exposed to our preferred commodities (base metals primarily in copper and nickel, battery materials, and oil & gas) which we expect to continue to strengthen from current levels, both at the commodity and equity level. This positioning enabled the Fund to navigate an extremely volatile period within the resources sector. August month-to-date the S&P/ASX 200 Resources Index is down over -10%, while the performance of the Fund is currently in positive territory. Clearly, the targeted commodity exposure, combined with a long-short approach we take to investing, has enabled the Fund to meet its objective of generating absolute returns regardless of the cycle. While this has positioned the Fund well in recent months and weeks, we believe that the market has overshot to the downside, through the combination of concerns regarding weaker China economic activity, Delta variant, QE Taper tantrum, USD strength, and continue to see a medium-term opportunity supported by recovering/accelerating demand in both China and the rest of the world, combined with a lack of investment in commodities supply, which will continue to support the backdrop for Resources over the medium term. Combined with the fact that, despite the recent fall in the commodity, we continue to see fundamental underlying earnings upside for the Iron Ore producers that is ahead of consensus. And given we view that earnings are the key driver for share prices, we have been adding to positioning towards the Iron Ore equities, looking to tactically take advantage of what we view as a commodity that has overcorrected to the downside. The benefit of our absolute return focus is that we can make the most of tactical opportunities such as elevated price levels, and add protection to exposures to generate preferable risk-adjusted returns across all markets. Invest with Experience Ausbil's investment approach allows us to exploit the inefficiencies across the entire market, at all stages of the cycle and across all market conditions. Click the 'FOLLOW' button below for more of our insights. |
|
Funds operated by this manager: Ausbil 130/30 Focus Fund, Ausbil Australian Active Equity Fund, Ausbil Global SmallCap Fund, Ausbil MicroCap Fund |
|
DISCLAIMER Important Information: Australia, Canada, Denmark, Kuwait, Netherlands, Sweden, United Arab Emirates, USA, United Kingdom. General Research provided to a client may vary depending upon various factors such as a client's individual preferences as to the frequency and manner of receiving communications, a client's risk profile and investment focus and perspective (e.g., market wide, sector specific, long-term, short-term, etc.), the size and legal and regulatory constraints. This information is for distribution only as may be permitted by law. It is not directed to, or intended for distribution to or use by, any person or entity who is a citizen or resident of, or located, in any locality, state, country or other jurisdiction where such distribution, publication, availability or use would be contrary to law or regulation or would subject Ausbil to any registration or licensing requirement within such jurisdiction. This information is a general communication and is educational in nature; it is not an advertisement nor is it a solicitation or an offer to buy or sell any financial instruments or to participate in any particular trading strategy. Nothing in this document constitutes a representation that any investment strategy or recommendation is suitable or appropriate to an investor's individual circumstances or otherwise constitutes a personal recommendation. By providing this document, none of Ausbil or its representatives has any responsibility or authority to provide or have provided investment advice in a fiduciary capacity or otherwise. Investments involve risks, and investors should exercise prudence and their own judgment in making their investment decisions. None of Ausbil or its representatives is suggesting that the recipient or any other person take a specific course of action or any action at all. By receiving this document, the recipient acknowledges and agrees with the intended purpose described above and further disclaims any expectation or belief that the information constitutes investment advice to the recipient or otherwise purports to meet the investment objectives of the recipient. The financial instruments described in the document may not be eligible for sale in all jurisdictions or to certain categories of investors. The value of any investment or income may go down as well as up, and investors may not get back the full (or any) amount invested. Past performance is not necessarily a guide to future performance. Neither Ausbil nor any of its directors, employees or agents accepts any liability for any loss (including investment loss) or damage arising out of the use of all or any of the Information. Prior to making any investment or financial decisions, any recipient of this document or the information should take steps to understand the risk and return of the investment and seek individualised advice from his or her personal financial, legal, tax and other professional advisors that takes into account all the particular facts and circumstances of his or her investment objectives. Any prices stated in this document are for information purposes only and do not represent valuations for individual securities or other financial instruments. There is no representation that any transaction can or could have been effected at those prices, and any prices do not necessarily reflect Ausbil's internal books and records or theoretical model-based valuations and may be based on certain assumptions. Different assumptions by Ausbil or any other source may yield substantially different results. No representation or warranty, either expressed or implied, is provided in relation to the accuracy, completeness or reliability of the information contained in any materials to which this document relates (the "Information"), except with respect to Information concerning Ausbil. The Information is not intended to be a complete statement or summary of the securities, markets or developments referred to in the document. Ausbil does not undertake to update or keep current the Information. Any opinions expressed in this document may change without notice and may differ or be contrary to opinions expressed by other business areas or groups, personnel or other representative of Ausbil. Any statements contained in this Report attributed to a third party represent Ausbil's interpretation of the data, Information and/or opinions provided by that third party either publicly or through a subscription service, and such use and interpretation have not been reviewed by the third party. In no circumstances may this document or any of the Information (including any forecast, value, index or other calculated amount ("Values")) be used for any of the following purposes: (i) valuation or accounting purposes; (ii) to determine the amounts due or payable, the price or the value of any financial instrument or financial contract; or (iii) to measure the performance of any financial instrument including, without limitation, for the purpose of tracking the return or performance of any Values or of defining the asset allocation of portfolio or of computing performance fees. By receiving this document and the Information you will be deemed to represent and warrant to Ausbil that you will not use this document or any of the Information for any of the above purposes or otherwise rely upon this document or any of the Information. Except as otherwise specified herein, these materials are distributed by Ausbil, to persons who are eligible counterparties or professional clients and are only available to such persons. The Information does not apply to, and should not be relied upon by, retail clients. The information contained in this document is given by Ausbil Investment Management Limited (ABN 2676316473) (AFSL 229722) (Ausbil) and has been prepared for informational and discussion purposes only and does not constitute an offer to sell or solicitation of an offer to purchase any security or financial product or service. Any such offer or solicitation shall be made only pursuant to an Australian Product Disclosure Statement or other offer document (collectively Offer Document) relating to an Ausbil financial product or service. A copy of the relevant Offer Document may be obtained by calling Ausbil on +612 9259 0200 or by visiting www.ausbil.com.au. You should consider the Offer Documents in deciding whether to acquire, or continue to hold, any financial product. This document is for general use only and does not take into account your personal investment objectives, financial situation and particular needs. Ausbil strongly recommends that you consider the appropriateness of the information and obtain independent financial, legal and taxation advice before deciding whether to invest in an Ausbil financial product or service. The information provided by Ausbil has been done so in good faith and has been derived from sources believed to be accurate at the time of completion. While every care has been taken in preparing this information. Ausbil make no representation or warranty as to the accuracy or completeness of the information provided in this video, except as required by law, or takes any responsibility for any loss or damage suffered as a result or any omission, inadequacy or inaccuracy. Changes in circumstances after the date of publication may impact on the accuracy of the information. Ausbil accepts no responsibility for investment decisions or any other actions taken by any person on the basis of the information included. Past performance is not a reliable indicator of future performance. Ausbil does not guarantee the performance of any strategy or fund or the securities of any other entity, the repayment of capital or any particular rate of return. The performance of any strategy or fund depends on the performance of its underlying investments which can fall as well as rise and can result in both capital gains and losses. Canada This document does not pertain to the offering of any securities. This document is not, and under no circumstances is to be construed as, an advertisement or a public offering of the securities described in Canada. No securities commission or similar authority in Canada has reviewed or in any way passed upon this document or the merits of the securities, and any representation to the contrary is an offence. Sweden The information contained in the document is given by Ausbil and has been prepared for information and discussion purposes only and does not constitute an offer to sell or solicitation of an offer to purchase any security or financial product or service. It is provided to you as an institutional investor as that term is understood under Swedish law. By reading this document, you agree to be bound by these limitations, terms and conditions set out in the paragraphs above. United Arab Emirates & Kuwait This information relates to a Fund which is not subject to any form of regulation or approval by the Dubai Financial Services Authority ("DFSA"). The DFSA has no responsibility for reviewing or verifying any Prospectus or other documents in connection with this Fund. Accordingly, the DFSA has not approved this or any other associated documents nor taken any steps to verify the information set out in this Prospectus, and has no responsibility for it. The Units to which this Report relates may be illiquid and/or subject to restrictions on their resale. Prospective purchasers should conduct their own due diligence on the Units If you do not understand the contents of this document you should consult an authorized financial adviser. This information does not constitute or form part of any offer to issue or sell, or any solicitation of any offer to subscribe for or purchase, any securities or investment products in Kuwait, UAE (including the Dubai International Financial Centre) and accordingly should not be construed as such. Furthermore, this information is being made available on the basis that the recipient acknowledges and understands that the entities and securities to which it may relate have not been approved, licensed by or registered with the UAE Central Bank, the UAE Securities & Commodities Authority, the Dubai Financial Services Authority or any other relevant licensing authority or governmental agency in the UAE. The content of this Report has not been approved by or filed with the CBK, UAE Central Bank, the UAE Securities & Commodities Authority or Dubai Financial Services Authority. United Kingdom This information may be issued in the United Kingdom to, and/or is directed at, only persons to or at whom it may lawfully be issued, or directed under the Financial Services and Markets Act 2000 (Financial Promotion) Order 2005 (as amended) including persons who are authorised under the Financial Services and Markets Act 2000 ("FSMA"), certain persons having professional experience in matters relating to investments, high net worth companies, high net worth unincorporated associations or partnerships, or trustees of high value trusts. The services described in it are only available to such persons in the United Kingdom and this document must not be relied or acted upon by any other persons in the United Kingdom. By reading this document, you agree to be bound by these limitations, terms and conditions set out in the paragraphs above. Australia The information contained in this Report has been prepared for general use only and does not take into account your personal investment objectives, financial situation or particular needs. Ausbil is the issuer of the Ausbil Australian Active Equity Fund (ARSN 089 996 127), Ausbil Australian Geared Equity Fund (ARSN 124 196 407), Ausbil Australian Emerging Leaders Fund (ARSN 089 995 442), Ausbil MicroCap Fund (ARSN 130 664 872), Ausbil Australian SmallCap Fund (ARSN 630 022 909), Ausbil Balanced Fund (ARSN 089 996 949), Ausbil Active Dividend Income Fund (ARSN 621 670 120), Ausbil Australian Concentrated Fund (ARSN 622 627 696), Ausbil Active Sustainable Equity Fund (ARSN 623 141 784), Ausbil Global SmallCap Fund (ARSN 623 619 625), Candriam Sustainable Global Equity Fund (ARSN 111 733 898), Ausbil 130/30 Focus Fund (ARSN 124 196 621), Ausbil Long Short Focus Fund (ARSN 642 635 498), Ausbil Global Essential Infrastructure Fund (ARSN 628 816 151), Ausbil Global Resources Fund (ARSN 623 619 590) and MacKay Shields Multi-Sector Bond Fund (ARSN 611 482 243) (collectively known as 'the Funds').The information provided is factual only and does not constitute financial product advice. It does not take account of your individual objectives, financial situation or needs. Before you make any decision about whether to invest in a financial product, you should obtain and consider the Product Disclosure Statement of the financial product. The information provided by Ausbil Investment Management Limited (ABN 26 076 316 473 AFSL 229722) has been done so in good faith and has been derived from sources believed to be accurate at the time of compilation. Changes in circumstances, including unlawful interference and unauthorised tampering, after the date of publication may impact on the accuracy of the information. Ausbil Investment Management Limited accepts no responsibility for any inaccuracy or for investment decisions or any other actions taken by any person on the basis of the information included. Past performance is not a reliable indicator of future performance. Ausbil Investment Management Limited does not guarantee the performance of the Funds, the repayment of capital or any particular rate of return. The performance of any unit trust depends on the performance of its underlying investment which can fall as well as rise and can result in both capital losses and gains. Consequently, due to market influences, no assurance can be given that all stated objectives will be achieved. United States AN INVESTMENT IN THE FUND IS SPECULATIVE AND INCLUDES A HIGH DEGREE OF RISK, INCLUDING THE RISK OF A TOTAL LOSS OF CAPITAL. INTERESTS IN THE FUND WILL BE ILLIQUID AND SUBJECT TO SIGNIFICANT RESTRICTIONS ON TRANSFER. PROSPECTIVE INVESTORS SHOULD BE AWARE THAT THEY MAY BE REQUIRED TO BEAR THE RISKS ASSOCIATED WITH SUCH INVESTMENT FOR AN INDEFINITE PERIOD OF TIME. A PRIVATE OFFERING OF INTERESTS IN THE FUND WILL ONLY BE MADE PURSUANT TO THE FUND'S PRODUCT DISCLOSURE STATEMENT (THE "PDS"), AND RELATED DOCUMENTATION FOR THE FUND, WHICH WILL BE FURNISHED TO QUALIFIED INVESTORS ON A CONFIDENTIAL BASIS AT THEIR REQUEST FOR THEIR CONSIDERATION IN CONNECTION WITH SUCH OFFERING, WHO SHOULD CAREFULLY REVIEW SUCH DOCUMENTS PRIOR TO MAKING AN INVESTMENT DECISION. ANY INVESTMENT DECISION WITH RESPECT TO SUCH INTERESTS MUST BE BASED SOLELY ON THE DEFINITIVE AND FINAL VERSIONS OF SUCH DOCUMENTS. The information contained herein will be superseded by, and is qualified in its entirety by reference to the PDS, which contains additional information about the investment objective, terms and conditions of an investment in the Fund and also contains tax information, information regarding conflicts of interest and risk disclosures that are important to any investment decision regarding the Fund. No person has been authorized to make any statement concerning the Fund other than as set forth in the PDS and any such statements, if made, may not be relied upon. The information contained in this Report must be kept strictly confidential and may not be reproduced (in whole or in part) or redistributed in any format without the express written approval of AUSBIL INVESTMENT MANAGEMENT LIMITED (together with its affiliates, the "Firm"). Neither the Firm nor any of its affiliates makes any representation or warranty, express or implied, as to the accuracy or completeness of the information contained herein and nothing contained herein should be relied upon as a promise or representation as to past of future performance of the Fund or any other entity. Except where otherwise indicated herein, the information provided in this Report is based on matters as they exist as of the date of the document and not as of any future date, and will not be updated or otherwise revised to reflect information that subsequently becomes available, or circumstances existing or changes occurring after the date hereof. This Report has not been approved by the U.S. Securities and Exchange Commission (the "SEC"), the Financial Industry Regulatory Authority ("FINRA"), or any other regulatory authority or securities commission in the United States or elsewhere and does not constitute an offer to sell, or a solicitation of any offer to buy, any securities. This Report is not to be relied upon as investment, legal, tax, or financial advice. Any investor must consult with his or her independent professional advisors as to the investment, legal, tax, financial or other matters relevant to the suitability of an investment in the interests of the Fund. The reader is urged to read the sections in the PDS addressing risk factors, conflicts of interest and other relevant investment considerations. The Interests may not be transferred or resold except as permitted under the Securities Act and any applicable U.S. or non-U.S. securities laws. The Interests have not been reviewed or approved by any U.S. federal, other U.S. or non-U.S. securities commission or regulatory authority. Interests are not and will not be insured by the U.S. Federal Deposit Insurance Company or any government agency, are not guaranteed by any bank and are subject to investment risks, including the loss of an investor's entire principal amount invested. Investors should be aware that they may be required to bear the financial risks of an investment in the Interests for an indefinite period of time because the Interests (i) cannot be sold unless they are subsequently registered under any and all applicable securities laws in the United States, or an exemption from registration exists and (ii) are subject to the restrictions on transfer contained in the offering document or limited partnership agreement of the Fund. The reader must comply with all applicable laws and regulations in any jurisdiction in which it subscribes for an investment; and the reader, by its acceptance of this report, agrees that the Firm and the Fund will not have any responsibility for the reader's compliance with such laws and regulations. The Firm is registered as an investment adviser with the U.S. Securities & Exchange Commission. Certain information contained in this Report constitutes "forward-looking statements," which can be identified by the use of forward-looking terminology such as "may," "will," "should," "expect," "anticipate," "target," "project," "estimate," "intend," "continue" or "believe," or the negatives thereof or other variations thereon or comparable terminology. Due to various uncertainties and risks, actual results and performance of the Fund may differ materially from those reflected or contemplated in such forward-looking statements A short notice on the COVID-19 public health event, and how it can impact investments Given the currently evolving issues around the Coronavirus (or Covid-19) globally, which has officially been designated a pandemic by the World Health Organisation, we wish to notify that, as with many firms, business may be disrupted. A public health crisis, pandemic, epidemic or outbreak of a contagious disease, such as the recent outbreak of Coronavirus (or Covid-19) in Australia, Italy, China, South Korea, the United States and other countries, could have an adverse impact on global, national and local economies, which in turn could negatively impact investment returns in any of Ausbil Investment Management Limited's registered managed investment schemes (the Funds). Disruptions to commercial activity relating to the imposition of quarantines or travel restrictions (or more generally, an inability on behalf of authorities to contain this pandemic) may adversely impact any investment, including by delaying or causing supply chain disruptions or by causing staffing shortages. The outbreak of Coronavirus has contributed to, and may continue to contribute to, volatility in financial markets. The impact of a public health crisis such as the Coronavirus (or any future pandemic, epidemic or outbreak of a contagious disease) is difficult to predict, which presents material uncertainty and risk with respect to any investment or fund performance. |

19 Oct 2021 - Performance Report: Longlead Pan-Asian Absolute Return Fund
| Report Date | |
| Manager | |
| Fund Name | |
| Strategy | |
| Latest Return Date | |
| Latest Return | |
| Latest 6 Months | |
| Latest 12 Months | |
| Latest 24 Months (pa) | |
| Annualised Since Inception | |
| Inception Date | |
| FUM (millions) | |
| Fund Overview | |
| Manager Comments | Longlead noted equity markets had a challenging quarter, initially driven by concerns over the imposition of regulations on a number of industries in China and ongoing challenges to global supply chains. Later in the quarter, these worries extended to rising bond yields and the spectre of reduced central bank support for markets in the period ahead. In September, China Evergrande Group, China's largest property developer, announced that a slowdown in property sales was placing pressure on its cash flow and putting it at risk of defaulting on its debt repayments. This created widespread concern of broader contagion in the debt markets that flowed through to weaker performance in equities. The cumulative impact of these factors resulted in the weakest period of equity market performance since the outbreak of the pandemic in the March 2020 quarter. The Fund navigated this challenging backdrop effectively, generating positive returns on both the long and short sides of the portfolio in the quarter. The Fund generated positive returns in Consumer Staples, Materials and Information Technology positions, while experiencing draw downs in Healthcare and Communication Services names. By country, gains were realised in Australia, the United States and Japan, while losses were seen in China and Taiwan. |
| More Information |

19 Oct 2021 - Performance Report: Prime Value Emerging Opportunities Fund
| Report Date | |
| Manager | |
| Fund Name | |
| Strategy | |
| Latest Return Date | |
| Latest Return | |
| Latest 6 Months | |
| Latest 12 Months | |
| Latest 24 Months (pa) | |
| Annualised Since Inception | |
| Inception Date | |
| FUM (millions) | |
| Fund Overview | The Fund is comprised of a concentrated portfolio of securities outside the ASX100. The fund may invest up to 10% in global equities but for this portion typically only invests in New Zealand. Investments are primarily made in ASX listed and other exchange listed Australian securities, however, it may also invest up to 10% in unlisted Australian securities. The Fund is designed for investors seeking medium to long term capital growth who are prepared to accept fluctuations in short term returns. The suggested minimum investment time frame is 3 years. |
| Manager Comments | The fund's Sharpe ratio has ranged from a high of 3.23 for performance over the most recent 12 months to a low of 0.91 over the latest 60 months, and is 1.06 for performance since inception. By contrast, the ASX 200 Total Return Index's Sharpe for performance since October 2015 is 0.74. The fund has a down-capture ratio for returns since inception of 45.39%. Over all other periods, the fund's down-capture ratio has ranged from a high of 71.76% over the most recent 36 months to a low of 16.19% over the latest 12 months. A down-capture ratio less than 100% indicates that, on average, the fund has outperformed in the market's negative months over the specified period. |
| More Information |

19 Oct 2021 - Manager Insights | Prime Value Asset Management
|
|
||
|
Damen Purcell, COO of Australian Fund Monitors, speaks with Richard Ivers, Portfolio Manager at Prime Value Asset Management. The Prime Value Emerging Opportunities Fund has a track record of 6 years and has consistently outperformed the ASX 200 Total Return Index since inception in October 2015, providing investors with a return of 16.63%, compared with the index's return of 10.87% over the same time period.
|

19 Oct 2021 - Staying relevant in a fast-changing world
|
Staying relevant in a fast-changing world Aoris Investment Management October 2021 Consumers have never been more fickle, in a world of fast fashion and next-day delivery. Covid has further upended our purchasing behaviours and expectations. Against the odds, luxury goods giant LVMH has become more desirable over many centuries, and emerged from this disruptive period stronger than ever. What's their secret? LVMH (Louis Vuitton Moët Hennessy) is the largest global luxury goods company, owning 75 iconic brands such as those in its name as well as Christian Dior, Sephora, Bulgari and Tiffany. It has a long history of growth and profitability, even through difficult market environments - in fact it has not made a loss in a single year of its existence. Let me share with you five features of this business that have allowed it to prosper in the face of ever-changing consumer preferences. 1. Heritage The Clos des Lambrays vineyard dates back to 1365. Chaumet was founded in 1780 as a jeweller for the French Empress. Louis Vuitton was born 200 years ago and founded his business to make suitcases, featuring the classic monogrammed logo design, for the French royal family. LVMH's brands are steeped in history and tradition. There is a story behind their products, they stand for something. The depth and authenticity of their heritage cannot be replicated by younger luxury goods brands. This heritage and desirability only builds over time, making it even more difficult for new entrants to succeed. 2. Innovation But they aren't just old, tired brands. LVMH has done a great job of straddling tradition with innovation, remaining contemporary and relevant with consumers. It invests over €20 billion each year into creating new products (which represent about a quarter of its sales in a given year), advertising its brands through engaging campaigns, and refurbishing its stores with vibrant and constantly evolving displays. LVMH also has an ongoing annual intake of thousands of new apprentices and talented young designers that bring with them new ideas. Half of LVMH's employees are under the age of 34, which is remarkable for such a longstanding business. 3. Agility There are 75 brands owned by LVMH which operate as largely independent businesses, keeping them agile and entrepreneurial. The company's response to the Covid pandemic was a great validation of this strength. Consumer behaviour changed drastically, with retail stores shut and travel grinding to a halt (which is when a large portion of luxury sales are traditionally made). LVMH adapted more rapidly than its competitors, resulting in massive market share gains and a quick recovery in profits. Its brands continued to invest in new product launches, virtual fashion shows and marketing, unlike others which withdrew their investments. They also found novel ways to serve a local clientele, such as these incredible mobile stores which brought a caravan with a bespoke selection of products directly to the homes of their most valued clients. 4. Control LVMH makes most of its products in-house and sells most of its products through directly operated stores, giving it full reign over the quality of its products, how they're priced (Louis Vuitton is notoriously the only luxury brand that never discounts its products), and the customer experience. Contrast the look and feel of a Louis Vuitton store and the attentive customer service you'd receive in one, to the unorganised mess of a department store. The company is obsessed with product quality, taking the long-term view that if you can focus on satisfying your customers, the financial outcomes will naturally be favourable. It has a high degree of control over its supply chain and materials usage, e.g. recently acquiring a sustainable crocodile leather tannery in Singapore to ensure its supply of a scarce resource, which is proving valuable amid the current global disruptions. 5. Breadth LVMH sells a lot more than Fashion and Leather Goods; it also has businesses across Wines & Spirits (where it is the largest global producer of champagne and cognac), Perfumes & Cosmetics, Watches & Jewellery (where it recently acquired Tiffany) and Retailing (where it owns Sephora). Its breadth across these five divisions, 75 brands and many countries provides valuable balance and resiliency to the inevitable ups and downs in any one area of consumer spending. LVMH's breadth is important when considering the Chinese government's increasingly intrusive stance on the behaviour of its citizens. China has certainly been an important contributor to LVMH's growth, and today Chinese consumers represent a third of its sales across a very broad range of goods. However LVMH is a truly global business that is growing strongly in other geographies as well. The company reported exceptional results in the first half of 2021, where sales grew faster from its US and European customers than in China. LVMH shares have fallen by 10% over the last month, and some of its luxury peers have fared worse, but the market's focus on these events may be masking the business' finer qualities. In conclusion These five attributes have contributed to LVMH's growing desirability, long track record of growth, and enviable profitability. In the Aoris International Fund we own a portfolio of 15 durable, all-weather businesses like LVMH, which we expect to keep compounding in value for many years to come. Funds operated by this manager: |