NEWS

12 Mar 2024 - Wrestling the gorilla
|
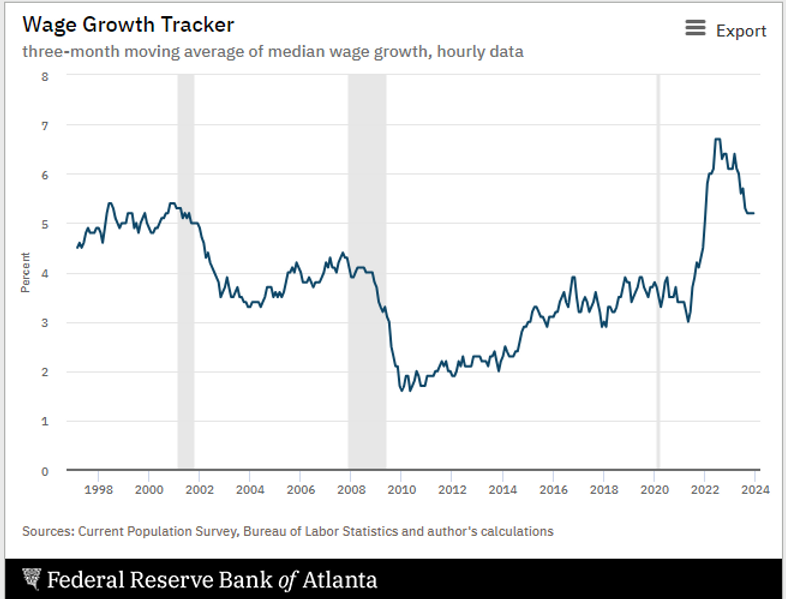
Wrestling the gorilla Insync Fund Managers March 2024 Despite incessant commentary to the contrary, the US economy is the strongest it has been in over 30 years. We have said many times why trying to predict economic outcomes in an upcoming year is fraught with danger. We even charted a few famous commentators and forecasts versus actual outcomes. Simply, no matter how famous or big the institution, or how clever the person, they are wrong far more than right. Given that these macro forward views shape how most fund managers invest and make decisions, it's a worthwhile exercise for advisers to track the managers they use against how successful and aligned to their own commentary they really are. For the record, we are not in the game of forecasting macro settings, as we see little value in it once ego is placed to one side. It's very important with this in mind to note that factually, when everything seems bleakest it is uncannily common for it to be at its brightest. Let's look at the economic gorilla of the world - the US. At the end of 2022 and early 2023, most managers, economists and commentators warned that bad times lay ahead. Here are eight key indicators that show that for last year and indeed for at least 30 years, the US has never been in better shape. 1. Wage growth: Despite all the worry and bleak predictions and what has become accepted as bad times, the reverse is true. Wages experienced 5% growth.
2. GDP: 3.3% Real growth with an annualised run rate of 4.9%.
3. Inflation: This stands at just over 3% nominal. So we're talking 2% real wage growth and 6% nominal economic growth. Several commentators last year worried about a 1970s style stagflation. Remember that? The simple fact is that today's situation looks more like the 1990s economy than the 1970s.
4. Unemployment: This remains stubbornly low, after Covid and government free money distributions. In the 1990s, it averaged 6% and was never as low as 4%. The super-driver of Demographics is playing its part in this.
5. Government debt: Ahh, some wag the finger that it's all debt fuelled, but let's see.
Government debt is indeed a lot higher now than it was back then, and of course $34 trillion is a lot of money but expressed as a percentage of the economic output (% of GDP), is this so different or abnormal? It was far higher in the 1990s and today sits around the longer-term average. 6. Household debt: Whilst looking at debt, let's look at US families and their ability to service their debts and higher rates closer to longer term averages than the last 10 years. It is far, far better than in the 1990s.
7. The federal deficit: Surely this is bad? Let's see.
Yes, it did dip sharply for a short period during the first global pandemic since the 1920s, but it's nearing 1990 levels again. Not as gloomy as many may lead you to believe.
8. What is worse is sentiment: It was last this bad way back in the early 1970s during the great financial crisis, although it has recently bounced back. Unedited, unreviewed, non-expert information, thanks to the social media boom, has likely influenced this - something we didn't have in the 1990s.
Will the good times end? Perhaps it's best said by that infamous barman from the 1980s movie 'Cocktail'... "Everything ends badly otherwise it wouldn't end." The unknown but most essential question is of course when? For those in cash, and there has been a lot sitting on the sidelines for years now, bad times would have to be catastrophic, with an ending of biblical proportions. Not only that, but those in cash would also have to make immediate constant gains and have that continue for years afterwards, just to keep alongside in dollar value terms those who remained invested in productive business assets all these years. The odds of a biblical-sized catastrophe and timing it close enough to exit, then re-enter at the gloomiest most negative point, compared to hanging in and not getting spooked, are very low indeed. #InvestmentstrategyFunds operated by this manager: Insync Global Capital Aware Fund, Insync Global Quality Equity Fund Disclaimer |

8 Mar 2024 - What the higher cost of capital means for investors
|
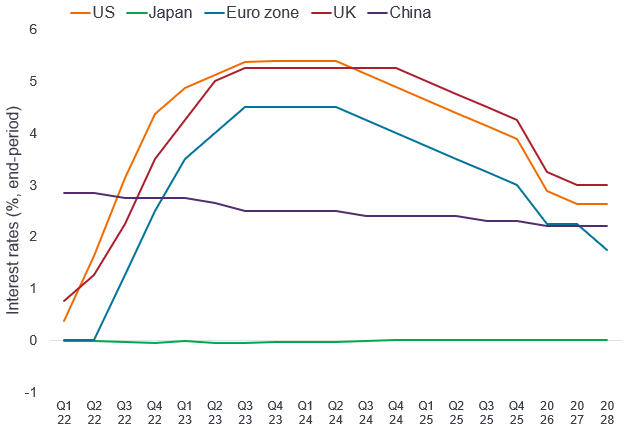
What the higher cost of capital means for investors Janus Henderson Investors February 2024 With borrowing costs for the next decade likely to be meaningfully higher than pre pandemic, how will the investment landscape shift? In the third and final article with the Economist Intelligence Unit (EIU) we explore their expectations, while Janus Henderson CEO Ali Dibadj looks at the implications for investors. Rates to remain highThe cost of capital largely dictates the weather for financial markets and for the companies that rely on them for funding. For much of the past decade, low interest rates have made it cheap for many companies to invest in expansion, but have thinned margins for banks and fixed income funds. The rise in policy rates since 2022 has raised the cost of investment for companies, at a time when they are under pressure to invest heavily in the energy and digital transformations. However, for many of the financial businesses supplying that investment funding - particularly for banks and fixed income funds - higher interest rates raise margins and make their businesses more attractive to investors. We, at the Economist Intelligence Unit (EIU), expect these trends to persist in 2024. The European Central Bank (ECB) and the US Federal Reserve (Fed) are likely to start gradually lowering interest rates from the second half of 2024, but the slow pace of the cuts will soften further as inflation approaches the 2% mark that central banks desire. Markets that followed US policy rates upwards, such as India and Mexico, will follow this downward trend too. Policy rates are already low in China and Japan, and we believe that the cost of capital will remain low in both Asian economies in 2024. Price pressures are likely to remain manageable, and, as a result, the central banks of these countries will look to keep exchange rates attractive in order to boost export competitiveness. Over the rest of EIU's five-year forecast period, interest rates will moderate further in Europe and the US, falling to the 2-3% range by 2028, but will remain higher than during the decade of easy money of the 2010s. Fortunately, global growth is forecast to strengthen to 2.7% a year on average in 2025-28, supporting corporate cashflow and supporting continued investment into technology and clean energy. There are substantial risks to this interest-rate forecast, however, given the possible escalation of the wars in Ukraine and Gaza, as well as US-China tensions over Taiwan, which could disrupt supply chains and fuel inflation over the forecast period. Interest rates will start to fall in 2024
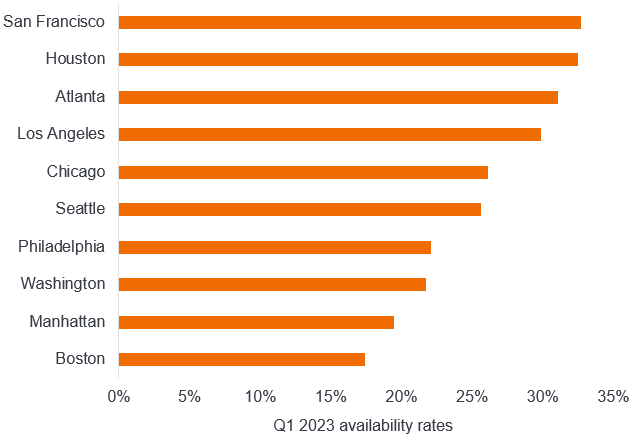
Source: Central banks; EIU as at January 2024. Investors will favour fixed income instruments but avoid certain types of property fundsHigher policy rates have prompted an increase in market interest rates, including those that are applicable for fixed income securities, such as money market instruments, as well as loans and deposits. Asset managers who deal in fixed income securities may potentially benefit from a fillip in returns, bolstered by higher interest rates. This could mark a reversal in the fortunes of bonds and related instruments, shunned by investors during a long period of sluggish, even negative, policy rates. At the end of 2023, investors executed a volte-face, rushing back into money market funds and other instruments that offered positive real returns adjusted for inflation. We expect a dip in interest rates towards the end of 2024 to support both equities and fixed income securities, helping to maintain or boost valuations further. Lower interest rates will ease the burden on company finances while investors could mop up greater real returns from fixed income securities as inflation declines to comfortable levels. These returns will stabilise in developed countries as inflation and interest rates normalise in 2025-28. However, they are likely to narrow in developing countries, where inflation is likely to remain higher, particularly for food. We believe property investments will suffer, however, even more so in China where the sector faces a deep crisis. The future of work is now tilted towards hybrid and some amount of remote work rather than a return to all days in the office, which means that office buildings and centrally located shopping malls have permanently fallen out of favour. Since they are highly leveraged, property companies will likely have to resort to some form of debt restructuring next year. The impact of this indebtedness will feed back to shares of property companies and funds that invest in the sector, making selectivity increasingly important. Funds focusing on warehousing, data centres and infrastructure have the potential, however, to provide appreciably higher returns. Over the longer term, residential development should also support a more general recovery for property investments. Office availability rates have more than doubled in many US downturns
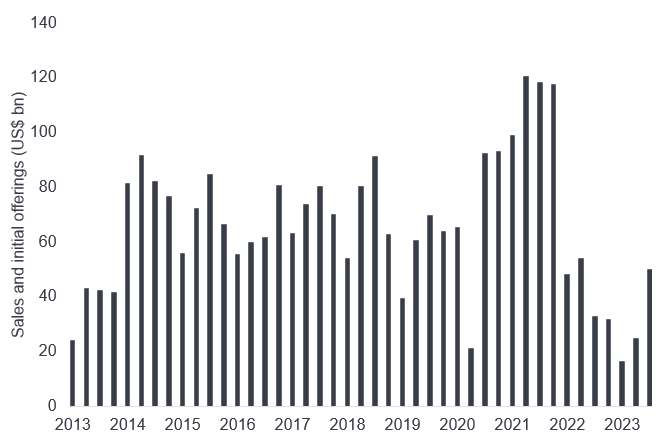
Source: Savills. Startups may struggle, private equity will await rate cutsSteep policy rates have made it harder for startups to raise funds from private investors or via open market listings. With policy rates likely to remain high for at least the first half of 2024, the funding environment will remain difficult for freshly-minted companies in several sectors, including fintech. With highly liquid and safe instruments offering around 5% in markets such as the US, investors are likely to remain markedly risk-averse and selective. New business models are unlikely to attract investors, notwithstanding a recent rush towards artificial intelligence (AI) investments and chipmaker initial public offerings (IPOs), such as the one by ARM, a technology firm headquartered in the UK. Despite coming off a decade-low, asset sales by private equity firms remain feeble
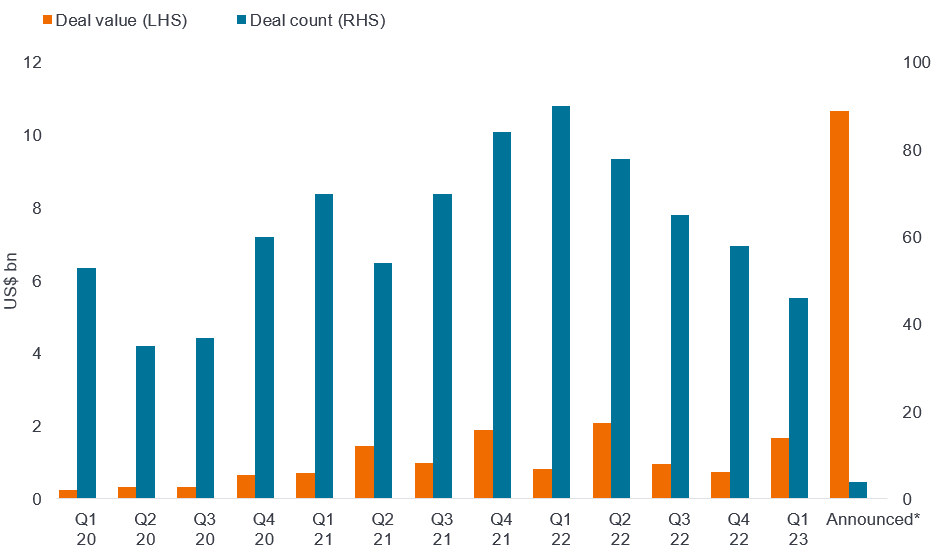
Source: Bloomberg. VC deals for generative AI are gaining traction
Source: PitchBook, as at 1 April 2023. Given these considerations, we believe that the fundraising environment for most startups, including fintech firms, will remain harsh in 2024, with only slow improvements over the following years. As a result, companies will use up the funds built up when policy rates were low as they find new funding hard to come by. IPOs and venture capital-backed companies that do succeed in attracting capital may have to lower their valuations considerably leading to losses for early investors. Even though most central banks, particularly the ECB and the Fed, have paused rate hikes, buyout managers are being hindered by short-term interest rates of nearly 5.5%. Consequently, debt financing remains an expensive proposition and leveraged buyouts remain few and far between. Private equity players are likely to remain on the sidelines until the second half of 2024, when we believe the first rate cuts will occur. Our hawkish outlook for interest rates over the next five years means that it will be a while before we witness the fundraising heydays during the era of easy money. Investment will continue to increase regardlessDespite these constraints, we believe that the outlook for corporate and government investment is positive. Our forecasts for foreign direct investment suggest that inflows will rebound in 2024, amid a resurgence in investment into China as well as continued investment into the US, notably in green-tech sectors supported by government incentives. Gross fixed investment will carry on increasing steadily, as countries focus on building out the infrastructure needed for the energy and digital transitions. There are three main reasons for this sustained investment, which will see money flow in from both governments and corporates. The green and digital transitions are both capital-intensive transformations that are being fully supported by government grants, tax breaks and other tax breaks in many countries, with carbon emissions penalties adding extra impetus. In addition, climate change is likely to increase the depreciation rate of capital, as physical assets will degrade faster with more natural disasters, and money has to be spent on climate-proofing and adaptation. Moreover, the breakdown of relations between China and the US means that more money is being spent on duplication, both for these transformations and for general supply chains. However, investment risks will remain relatively high, and not just for geopolitical reasons. Many borrowers, whether governments, households or companies, will struggle to shoulder heavier burdens on their borrowing, and may miss repayments or default entirely. Levels of non-performing loans (NPLs) have already ticked up somewhat in most major economies, aside from China, where defaults by property developers have already triggered a crisis. These risks are unlikely to trigger financial crises, particularly in developed countries, but they demonstrate that higher interest rates will remain a double-edged sword.
Author: Ali Dibadj, Chief Executive Officer |
|
Funds operated by this manager: Janus Henderson Australian Fixed Interest Fund, Janus Henderson Australian Fixed Interest Fund - Institutional, Janus Henderson Cash Fund - Institutional, Janus Henderson Conservative Fixed Interest Fund, Janus Henderson Conservative Fixed Interest Fund - Institutional, Janus Henderson Diversified Credit Fund, Janus Henderson Global Equity Income Fund, Janus Henderson Global Multi-Strategy Fund, Janus Henderson Global Natural Resources Fund, Janus Henderson Tactical Income Fund This information is issued by Janus Henderson Investors (Australia) Institutional Funds Management Limited ABN 16 165 119 531, AFSL 444266 (Janus Henderson). The funds referred to within are issued by Janus Henderson Investors (Australia) Funds Management Limited ABN 43 164 177 244, AFSL 444268. The value of an investment and the income from it can fall as well as rise and you may not get back the amount originally invested. Past performance is not indicative of future performance. Prospective investors should not rely on this information and should make their own enquiries and evaluations they consider to be appropriate to determine the suitability of any investment (including regarding their investment objectives, financial situation, and particular needs) and should seek all necessary financial, legal, tax and investment advice. This information is not intended to be nor should it be construed as advice. This information is not a recommendation to sell or purchase any investment. This information does not purport to be a comprehensive statement or description of any markets or securities referred to within. Any references to individual securities do not constitute a securities recommendation. This information does not form part of any contract for the sale or purchase of any investment. Any investment application will be made solely on the basis of the information contained in the relevant fund's PDS (including all relevant covering documents), which may contain investment restrictions. This information is intended as a summary only and (if applicable) potential investors must read the relevant fund's PDS before investing available at www.janushenderson.com/australia. Target Market Determinations for funds issued by Janus Henderson Investors (Australia) Funds Management Limited are available here: www.janushenderson.com/TMD. Whilst Janus Henderson believe that the information is correct at the date of this document, no warranty or representation is given to this effect and no responsibility can be accepted by Janus Henderson to any end users for any action taken on the basis of this information. All opinions and estimates in this information are subject to change without notice and are the views of the author at the time of publication. Janus Henderson is not under any obligation to update this information to the extent that it is or becomes out of date or incorrect. |

6 Mar 2024 - Social and Regulatory Risks of AI
|
Social and Regulatory Risks of AI Magellan Asset Management February 2024 |
|
Artificial intelligence (AI) is no longer an abstract concept; it is quickly evolving as an integrated part of our daily lives. From virtual assistants and transportation to eCommerce and even healthcare, AI is continuing to expand its application. As investors, understanding the risks and opportunities associated with this new technology is vitally important. Since the release of OpenAI's ChatGPT in November 2022, investors have recognised the large impact generative AI1 could have on businesses' productivity, growth, and innovation. What are the ESG risks of AI?Despite the incredible benefits that AI can bring to businesses, it comes with significant social risks - privacy concerns, bias, discrimination, misinformation, ethical considerations, job displacement, safety and autonomy to name a few.
However, these risks should be viewed across short-, medium- and long-term horizons for a more detailed understanding of the potential impacts.
Medium-term risks (Next 5 - 10 years): These could include risks of potential job loss, social manipulation, human rights violations and company or economic disruptions. For example:
Long-term risks (10 years and beyond): These could include environmental or existential risks. For example:
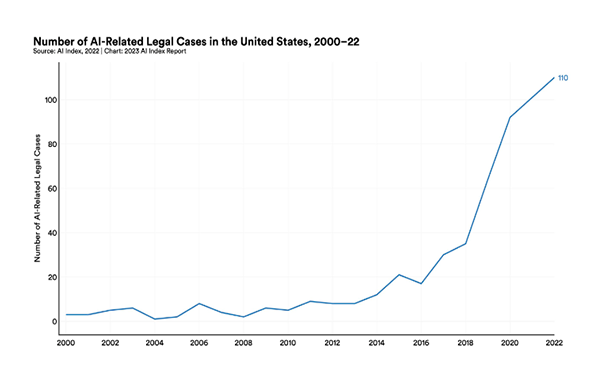
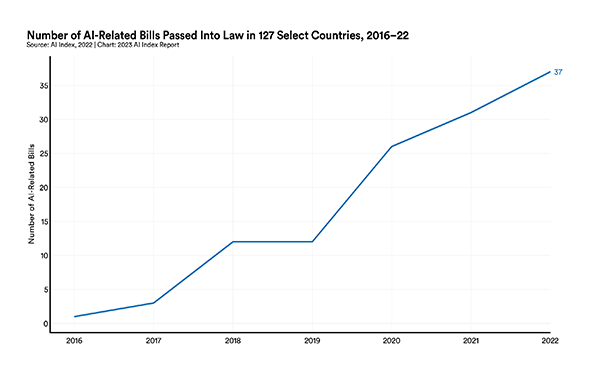
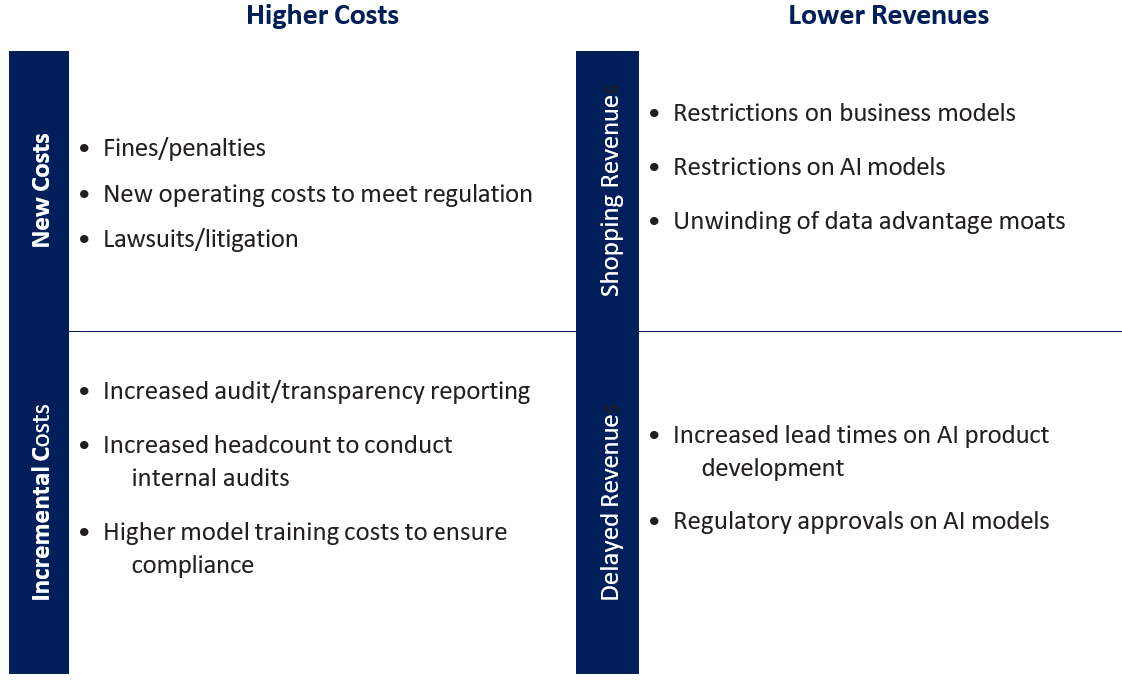
To mitigate these risks, we have seen an increase in regulation across many jurisdictions. It's important that both developers and users of AI technology are factoring these regulatory expectations into their intended use cases, to minimise these potential ESG risks and the potential impacts on cash flows as well as regulatory fines. What impacts could regulatory risks have on companies?AI regulation, if not managed well, could have a negative impact on cash flows for businesses. This may come in the form of higher costs, including potential fines and litigation or increased operating costs to meet regulatory requirements. Regulation could also lead to lower revenues, with constraints on new product developments as an example. Decreases to cash flows What will AI regulation look like?AI regulation has long been discussed but lags developments in technology. Early regulation targeted the short- and medium-term risks - to protect basic data rights, fundamental rights, and democratic freedoms in certain regions. An example of this was seen in New York where AI technology was created and in use for résumé screening long before the AI hiring law (under which employers who use AI in hiring must inform candidates) was implemented in New York. Each jurisdiction is approaching AI regulation differently, ranging from self-regulation and voluntary standards to strict rules with penalties for breaches. European Union (EU): United Kingdom (UK): United States (US): Australia: What's next for AI and regulation?As we have highlighted, one of the challenges of AI regulation is that the current approach is fragmented across different jurisdictions, making it more complex for companies creating or using AI to remain compliant. A way to overcome this would be the adoption of global AI standards to create consistency in how companies ensure responsible AI practices. We will continue to monitor the evolving AI regulation as well as the use of existing legislation for AI use cases such as the copyright infringement court case with The New York Times.4 What does this mean for investors?Investors need to carefully consider the ESG risks associated with AI when making investment decisions. These risks, ranging from reputational damage to regulatory non-compliance and workforce impact, may influence the long-term growth and performance of companies. To help mitigate these risks, investors should have a detailed understanding of the companies they are investing in when it comes to their commitment to responsible AI practices. Rigorous due diligence is essential, involving thorough research and analysis of how companies approach and address social risks associated with AI. Companies that prioritise ethical considerations, engage with stakeholders and navigate regulatory landscapes effectively provide investors with greater confidence their investments are aligned with responsible business practices and are better positioned to withstand potential environmental, social and regulatory challenges associated with AI technologies. At Magellan, social risks associated with AI form part of our company risk assessment and investment thesis. Our investment team undertakes thorough research and company engagement, and continues to monitor risks and how these risks may offset the opportunities. Leading cloud and AI vendor Microsoft, a key exposure in our global equity portfolio, has already integrated initiatives to minimise the risk of regulation including implementing a principled approach to AI development, transparent reporting about its responsible AI learnings, an AI assurance program to bridge customer requirements with regulatory compliance, and internal governance teams integrated as part of leadership. What should AI developers be working towards to minimise risk?
While some of the AI opportunities are being priced into stocks, there are still opportunities to be found, especially where companies can exploit the disruptive potential of AI. |
|
Funds operated by this manager: Magellan Global Fund (Hedged), Magellan Global Fund (Open Class Units) ASX:MGOC, Magellan High Conviction Fund, Magellan Infrastructure Fund, Magellan Infrastructure Fund (Unhedged), MFG Core Infrastructure Fund 1 Generative AI refers to algorithms that can be used to create new content based on the data they were trained on. This can include audio, images, code, text and more. Important Information: This material has been delivered to you by Magellan Asset Management Limited ABN 31 120 593 946 AFS Licence No. 304 301 ('Magellan') and has been prepared for general information purposes only and must not be construed as investment advice or as an investment recommendation. This material does not take into account your investment objectives, financial situation or particular needs. This material does not constitute an offer or inducement to engage in an investment activity nor does it form part of any offer documentation, offer or invitation to purchase, sell or subscribe for interests in any type of investment product or service. You should obtain and consider the relevant Product Disclosure Statement ('PDS') and Target Market Determination ('TMD') and consider obtaining professional investment advice tailored to your specific circumstances before making a decision about whether to acquire, or continue to hold, the relevant financial product. A copy of the relevant PDS and TMD relating to a Magellan financial product may be obtained by calling +61 2 9235 4888 or by visiting www.magellangroup.com.au. Past performance is not necessarily indicative of future results and no person guarantees the future performance of any financial product or service, the amount or timing of any return from it, that asset allocations will be met, that it will be able to implement its investment strategy or that its investment objectives will be achieved. This material may contain 'forward-looking statements'. Actual events or results or the actual performance of a Magellan financial product or service may differ materially from those reflected or contemplated in such forward-looking statements. This material may include data, research and other information from third party sources. Magellan makes no guarantee that such information is accurate, complete or timely and does not provide any warranties regarding results obtained from its use. This information is subject to change at any time and no person has any responsibility to update any of the information provided in this material. Statements contained in this material that are not historical facts are based on current expectations, estimates, projections, opinions and beliefs of Magellan. Such statements involve known and unknown risks, uncertainties and other factors, and undue reliance should not be placed thereon. No representation or warranty is made with respect to the accuracy or completeness of any of the information contained in this material. Magellan will not be responsible or liable for any losses arising from your use or reliance upon any part of the information contained in this material. Any third party trademarks contained herein are the property of their respective owners and Magellan claims no ownership in, nor any affiliation with, such trademarks. Any third party trademarks that appear in this material are used for information purposes and only to identify the company names or brands of their respective owners. No affiliation, sponsorship or endorsement should be inferred from the use of these trademarks. This material and the information contained within it may not be reproduced, or disclosed, in whole or in part, without the prior written consent of Magellan. |

5 Mar 2024 - New Funds on Fundmonitors.com
|
New Funds on FundMonitors.com |
|
Below are some of the funds we've recently added to our database. Follow the links to view each fund's profile, where you'll have access to their offer documents, monthly reports, historical returns, performance analytics, rankings, research, platform availability, and news & insights. |
 |
||||||||||||||||||||||
| JPMorgan Global Research Enhanced Index Equity Trust (Unhedged) | ||||||||||||||||||||||
|
||||||||||||||||||||||
| View Profile | ||||||||||||||||||||||
| JPMorgan Global Research Enhanced Index Equity Trust (Hedged) | ||||||||||||||||||||||
|
||||||||||||||||||||||
| View Profile | ||||||||||||||||||||||
| JPMorgan Climate Change Solutions Active ETF (Managed Fund) | ||||||||||||||||||||||
|
||||||||||||||||||||||
| JPMorgan Emerging Markets Research Enhanced Index Equity Active ETF (Managed Fund) | ||||||||||||||||||||||
|
||||||||||||||||||||||
| JPMorgan Global Research Enhanced Index Equity Active ETF (Managed Fund) | ||||||||||||||||||||||
|
||||||||||||||||||||||
| View Profile | ||||||||||||||||||||||
|
Want to see more funds? |
||||||||||||||||||||||
|
Subscribe for full access to these funds and over 800 others |

4 Mar 2024 - Opportunity: 3 big disconnects in infrastructure

1 Mar 2024 - Looking through the headline noise
|
Looking through the headline noise Ox Capital (Fidante Partners) February 2024 Reality vs. sentimentWe are seeing a clear dislocation between reality and stock market sentiment. Contrary to news headlines of a lacklustre macro-economic environment and outlook, quality companies continue to execute and grow earnings. The overall economy is resilient and showing pockets of strength. Headwinds to the property market are manageable and well understood. Our base case is the Chinese economy will grow this year (4.5% to low 5% range) and we continue to expect the Chinese authorities to provide support for the economy to restore confidence. After sharp pullbacks in Chinese equities, the authorities are intervening, introducing various measures to support the stock market. It's important to look through the noise. Return of the flow. Daily volumes of on shore ETFs have spiked. This is important, as the National Team (China's Sovereign Fund) has proactively intervened with direct purchase of equities/ETFs to support the market. The Sovereign fund also vows to further increase ETF holdings to support the market as needed. This reminds us of when the Hong Kong government stepped in during the Asian Crisis to support the market and uphold stability. 
Recurring headlines are somewhat old news. Despite recent headlines, the Chinese property downturn is in fact quite advanced. This is a well-known fact as sales are down over 40% since peak. Developer loans exposure to the baking system is low (less than 6%). Distressed developers have defaulted, while contagion to the trust industry is low and very manageable. The news of property developer Evergrande's inevitable collapse was well known despite recent articles highlighting its demise. Again, it's important to look through the noise. The government extending support for local developers (both private and state owned) through banks with measures to improve developers' liquidity will further improve confidence. Moreover, China's real estate investment relative to GDP remains one of the lowest relative to other major economies while sales are approaching sustainable levels after years of declines. Finally, the government continues to show willingness to provide support by easing policy further. The PSL (China's version of QE) grew in December and January to fund urban village redevelopment and social housing. In addition, the PBoC recently lowered the deposit reserve ratio requirements of financial institutions by 0.5%, in-line with prior guidance of further monetary policy easing. As such, the reduction in reserve requirements will provide liquidity, benefiting the real estate market and economy overall, supporting consumer confidence even further. We do acknowledge however, the stimulus measures all up (including urban redevelopment, lower mortgage rates, ect..) will take time to fully restore confidence and strengthen the economic outlook. 
China is not Japan's "Lost Decade": There have been a recent uptick in headlines and concerns that China's outlook is similar to Japan in the 1990s when there was a period of economic stagnation and a significant slow-down in economic activity and the asset bubble eventually collapsed. Notable differences:
  Right now, valuations for Chinese equities are at depressed levels, and at a time when government authorities are dedicated to restoring confidence and reinvigorating the economy. Quality businesses will continue to grow and become champion businesses in coming years. Now is the time to invest and take advantage of the very attractive valuations. As we have stated previously, it is important to consider the multiple catalysts and act now given 1) valuations are extremely cheap, 2) property market is stabilising, 3) China QE "PSL" is supporting the economy (and restoring confidence) at this juncture, 4) Chinese capital replacing international flows in Hong Kong equities market, 5) National Team providing stability, and 6) geopolitical stabilisation. Funds operated by this manager: |

29 Feb 2024 - Just Eat the Marshmallow: Why Wait When Value Is Already on the Table?
|
Just Eat the Marshmallow: Why Wait When Value Is Already on the Table? Redwheel January 2024 |
|
Ah, January. Just the word sends shivers of excitement down the spines of gym proprietors across the world, salivating at the prospect of new year's resolutioners confidently paying for a full year's membership, only to slink away sometime in March. Yes, it is the season for attempting to better oneself, and crucial to that effort is self-control and discipline: being able to say no to that sweet treat, and dragging yourself out of bed for that early morning run. Self-control's influence on success has been a topic of extensive study, one of the most famous involving four-year-olds, and marshmallows. In the experiment [1], Walter Mischel, a psychology professor at Stanford University, placed a single marshmallow on a table in front of several hundred children (one at a time, mind you). He would then leave the room for a few minutes, and if, by the time he came back, the child had resisted the urge to eat the marshmallow, they would earn a second marshmallow. Fun as though this experiment must have been - at least for the children - the most interesting results came years later, when the researchers followed up with the now-grown subjects of their study. There was a strong correlation between the length of time that a child was able to resist eating the marshmallow - taken as a proxy for self-control - and their academic test results, weight, life satisfaction, mental health, and earnings. The longer the wait, the better the outcome. While some dispute the efficacy of this study, the general principle of self-control as a route to success in life is hardly controversial. When it comes to investing, however, we would caution against the alluring promise of additional sweets and advise instead: just eat the marshmallow. And here is where the key difference between the experimental bonus marshmallow and corporate earnings comes in: waiting for the extra marshmallow may be a good use of self-control when it is promised by a psychologist in a white coat, because you know that it is coming; the same, alas, is not necessarily true with companies. Why wait and rely on hopes that high future growth materialises when you can invest in companies already trading at more reasonable valuations? As value investors, we look to buy companies at a significant discount to intrinsic value, or the true worth of a business, based on a conservative assessment of its earnings power over time, and the money that will need to be reinvested to sustain that earnings power. A key part of that process is in trying to figure out what the business can earn realistically, and not getting too absorbed in expectations for sky-high earnings growth. Helpfully, earnings tend to be tied to a number of things, including the assets that the business can utilise and, importantly, what the business has previously demonstrated that it can earn. After all, paying a reasonable price for established earnings doesn't require great feats of corporate athleticism to turn into a good result for investors. By contrast, when you pay a large price relative to the historic earnings power, you are baking in assumptions of good-to-exceptional growth; figuring out ahead of time which companies are going to deliver that growth, and which will disappoint, is an almost impossible task. Paying for that growth upfront leaves no room for error: you likely won't beat the market by being right most of the time if you are betting on the outcomes as certain. Consider a company priced at 50x its most recent earnings [2]. To justify that price, we need to distil into a single value all the future earnings of the business: the way that this is done is typically by taking a nearer-term picture of income, say, over the next ten years, and then adding on a "terminal value", the net worth of the business after that forecast - a sum intended to reflect long-run value. These figures are then expressed as a present value - namely, what the sum of the cashflows is worth today - and that present value is the price at which investors buy and sell companies in the market. To justify a price of 50x current earnings, investors would have to assume that earnings per share grow at 15% each year for the next ten years - a herculean feat - and assume a longer-term growth rate of about 3.0%. Even then, with such staggering success, the price can still only be justified by utilising a required rate of return of 8.0%, which some may see as insufficiently low for the associated risk [3]. Finally, even after generating such incredible earnings growth for ten years, paying 50x today's earnings means that today's present value is still mostly made up of the "terminal value", which represents a whopping 73% of the current asking price:
Source: Redwheel. The information shown above is for illustrative purposes. To pay such a price, therefore, investors need to feel certain of the future, certain that by ignoring more reasonably priced companies today - the lonely single marshmallow presented at the start of our experiment - they are going to be rewarded with phenomenal growth for a very long time into the future, and earn themselves an extra marshmallow. Assuming such extreme growth for such a long time makes value investors like us nervous. If we don't make any heroic assumptions [4], and pay a much lower price relative to current earnings, the reliance of our current business value on the outcome of the long-term future falls fast, with the "terminal value" comprising only 30% of today's price, if we pay only 9x current earnings. That means that if both our theoretical companies announced that they were going to cease to exist in ten years, our investment would retain 70% of its value, compared with the higher-priced company, which would be worth only 27% of the price paid.
Source: Redwheel. The information shown above is for illustrative purposes. We make this point to underscore the importance of thinking carefully about the expectations - explicit or implicit - that are built into market prices for businesses, and the chances of those expectations paying off. Unlike in a lab, in the real economy it is, in our opinion, foolish to assume that more marshmallows will always be forthcoming, and we believe investors should think carefully before turning one down today. So next time you hear analysts confidently predicting that Company X or Y is going to make $25 per share of earnings in 10 years' time, and $250 in 20 years' time - ask them to take out their wallets and bet on it. We, on the other hand, would gladly tell you that we cannot precisely predict what earnings will be in 10- or 20-years' time, and we don't need to - because we haven't paid much for them in advance, preferring to base our view of sustainable earnings power on the demonstrated historical earnings capabilities of an enterprise. While many are trying to predict the future, we are simply trying to put the present in the context of the past. In the investment world, we find simply eating the marshmallow in front of us requires the most self-control - and can often make the most sense. Author: Shaul Rosten |
|
Funds operated by this manager: Redwheel China Equity Fund, Redwheel Global Emerging Markets Fund |
|
Sources: [1] Mischel W, Ebbesen EB, Zeiss AR. Cognitive and attentional mechanisms in delay of gratification. J Pers Soc Psychol. 1972 Feb;21(2):204-18. doi: 10.1037/h0032198. PMID: 5010404. (https://pubmed.ncbi.nlm.nih.gov/5010404/) [2]We can think of a few culprits, who shall remain nameless; one rhymes with Badobe [3] I would be one of those people [4] In this case, 2.5% annualised per share earnings growth, a 2.0% perpetual growth rate, and a 15.0% discount rate Key Information |

28 Feb 2024 - Global Matters: Gridlock - the vital role of Australia's transmission infrastructure

27 Feb 2024 - Australian Secure Capital Fund - Market Update
|
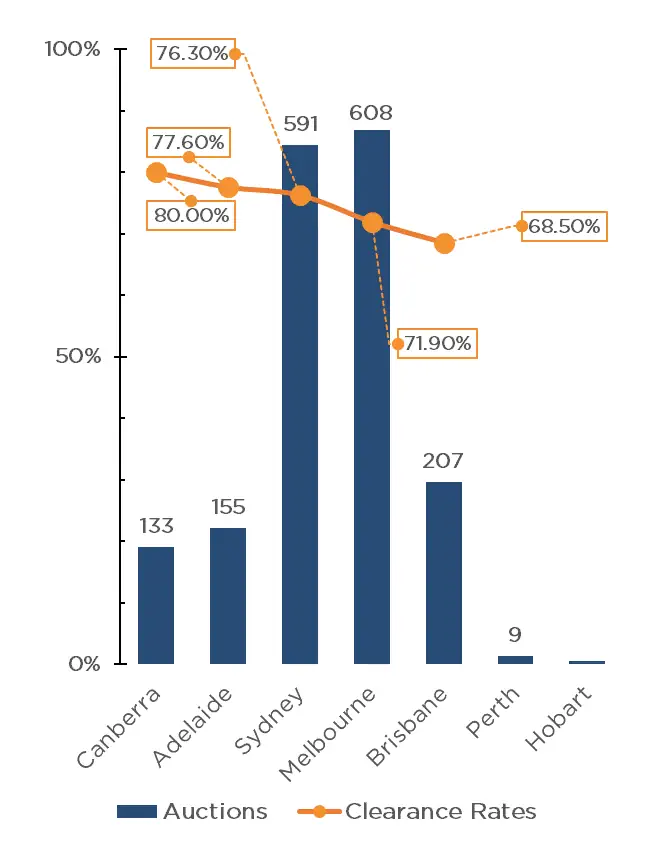
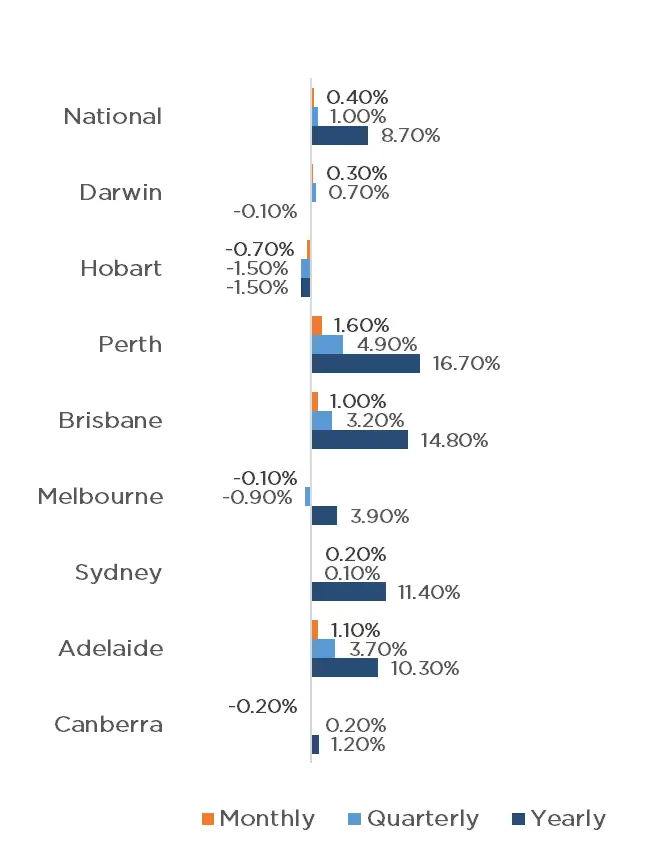
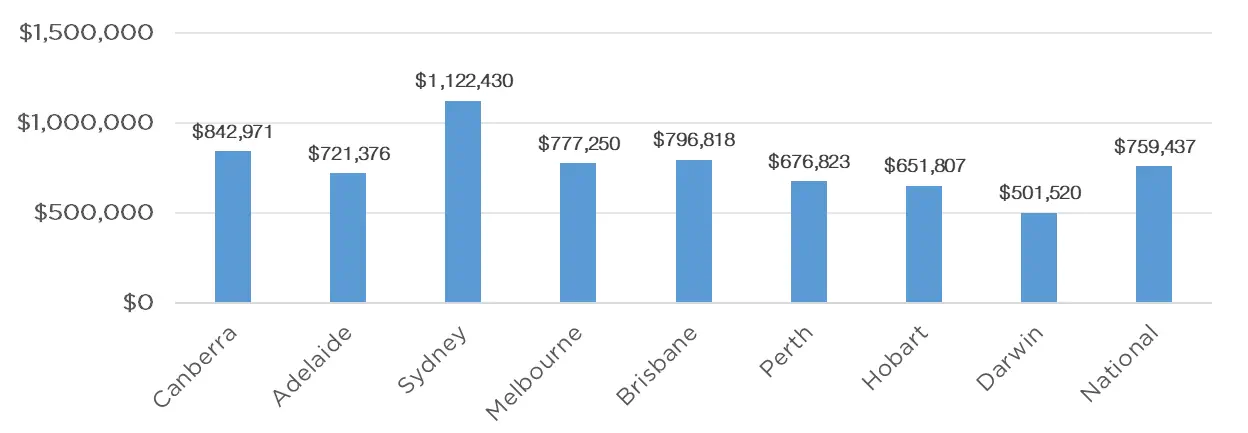
Australian Secure Capital Fund - Market Update Australian Secure Capital Fund February 2024 The first RBA meeting of the year has taken place, with the cash rate remaining on hold at 4.35%. Recent inflation data has given economists confidence that we have reached the end of the rate hike cycle. The first weekend of February brought the start of the 2024 auction season, with a mammoth 1,671 auctions being held across the combined capitals. This is the second largest opening weekend since 2008, with only the corresponding weekend in 2022 holding more auctions, with 1,779 taking place. This result was up 26.4% on 2023 data, and was more than double than double the number of auctions held over the year so far (803). Melbourne recorded the most auctions for the weekend, with 603 taking place, followed closely by Sydney with 562. Brisbane, Adelaide and Canberra also recorded triple digit auction numbers with 203, 159 and 132 auctions taking place respectively, whilst Perth and Tasmania held just 9 and 3 auctions respectively. Preliminary clearance rates have also begun the season strongly, with a clearance rate of 73.9% across the combined capital cities, well above the 61.9% of 2023. Canberra led the way with 80.0%, followed by Adelaide, Sydney and Melbourne with 77.6%, 76.3% and 71.9% respectively. Brisbane being the only capital below 70% with a 68.5% result. The property market continues to show growth, albeit signs of cooling do exist, with a 0.4% increase across both the combined capitals and regionals. Perth continues to experience the highest rate of growth, increasing by 1.6% for January, followed by Adelaide and Brisbane with 1.1% and 1% respectively. Darwin and Sydney also experienced growth of 0.3% and 0.2% respectively, whilst prices in Melbourne, Canberra and Hobart have fallen by 0.1%, 0.2% and 0.7% respectively. The annual change remains significant with a 10% increase across the combined capitals, and 4.9% increase for regional centers, contributing to a national increase of 8.70%. This has been driven by four of the capitals experiencing double figure growth with 16.70% for Perth, 14.80% for Brisbane, 11.40% for Sydney and 10.30% for Adelaide. Melbourne and Canberra also recorded growth for the year with 3.90% and 1.20% whilst only Darwin and Hobart saw prices fall for the year with 0.1% and 0.4% respectively. This has led to Brisbane now holding the second highest median value in the country, overtaking Melbourne with a median value of $796,818 compared to Melbourne's $777,250. Whilst the property market has begun to show signs of easing, given that economists predict we are at the end of the rate hike cycle, we anticipate that property prices will still experience growth throughout 2024, as interest rates begin to subside, and the lack of housing supply continues. Clearance Rates & Auctions week of 4th of February 2024
Property Values as at 1st of February 2024
Median Dwelling Values as at 1st of February 2024
Quick InsightsWill Values Fall? Unlikely.With home values in capitals such as Sydney still 2.4% lower than their peaks, many investors such as Sydney-based investor Nicholas Marangos-Gilks are more motivated than ever to increase demand in the market. Buyers are not waiting for the rate cut to occur. Tim Lawless, CoreLogic research director, has commented, "We are still seeing housing values below their record highs in Sydney, Melbourne, Hobart, Darwin and the ACT. In these cities we could see motivation from buyers looking to get into the market while values are still below their peaks." Source: Australian Financial Review Looser Planning, not Restrictive TaxesEliminating negative gearing and ditching capital gains tax discounts will not solve the worsening housing affordability crisis, but boosting supply by easing planning rules will, a new report says. Centre for Independent Studies chief economist and former Reserve Bank official Peter Tulip said restrictive planning rules have added more than 40% to house prices in Sydney and Melbourne, while property taxes boosted values by 4% at most. "There are arguments from the tax policy perspective that negative gearing and the capital gains discount should be considered, but it's not relevant to the question of housing affordibility," he said. Source: Australian Financial Review Author: Filippo Sciacca, Director - Investor Relations, Asset Management and Compliance Funds operated by this manager: ASCF High Yield Fund, ASCF Premium Capital Fund, ASCF Select Income Fund |

26 Feb 2024 - New Funds on Fundmonitors.com
|
New Funds on FundMonitors.com |
|
Below are some of the funds we've recently added to our database. Follow the links to view each fund's profile, where you'll have access to their offer documents, monthly reports, historical returns, performance analytics, rankings, research, platform availability, and news & insights. |
 |
|||||||||||||||||||||
| Aura Core Income Fund | |||||||||||||||||||||
|
|||||||||||||||||||||
| View Profile | |||||||||||||||||||||
|
|
|||||||||||||||||||||
| JPMorgan Equity Premium Income Active ETF (Managed Fund) | |||||||||||||||||||||
|
|||||||||||||||||||||
| View Profile | |||||||||||||||||||||
| JPMorgan Equity Premium Income Active ETF (Managed Fund) (Hedged) | |||||||||||||||||||||
|
|||||||||||||||||||||
| JPMorgan US 100Q Equity Premium Income Active ETF (Managed Fund) | |||||||||||||||||||||
|
|||||||||||||||||||||
| JPMorgan US 100Q Equity Premium Income Active ETF (Managed Fund) (Hedged) | |||||||||||||||||||||
|
|||||||||||||||||||||
| View Profile | |||||||||||||||||||||
|
Want to see more funds? |
|||||||||||||||||||||
|
Subscribe for full access to these funds and over 800 others |

