NEWS

17 Jan 2022 - Managers Insights | Collins St Asset Management
|
|
||
|
Chris Gosselin, CEO of FundMonitors.com, speaks with Rob Hay, Head of Distribution & Investor Relations at Collins St Asset Management. The Collins St Value Fund has a track record of 5 years and 11 months and has consistently outperformed the ASX 200 Total Return Index since inception in February 2016. The Fund has returned 18.65% versus the Index's annualised return over the same period of 11.3%.
|

17 Jan 2022 - Four ways to massively improve performance in 2022
|
Four ways to massively improve performance in 2022 Wealthlander Active Investment Specialist 07 January 2022
We observe many investors with poor performance despite strong markets in the last few years. Here are some ideas to help you address this in 2022. 1. Acknowledge the reality of your performance to date Acknowledging the reality of this means accepting you're not using the best investment approach out there and there are better investment options than you struggling to be your own portfolio manager - or relying on those who don't deliver and untrustworthy people or institutions that often charge fees for delivering ordinary returns. It means recognising that genuine expertise is worth finding and paying for and that it can add much more value and manage risk better than you have been doing. 2. Get rid of your under-performing broker or adviser There is a big advantage to being invested in a fund where the fund is the only source of revenue for the firm. Firstly, the performance is clear, known, real and routinely calculated and produced by a third party, and secondly, the firm should only be remunerated by you the client and not have its main source of business being something that is using your money for some other benefit. Ideally there is a clear alignment with the firm's principals invested in the fund themselves and paid mainly on performance, and not for asset gathering through having large amounts of assets or large base management fees. That way, you actually have a much better chance of performing and can easily track your performance. Some advisers are competent but many are not, and many trap their clients into convenient but perennially under-performing investment approaches. Few are out there looking how to do a better job for their clients by having them invested with the best boutique investment managers globally. Some invest their wholesale clients in the same assets as their retail clients for their own ease of business, when they should be invested differently to take advantage of all the benefits that wholesale investors have. 3. Think outside the square 4. Acknowledge the investment cycle This means single digit returns from here are much more likely than double digit returns (at best). And that risk management is now much more important to reduce the increased risk of large losses if valuations revert to longer term averages or inflationary pressures persist forcing a tightening in central bank policies. Hence, it makes more sense to move to investment approaches with good prospective returns, better inflation protection, and much better protection from large losses than simply being long only and loaded with equity and property risk. In fact, locking in high returns by reducing equity and property investments in favour of alternative strategies means that the abnormal gains of the last few years become permanent capital gains, protecting your wealth against the risk of large losses from market falls. In summary Step 1: Measure your performance across your entire portfolio in 2021 and be honest with yourself. If you are in a position where some of your investments have delivered little then avoid hope as a strategy or being frozen or convinced into doing nothing. Cutting your losers is a good strategy. Step 2: Assess the value that has been added by your current broker or adviser relationships and stop using under-performers as these relationships are meant to add value to your bottom line, otherwise you are paying them for nothing or for treating you as a fool. Many of us are mistakenly loyal to long held relationships with sweet talkers that simply aren't in our interests. Step 3: Investigate alternative investment offers as there are many out there that are available to wholesale investors which better align with common investor objectives than traditional investment approaches. Step 4: Consider the investment cycle and ask yourself is this an environment where you think you can realistically continue using the same approach to achieve your desired returns. If not then consider alternative approaches better suited to today's investment prospects and risks. There are many simple things you can do to protect your hard-earned capital and still make money, even in a more adverse investment environment. Acknowledging the realities above is a crucial step in getting there.
Author Dr Jerome Lander, Founder and CIO Funds operated by this manager: |


14 Jan 2022 - Hedge Clippings |14 January 2022
|
|||||
|
If you'd like to receive Hedge Clippings direct to your inbox each Friday
|

14 Jan 2022 - Performance Report: Cyan C3G Fund
| Report Date | |
| Manager | |
| Fund Name | |
| Strategy | |
| Latest Return Date | |
| Latest Return | |
| Latest 6 Months | |
| Latest 12 Months | |
| Latest 24 Months (pa) | |
| Annualised Since Inception | |
| Inception Date | |
| FUM (millions) | |
| Fund Overview | Cyan C3G Fund is based on the investment philosophy which can be defined as a comprehensive, clear and considered process focused on delivering growth. These are identified through stringent filter criteria and a rigorous research process. The Manager uses a proprietary stock filter in order to eliminate a large proportion of investments due to both internal characteristics (such as gearing levels or cash flow) and external characteristics (such as exposure to commodity prices or customer concentration). Typically, the Fund looks for businesses that are one or more of: a) under researched, b) fundamentally undervalued, c) have a catalyst for re-rating. The Manager seeks to achieve this investment outcome by actively managing a portfolio of Australian listed securities. When the opportunity to invest in suitable securities cannot be found, the manager may reduce the level of equities exposure and accumulate a defensive cash position. Whilst it is the company's intention, there is no guarantee that any distributions or returns will be declared, or that if declared, the amount of any returns will remain constant or increase over time. The Fund does not invest in derivatives and does not use debt to leverage the Fund's performance. However, companies in which the Fund invests may be leveraged. |
| Manager Comments | The Cyan C3G Fund has a track record of 7 years and 5 months and has outperformed the ASX Small Ordinaries Total Return Index since inception in August 2014, providing investors with a return of 15.44%, compared with the index's return of 9.56% over the same time period. On a calendar basis the fund has had 1 negative annual return in the 7 years and 5 months since its inception. Its largest drawdown was -36.45% lasting 16 months, occurring between October 2019 and February 2021 when the index fell by a maximum of -29.12%. The Manager has delivered these returns with -0.18% less volatility than the index, contributing to a Sharpe ratio which has fallen below 1 five times and currently sits at 0.9 since inception. The fund has provided positive monthly returns 85% of the time in rising markets, and 41% of the time when the market was negative, contributing to an up capture ratio since inception of 67% and a down capture ratio of 50%. |
| More Information |

14 Jan 2022 - Performance Report: Paragon Australian Long Short Fund
| Report Date | |
| Manager | |
| Fund Name | |
| Strategy | |
| Latest Return Date | |
| Latest Return | |
| Latest 6 Months | |
| Latest 12 Months | |
| Latest 24 Months (pa) | |
| Annualised Since Inception | |
| Inception Date | |
| FUM (millions) | |
| Fund Overview | Paragon's unique investment style, comprising thematic led idea generation followed with an in depth research effort, results in a concentrated portfolio of high conviction stocks. Conviction in bottom up analysis drives the investment case and ultimate position sizing: * Both quantitative analysis - probability weighted high/low/base case valuations - and qualitative analysis - company meetings, assessing management, the business model, balance sheet strength and likely direction of returns - collectively form Paragon's overall view for each investment case. * Paragon will then allocate weighting to each investment opportunity based on a risk/reward profile, capped to defined investment parameters by market cap, which are continually monitored as part of Paragon's overall risk management framework. The objective of the Paragon Fund is to produce absolute returns in excess of 10% p.a. over a 3-5 year time horizon with a low correlation to the Australian equities market. |
| Manager Comments | The Paragon Australian Long Short Fund has a track record of 8 years and 11 months and has outperformed the ASX 200 Total Return Index since inception in March 2013, providing investors with a return of 15.19%, compared with the index's return of 8.74% over the same time period. On a calendar basis the fund has had 1 negative annual return in the 8 years and 11 months since its inception. Its largest drawdown was -45.11% lasting 2 years and 7 months, occurring between January 2018 and August 2020 when the index fell by a maximum of -26.75%. The Manager has delivered higher returns but with higher volatility than the index, resulting in a Sharpe ratio which has fallen below 1 five times and currently sits at 0.65 since inception. The fund has provided positive monthly returns 69% of the time in rising markets, and 47% of the time when the market was negative, contributing to an up capture ratio since inception of 110% and a down capture ratio of 76%. |
| More Information |

14 Jan 2022 - Fixed-income Alternative - Life Settlements (part 2)
|
What are the Benefits of Life Settlements for Society? Laureola Advisors January 2022 Alignment with ESG principles is becoming imperative in investment management. A majority of Australians expect their super or other investments to be invested responsibly and ethically. In addition to the expectation of returns not being compromised, investors also expect these investments to have a real environmental, societal or governance impact, not just "ethics washing." Due to slow-changing legacies, popular investments such as equity and bonds, funds usually start their ESG journey through implementing negative screening to exclude investments whose activities are considered harmful. However, it is still difficult to directly link the remaining assets to having actual positive ESG impact. These assets might just be less harmful. Positive ESG impact assets are not immediately obvious because most investors are not used to the idea that assets that service a societal need can be profitable. The opportunity in life settlements shows how helping others can be profitable too. How can an investment in life settlements, where returns are made when the insured dies, be a social good? The positive impact that can arise from an investment in life settlements is improved physical and financial wellbeing of senior citizens in the US (where the most active life settlements transactions market operates). An investment in a life settlements fund can help vulnerable retirees and tackle three ESG-related issues in the US: There is a shortfall of retirement savings in the US The National Institute of Retirement Security estimates that approximately 44% of people born between 1944 and 1979 are at risk of having insufficient income to meet basic day-to-day expenses in retirement. Due to the savings shortfall, seniors cannot access long-term care The average middle-class senior citizen does not have sufficient savings to cover the cost of long-term care. When accounting for long-term care costs, 69% of households are at risk of being unable to maintain their standard of living in retirement. Instead of helping to ease this shortfall, life insurance policies add to the burden with regular ongoing demands for insurance premiums while the senior is alive. Every year since 2009, over 33 million life insurance policies terminate prematurely which means the policyholder does not realise a benefit from the policy despite paying premiums for decades. The American Council of Life Insurer reported over 90% of life policies terminate without paying a death benefit in 2018. Life settlements provide a solution to these issues by providing a cash payout to the seniors and by shifting the burden of the insurance premium to life settlements investors. By investing in this asset class there is potential for:
Researchers from London Business School estimated in 2013 that the value unlocked by the life settlement market is on average about four times greater than that of the surrender value offered by insurance companies. While life settlements might not look like a candidate as a force for ESG- aligned investing, its fundamental raison d'etre is to address a societal need for better retirement provision. In return for such social good, life settlement investors can obtain stable, uncorrelated returns which has historically been in the teens. Written by Tony Bremness, Managing Director & Chief Investment Officer This is a follow-up article to yesterday's release 'What is a Life Settlements Investment?". Funds operated by this manager: |

14 Jan 2022 - Omicron: The facts that matter
|
Omicron: The facts that matter Antipodes Partners Limited 14 December 2021 Just as the global economy started hitting its reopening stride, Omicron has seen uncertainty return. First identified in Botswana, Omicron spread to South Africa where the alarm was raised on the 24th November. Since then, the variant has been confirmed in almost 40 other countries. With around 60% of the global population fully vaccinated - the question is, how big a threat is this? There are many unknowns when it comes to this new variant. These, along with the key facts we do know, plus the important signposts investor should track are discussed with Antipodes' healthcare portfolio manager, Dr Nick Cameron, in the latest episode of the Good Value podcast. Here are some of the key takeaways. Transmissibility and severityThe Omicron variant has around 30 mutations in the spike protein - many more mutations or changes in the virus than we have seen in previous variants (of which many are new/novel). The spike protein is the key protein responsible for - and necessary for - the virus to enter or infect cells and cause symptoms. Omicron has quickly become the dominant strain in the Gauteng province in South Africa. The infection growth rate profile appears higher than prior waves but importantly hospital admissions data looks more consistent. Given borders between South Africa and many other countries were open to travellers for some time prior to the knowledge of the variant, it's no surprise Omicron has spread around the world. Omicron appears highly transmissible but even if it's more transmissible, this doesn't necessarily mean its virulence (capacity to cause more severe disease) is also increased. Early signs suggest disease severity may not be any worse than Delta. For example, most hospitalised patients in South Africa had mild symptoms and few required high-level care. While there are a number of mutations in the critical areas of the spike protein, there are many parts of the Omicron spike that remain unchanged. The immune system, including both T cells and neutralising antibodies in vaccinated people and in those that have recovered from prior infection (and have "natural immunity") should "remember" the unchanged parts of the virus, and provide some protection against severe disease and death. Based on this, countries with high vaccination rates and high rates of community infection in prior waves will likely be the best protected. Vaccine effectivenessGiven Omicron has so many mutations it is no surprise to see a marked reduction in the efficacy of current vaccines. The most recent lab data shows the current two-dose regime of existing vaccines aren't as efficacious against the Omicron variant, but it's still too early to say how this lab data translates into real world protection against severe illness and deaths. Boosting with current vaccines appears to lift protection, but this is likely to be short-lived. It increasingly appears an Omicron specific booster will be required, particularly for the more vulnerable populations like the elderly and those with higher-risk profiles for severe disease. mRNA vaccine makers Pfizer and Moderna have already started developing new boosters which are specific to the Omicron variant - Pfizer's candidate could be available in March 2022. More will be known on vaccine effectiveness in the coming weeks as more lab data results become available. The key metric for investorsFor investors, monitoring hospitalisations over the coming weeks will be key in assessing the extent of the risk posed by Omicron and the risk of further lockdowns. So far, early indications suggest hospitalisation rates for Omicron appear low and vaccinations rates also appear to be lifting following the Omicron news. If vaccinated people, and particularly those that have also recovered from prior infection, are shown to only develop mild flu or cold like symptoms, this would be a positive sign in the fight against COVID-19. And positive in terms of the reopening continuing. But it will take some time to collect enough data to confidently determine whether the Omicron variant is a threat to overloading health systems. Two attractively priced healthcare opportunities amid the Omicron threatSanofi (EPA: SAN) Sanofi is more than just a drug developer. A material portion of its earnings (~35%) comes from its vaccines and consumer health businesses both of which are more defensive, long-duration businesses compared to traditional drug development. Sanofi is a leading manufacturer of vaccines, globally - it's one of only three scale flu vaccine manufacturers, and has a broad portfolio including polio and meningitis as examples, and a full pipeline of vaccines under development including two COVID-19 candidates. Vaccines are attractive businesses. They require large scale manufacturing, are highly regulated and have high barriers to entry. Sanofi's consumer health business is also one of the largest globally. Sanofi has a collection of well-known, over-the-counter medications and supplements and these businesses are very stable, generate high free cash flow and operate in markets which have more room to consolidate. When separately listed they can demand multiples of around 25x. Finally, its drug business is one of the least exposed to patent cliffs over the next decade, has limited US drug pricing relative to peers, and a solid balance sheet with ample firepower to transform its pipeline. The company's earnings are growing faster than peers, around the mid-teens level, and Sanofi is valued at just 11x earnings. Walgreens (NASDAQ: WBA) Walgreens has around 9,000 pharmacies in the US. In fact, ~80% of the American population lives within 5 miles of a Walgreens so the scale of their physical presence is a key competitive advantage. But what really excites us is that Walgreens is leveraging its extensive retail footprint to provide healthcare services. Walgreens is transforming its physical locations into health hubs which will provide a range of healthcare services such as primary care, chronic disease management, vaccinations and specialty pharmacy services. All while the traditional prescription and retail offering continues. Not only is Walgreens becoming a one-stop shop for healthcare needs, the margin profile of health services is much higher than the pharmacy business alone. Over time this could become a material driver of earnings growth and margin upside if the company is able to execute on its plans. Once the healthcare services offerings are fully ramped up, the company's long-term earnings growth profile could reach 12-13% p.a. including buybacks, and it's valued at just 10x earnings. The market is not pricing any value for the potential in health services and we see this a great pragmatic value opportunity. Alison Savas, Client Portfolio Manager |
|
Funds operated by this manager: Antipodes Asia Fund, Antipodes Global Fund, Antipodes Global Fund - Long Only (Class I) |
13 Jan 2022 - Performance Report: Collins St Value Fund
| Report Date | |
| Manager | |
| Fund Name | |
| Strategy | |
| Latest Return Date | |
| Latest Return | |
| Latest 6 Months | |
| Latest 12 Months | |
| Latest 24 Months (pa) | |
| Annualised Since Inception | |
| Inception Date | |
| FUM (millions) | |
| Fund Overview | The managers of the fund intend to maintain a concentrated portfolio of investments in ASX listed companies that they have investigated and consider to be undervalued. They will assess the attractiveness of potential investments using a number of common industry based measures, a proprietary in-house model and by speaking with management, industry experts and competitors. Once the managers form a view that an investment offers sufficient upside potential relative to the downside risk, the fund will seek to make an investment. If no appropriate investment can be identified the managers are prepared to hold cash and wait for the right opportunities to present themselves. |
| Manager Comments | The Collins St Value Fund has a track record of 5 years and 11 months and has consistently outperformed the ASX 200 Total Return Index since inception in February 2016, providing investors with a return of 18.65%, compared with the index's return of 11.3% over the same time period. On a calendar basis the fund has never had a negative annual return in the 5 years and 11 months since its inception. Its largest drawdown was -27.46% lasting 7 months, occurring between February 2020 and September 2020. The Manager has delivered higher returns but with higher volatility than the index, resulting in a Sharpe ratio which has fallen below 1 twice and currently sits at 1 since inception. The fund has provided positive monthly returns 83% of the time in rising markets, and 65% of the time when the market was negative, contributing to an up capture ratio since inception of 84% and a down capture ratio of 33%. |
| More Information |
13 Jan 2022 - Performance Report: AIM Global High Conviction Fund
| Report Date | |
| Manager | |
| Fund Name | |
| Strategy | |
| Latest Return Date | |
| Latest Return | |
| Latest 6 Months | |
| Latest 12 Months | |
| Latest 24 Months (pa) | |
| Annualised Since Inception | |
| Inception Date | |
| FUM (millions) | |
| Fund Overview | AIM are 'business-first' rather than 'security-first' investors, and see themselves as part owners of the businesses they invest in. AIM look for the following characteristics in the businesses they want to own: - Strong competitive advantages that enable consistently high returns on capital throughout an economic cycle, combined with the ability to reinvest surplus capital at high marginal returns. - A proven ability to generate and grow cash flows, rather than accounting based earnings. - A strong balance sheet and sensible capital structure to reduce the risk of failure when the economic cycle ends or an unexpected crisis occurs. - Honest and shareholder-aligned management teams that understand the principles behind value creation and have a proven track record of capital allocation. They look to buy businesses that meet these criteria at attractive valuations, and then intend to hold them for long periods of time. AIM intend to own between 15 and 25 businesses at any given point. They do not seek to generate returns by constantly having to trade in and out of businesses. Instead, they believe the Fund's long-term return will approximate the underlying economics of the businesses they own. They are bottom-up, fundamental investors. They are cognizant of macro-economic conditions and geo-political risks, however, they do not construct the Fund to take advantage of such events. AIM intend for the portfolio to be between 90% and 100% invested in equities. AIM do not engage in shorting, nor do they use leverage to enhance returns. The Fund's investable universe is global, and AIM look for businesses that have a market capitalisation of at least $7.5bn to guarantee sufficient liquidity to investors. |
| Manager Comments | The AIM Global High Conviction Fund has a track record of 2 years and 5 months and therefore comparison over all market conditions and against the fund's peers is limited. However, since inception in July 2019, the fund has outperformed the Global Equity Index, providing investors with an annualised return of 20.17%, compared with the index's return of 16.05% over the same time period. On a calendar basis the fund has never had a negative annual return in the 2 years and 5 months since its inception. Its largest drawdown was -7.59% lasting 6 months, occurring between February 2020 and August 2020. The Manager has delivered higher returns but with higher volatility than the index, resulting in a Sharpe ratio which has never fallen below 1 and currently sits at 1.77 since inception. The fund has provided positive monthly returns 90% of the time in rising markets, and 0% of the time when the market was negative, contributing to an up capture ratio since inception of 112% and a down capture ratio of 83%. |
| More Information |

13 Jan 2022 - 10k Words - December Edition
|
10k Words - December Edition Equitable Investors December 2021 FundMonitors closed for the end-of-year break before we could release this edition of the regular missive from Equitable Investors. Read and enjoy - the next issue will follow soon!
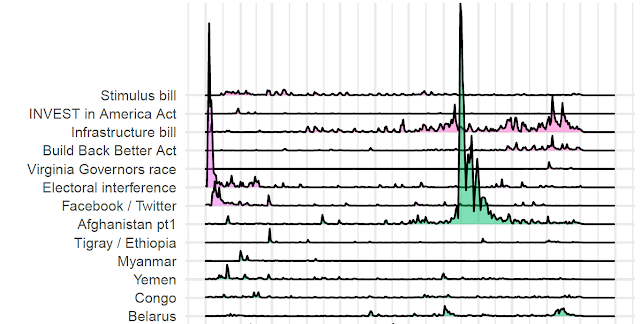
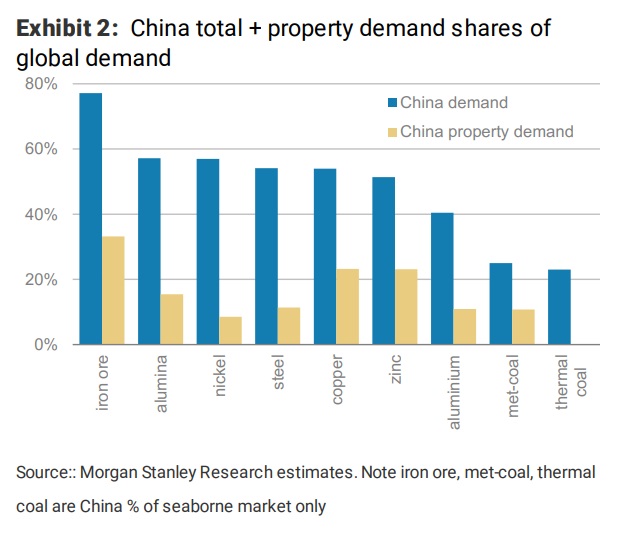
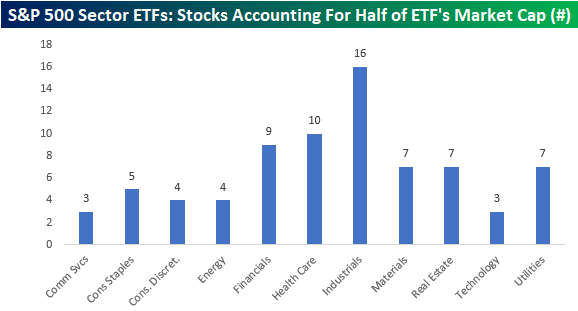
Our final 10k Words for CY2021 kicks off with The Economist's first cut on what events captured audience attention in the media during the year. We then range across Morgan Stanley's chart on China property sector's importance to commodities, the surge in VC investment in cryptocurrency startups illustrated by The Economist and Bloomberg's ranking of countries through time based on their COVID-19 vaccine penetration. We get into equities with Bespoke showing ETFs don't necessarily fulfill the diversification function that is expected of them and finally Equitable Investors' analysis of what has worked and what hasn't worked in CY2021 for ASX-listed micro-to-mid caps. Impact of 2021 global events as measured by media activity (an initial draft analysis) Source: The Economist China property sector's contribution to commodity demand Source: Morgan Stanley VC funds piling into cyrptocurrency startups Source: The Economist
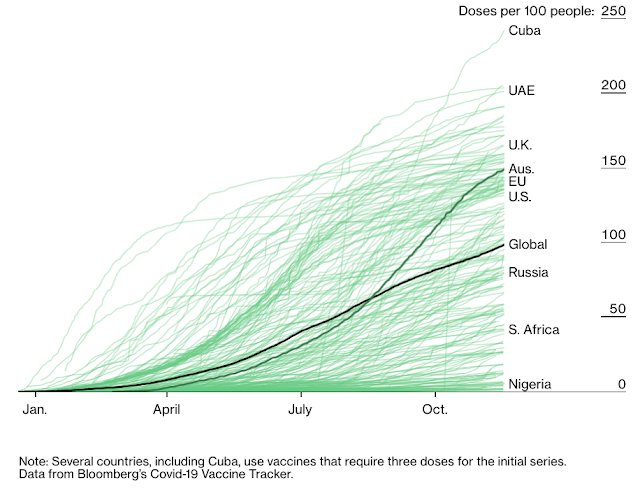
COVID-19 vaccine doses per 100 people Source: Bloomberg
Sector ETFs not so diversified Source: Bespoke
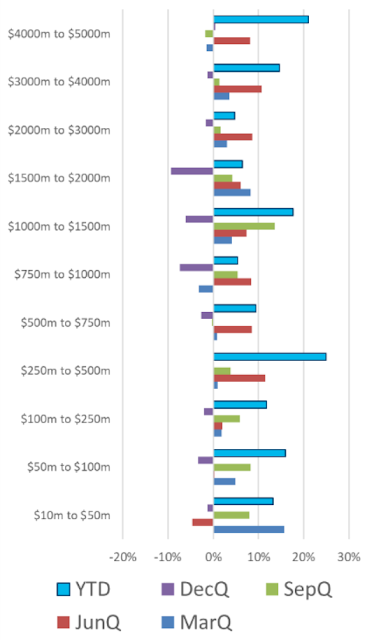
Quarterly average returns & CY2020 YTD return for ASX micro-to-mid caps by size (market cap) Source: Equitable Investors, Sentieo
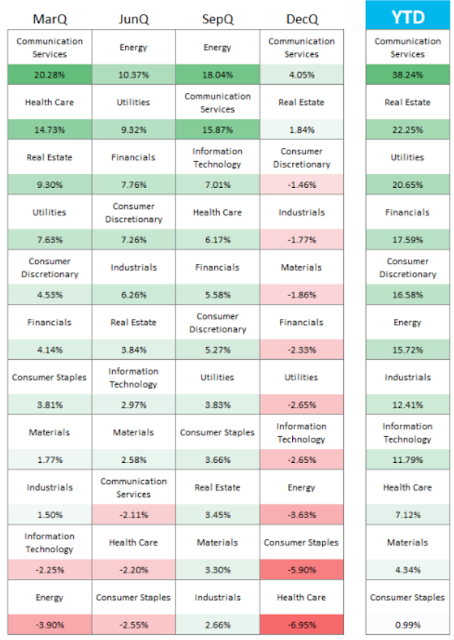
Quarterly average returns & CY2020 YTD return for ASX micro-to-mid caps by sector Source: Equitable Investors, Sentieo
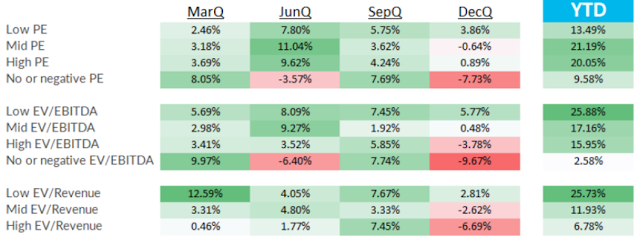
Quarterly average returns & CY2020 YTD return for ASX micro-to-mid caps by valuation band Source: Equitable Investors, Sentieo Disclaimer Nothing in this blog constitutes investment advice - or advice in any other field. Neither the information, commentary or any opinion contained in this blog constitutes a solicitation or offer by Equitable Investors Pty Ltd (Equitable Investors) or its affiliates to buy or sell any securities or other financial instruments. Nor shall any such security be offered or sold to any person in any jurisdiction in which such offer, solicitation, purchase, or sale would be unlawful under the securities laws of such jurisdiction. The content of this blog should not be relied upon in making investment decisions.Any decisions based on information contained on this blog are the sole responsibility of the visitor. In exchange for using this blog, the visitor agree to indemnify Equitable Investors and hold Equitable Investors, its officers, directors, employees, affiliates, agents, licensors and suppliers harmless against any and all claims, losses, liability, costs and expenses (including but not limited to legal fees) arising from your use of this blog, from your violation of these Terms or from any decisions that the visitor makes based on such information. This blog is for information purposes only and is not intended to be relied upon as a forecast, research or investment advice. The information on this blog does not constitute a recommendation, offer or solicitation to buy or sell any securities or to adopt any investment strategy. Although this material is based upon information that Equitable Investors considers reliable and endeavours to keep current, Equitable Investors does not assure that this material is accurate, current or complete, and it should not be relied upon as such. Any opinions expressed on this blog may change as subsequent conditions vary. Equitable Investors does not warrant, either expressly or implied, the accuracy or completeness of the information, text, graphics, links or other items contained on this blog and does not warrant that the functions contained in this blog will be uninterrupted or error-free, that defects will be corrected, or that the blog will be free of viruses or other harmful components.Equitable Investors expressly disclaims all liability for errors and omissions in the materials on this blog and for the use or interpretation by others of information contained on the blog Funds operated by this manager: |