NEWS

31 Jan 2022 - Running a life settlements fund
|
Running a life settlements fund Laureola Advisors January 2022 Like any fund manager a life settlements fund has a team of specialists and an asset to analyse and purchase to maximise return. It must be understood that the market is tiny where only 3,200 life insurance policies came onto the market last year in the USA. Given the surrender rate of several hundred thousand each year, it is a small number. A lot of people don't often know what a valuable asset they have paid for over many years and simply let them close down. People buy insurance to protect a family or a mortgage debt in the event of untimely death but once the family has grown up and left home and the house paid for, the need for insurance has gone. Typically the insured will contact the insurance company and just accept the contractual surrender value. Some will instead speak to their agent and learn that there is a chance of a far greater cash sum by selling the policy to an investor. In this instance the agent will contact a Licensed Broker whose job it is to represent the seller. He will prepare a file which will include all the policy details and arrange for the insured to have a medical examination the results of which will be provided to one (or more) of the actuarial firms that provide a Life Expectancy (LE) for the individual where the LE is a number usually given in months. It is worth making the point that the LE is not the month in which the insured is expected to die but rather the midpoint on a probability distribution curve where of 1,000 people of the same age and gender and with the same health issues, 500 are expected to die before the LE and 500 after. The file is then sent to Licensed Providers in the U.S. who are the only people legally able to buy an insurance policy from an insured and who represent the investors who are typically managers; an auction process follows. The managers have a great deal of certainty around many of the metrics of the asset; the death benefit is known; the premium costs are known and the credit risk is immaterial; the only thing that is not known is the maturity date. Managers do have the LE which has been provided by the actuarial firms that service the life settlement market and can have access to the medical records but most simply rely upon the LE. It then remains for the manager to choose what discount rate to apply to the cashflows (given the assumed LE) and to make a bid for the policy on that basis. The market usually trades policies where the purchase price assumes a projected internal rate of return (IRR) of between 12% and 14% (though there is wide dispersion around this range) and on this basis the purchase price offered is usually around four times more than the contractual surrender value offered by the insurance company. Most middle-class Americans do not have sufficient assets to fund a comfortable retirement, let alone pay for all the medical and care costs that might be anticipated. Selling their life insurance contract, rather than surrendering it to the insurance company, in many cases makes a very significant difference to the quality of their lives going forward. If the LEs were right and were in fact the mid-point of the mortality curve then the manager could rely upon the law of large numbers, buy lots of policies and expect gross IRRs across the portfolio to be 12% to 14%. The asset is very expensive to track and fund costs are correspondingly high so management fees and fund costs will reduce this gross return by 4% or 5% leaving a net-to-investor return in this situation of 7% to 10%. Most managers and investors do rely upon the accuracy of the LE and the law of large numbers. However, if instead of 500 dying before the LE and 500 after what happens is that only 450 die before and 550 die after, then the LEs from which the policies were purchased and the portfolio was valued are wrong and where the gross projected IRR was 12% to 14%, the gross actual IRR turns out to be 8% to 10%, with a corresponding net-toinvestor return of 3% to 6%. It is obvious that you can test the accuracy of LEs historically, but how can you be sure if forward-looking LEs are accurate? Consider this: With a probability distribution curve over a large population, for any given LE it is possible to predict how many deaths the portfolio would experience each year with a high level of statistical confidence. So, even though the LE has not yet been reached, deaths should already be occurring and the number can be compared with those expected. If the actual number of deaths is (statistically significantly) less than expected, the LE is too short and should be pushed out to fit the early years' experience. History has shown that the LEs provided by the actuarial firms have been and continue to be too short and consequently investor expectations have not been met. If a manager is able to construct a portfolio where half the insureds die before the LE and half afterwards then the gross projected IRRs are preserved and this is the focus of the Laureola investment approach. The six actuarial firms that provide LEs to the market have strengths and weakness across different illnesses and clusters of illnesses. This fact is known qualitatively by all the participants in the life settlement market, including the Licensed Brokers who first bring the policy to the market. It should be no surprise that the Brokers choose the shortest LE available because this pushes the price (and their commission) up. Laureola's four-person investment team spent two years analysing the strengths and weaknesses of the LE providers and has a much better understanding quantitively of how short or long they are with respect to various health conditions. Additionally, Laureola has a medical and scientific advisory panel which reviews the LE in the light of current research. Areas of expertise of the panel include heart disease, circulatory disease and cancer - illnesses which account for the death of two thirds of American citizens. For example the heart specialist (who is working on the leading edge of new treatments for heart disease and has several patents for medical devices) might advise the investment team that there are treatments being developed which might prolong the life of a particular insured with heart or circulatory problems beyond current estimates, in other words that he/she is more likely on average to live beyond the given LE than die before; this would be a reason not to buy this policy. Or in the case of a cancer patient, the Chief Scientific Officer might advise the investment team that a particular insured with a particular from of cancer with particular features and at a particular stage is more likely on average to die before the given LE which would be a reason to consider buying the policy. It is not enough just to buy cheap policies (as measured by the discount rate) because the real value is extracted from this asset class by choosing policies which mature before the LE; all the value of a cheap policy is lost if the insured lives too long past his/her LE. The added value of the Laureola investment team is its focus on the mortality of every single policy in the portfolio. Once a policy has been purchased and is held within the portfolio, it needs to be understood that the health of the insured might worsen or improve over time, affecting its value within the portfolio. Changes in the health of the insureds is critical information for an investment team focussed on the mortality of every policy. Most managers outsource what is loosely referred to as "tracking" to third parties where the information sought is when there has been a death. Laureola carries out the tracking function internally with a team dedicated to forming relationships with the insureds. In the case where the health of an insured has improved, for example by surviving cancer, the team will quickly learn about it and although the improvement in health and life expectancy is to be celebrated, the mortality of the policy has worsened from Laureola's standpoint and the policy has become an underperforming asset. In these circumstances, the investment team is likely to consider selling the policy to another manager. Policies are valued very conservatively within the portfolio and Laureola's experience is that in those circumstances where they have sold policies they have done so at a price higher than the prices marked on the book, thus making cash profits on the sale. Laureola Advisors is an established boutique manager in the life settlement space with a 9-year track record (and only 2 negative months). Over 80% of Laureola's published returns are realised gains, i.e. profits from death benefits or policy sales. Returns which are derived from mortality secure the non-correlation sought by many investors. It takes a 12-person team to run Laureola's life settlements operation because the qualitative input requires time and expertise alongside the quantitative analysis to maximise returns. Written By John Swallow, Director of Investor Relations Funds operated by this manager: |

28 Jan 2022 - Hedge Clippings |28 January 2022
|
|||||
|
If you'd like to receive Hedge Clippings direct to your inbox each Friday
|

28 Jan 2022 - Performance Report: Frazis Fund
| Report Date | |
| Manager | |
| Fund Name | |
| Strategy | |
| Latest Return Date | |
| Latest Return | |
| Latest 6 Months | |
| Latest 12 Months | |
| Latest 24 Months (pa) | |
| Annualised Since Inception | |
| Inception Date | |
| FUM (millions) | |
| Fund Overview | The manager follows a disciplined, process-driven, and thematic strategy focused on five core investment strategies: 1) Growth stocks that are really value stocks; 2) Traditional deep value; 3) The life sciences; 4) Miners and drillers expanding production into supply deficits; 5) Global special situations; The manager uses a macro overlay to manage exposure, hedging in three ways: 1) Direct shorts 2) Upside exposure to the VIX index 3) Index optionality |
| Manager Comments | On a calendar basis the fund has had 1 negative annual return in the 3 years and 6 months since its inception. Its largest drawdown was -32.28% lasting 4 months, occurring between February 2020 and June 2020 when the index fell by a maximum of -13.19%. The Manager has delivered higher returns but with higher volatility than the index, resulting in a Sharpe ratio which has fallen below 1 twice and currently sits at 0.72 since inception. The fund has provided positive monthly returns 75% of the time in rising markets, and 36% of the time when the market was negative, contributing to an up capture ratio since inception of 146% and a down capture ratio of 104%. |
| More Information |

28 Jan 2022 - Performance Report: ASCF High Yield Fund
| Report Date | |
| Manager | |
| Fund Name | |
| Strategy | |
| Latest Return Date | |
| Latest Return | |
| Latest 6 Months | |
| Latest 12 Months | |
| Latest 24 Months (pa) | |
| Annualised Since Inception | |
| Inception Date | |
| FUM (millions) | |
| Fund Overview | Does not require full valuations on loans <65% LVR. Borrowing rates are from 12% per annum on 1st mortgage loans and 16% per annum on 2nd mortgage/caveat loans. Pays investors between 5.55% - 6.25% per annum depending on their investment term. |
| Manager Comments | The ASCF High Yield Fund has a track record of 4 years and 10 months and therefore comparison over all market conditions and against the fund's peers is limited. However, since inception in March 2017, the fund has outperformed the Bloomberg AusBond Composite 0+ Yr Index, providing investors with an annualised return of 8.8%, compared with the index's return of 3.31% over the same time period. The fund has not had a negative annual return or drawdown in the 4 years and 10 months since its inception. The Manager has delivered these returns with -3.35% less volatility than the index, contributing to a Sharpe ratio which has never fallen below 1 and currently sits at 24.15 since inception. The fund has provided positive monthly returns 100% of the time in rising markets, and 100% of the time when the market was negative, contributing to an up capture ratio since inception of 87% and a down capture ratio of -96%. |
| More Information |

28 Jan 2022 - Performance Report: L1 Capital Long Short Fund
| Report Date | |
| Manager | |
| Fund Name | |
| Strategy | |
| Latest Return Date | |
| Latest Return | |
| Latest 6 Months | |
| Latest 12 Months | |
| Latest 24 Months (pa) | |
| Annualised Since Inception | |
| Inception Date | |
| FUM (millions) | |
| Fund Overview | L1 Capital uses a combination of discretionary and quantitative methods to identify securities with the potential to provide attractive risk-adjusted returns. The discretionary element of the investment process entails regular meetings with company management and other stakeholders as well as frequent reading and analysis of annual reports and other relevant publications and communications. The quantitative element of the investment process makes use of bottom-up research to maintain financial models such as the Discounted Cashflow model (DCF) which is used as a means of assessing the intrinsic value of a given security. Stocks with the best combination of qualitative factors and valuation upside are used as the basis for portfolio construction. The process is iterative and as business trends, industry structure, management quality or valuation changes, stock weights are adjusted accordingly. |
| Manager Comments | The L1 Capital Long Short Fund has a track record of 7 years and 4 months and has consistently outperformed the ASX 200 Total Return Index since inception in September 2014, providing investors with a return of 22.62%, compared with the index's return of 8.2% over the same time period. On a calendar basis the fund has had 1 negative annual return in the 7 years and 4 months since its inception. Its largest drawdown was -39.11% lasting 2 years and 9 months, occurring between February 2018 and November 2020 when the index fell by a maximum of -26.75%. The Manager has delivered higher returns but with higher volatility than the index, resulting in a Sharpe ratio which has fallen below 1 four times and currently sits at 1.03 since inception. The fund has provided positive monthly returns 79% of the time in rising markets, and 63% of the time when the market was negative, contributing to an up capture ratio since inception of 94% and a down capture ratio of 7%. |
| More Information |

28 Jan 2022 - Fund Review: Bennelong Kardinia Absolute Return Fund December 2021
BENNELONG KARDINIA ABSOLUTE RETURN FUND
Attached is our most recently updated Fund Review. You are also able to view the Fund's Profile.
- The Fund is long biased, research driven, active equity long/short strategy investing in listed ASX companies.
- The Fund has significantly outperformed the ASX200 Accumulation Index since its inception in May 2006 and also has significantly lower risk KPIs. The Fund has an annualised return of 8.63% p.a. with a volatility of 7.57%, compared to the ASX200 Accumulation's return of 6.68% p.a. with a volatility of 14.09%.
- The Fund also has a strong focus on capital protection in negative markets. Portfolio Managers Kristiaan Rehder and Stuart Larke have significant market experience, while Bennelong Funds Management provide infrastructure, operational, compliance and distribution capabilities.
For further details on the Fund, please do not hesitate to contact us.
28 Jan 2022 - What can you make of highs & lows?
|
What can you make of highs & lows? Frazis Capital Partners January 2022 Portfolio Manager Michael Frazis gives a perspective on what could be driving sell-offs We are in the middle of one of those extraordinary periods where valuations collapse and investor time frames have shortened from years to days. Long term plans are forgotten and the whole market is focusing on where prices will land tomorrow. At periods like this extraordinary transfers of wealth take place. As with similar shocks in March 2020, Dec 2018, and 2008/2009, those liquidating shares will realize sharp short term losses, while the immense long term wealth created by fast-growing technology companies over the coming years will flow to those who hold or buy. A number of indications suggest things have reached the kinds of extremes that lead to buying opportunities. Over 40% of the Nasdaq is now down more than 50% from one-year highs, which includes many of the best companies in the world, and many of those likely to generate the highest returns over the coming years. The rolling quarterly new lows in technology is now as high as it has been since Lehman collapsed in 2008, a generational buying opportunity. The performance of technology over the following decade was phenomenal, painful though it was for everyone holding tech shares at the time. Tech bottomed several months before the rest of the market, and then pushed to significant new highs. We saw this dynamic in March 2020, when our fund sold off well before the market - and much harder too - only to recover long before the indices and push to major new highs.
Fortunately, many of these companies raised money or IPOd recently, so we can all be grateful that scientific progress will continue. There's a narrative around rates and quantitative tightening causing the sell-off. There is some truth to this, but a better explanation is that institutions, as they did in March 2020 and 2008/2009, have rushed to the exit, swinging from max overweight to max underweight technology (as measured by data above). Goldman Sachs reported the heaviest tech selling in over five years and that was earlier on in the sell-off. This institutional shift, combined with rising short selling and no doubt some level of retail panic (data on that is harder to come by) is both causing the current volatility and creating opportunity for longer term investors to take the other side. Of course, the most important thing is not to participate in mass selling, and where possible, take advantage. All the gains from the growth in life sciences, software, fintech, and e-commerce will flow to those who end up with the shares being dumped on the market now. The most important thing to know is that our companies are still performing exceptionally well. Many of them are internet-based so we can track real-time data, and they have made substantial progress since the sell-off began, and most certainly since the highs of early 2021. Strikingly, this sell-off has not been triggered by any operational issues. For example: Sea In November only two long months ago, Sea reported: So far, indicators suggest Sea's e-commerce app Shopee is doing even better in India than it was in Brazil, where it quickly became the most downloaded app and already accounts for ~8% of Sea's GMV. After their October launch, Shopee is already the third largest shopping app in India by daily active users. The main negative news was that Tencent, a major shareholder, sold a small portion of its holding below 10%. But even this has a silver lining - as it allows Sea to avoid foreign ownership restrictions in India. In September, Sea raised $6 billion of capital at $318/share (currently $167) leaving the business with $11 billion of cash and a current enterprise value of $88 billion. If you separate the two businesses, and value payments at zero, this is one of the cheapest e-commerce companies around, as well as the fastest growing and most dominant at this scale. As with many of our companies, Sea is truly an apex predator, entering new markets and rapidly taking share, forcing competitors to react. Throughout the sell-off, estimates have been consistently revised upwards:
The difference between serious losses and returning multiples of your capital depends entirely on whether you are a buyer or a seller at times like this, which always feel like an eternity when you're in them. Our fast growing companies may be both the worst place to be during the sell-off, and the best place to be after markets put in a low. This happens well before people expect, and we are starting to reach consensus bearishness reminiscent of those times, as well as a level of seller exhaustion. In previous sell-offs, reporting season marked a turn as investors refocused on the substantial progress our companies had made, often growing 10-20% over the prior three months with improving economics. There is a very good reason to be invested in these kinds of companies. The bulk of investment returns over the next five to ten years will come from these sectors, and accrue to the companies growing and taking market share - the apex predators. We will be fully invested throughout and catch them in their entirety. For the full report and more company analysis, go to Frazis Profile Page. Written By Michael Frazis Funds operated by this manager: Disclaimer The information in this note has been prepared and issued by Frazis Capital Partners Pty Ltd ABN 16 625 521 986 as a corporate authorised representative (CAR No. 1263393) of Frazis Capital Management Pty Ltd ABN 91 638 965 910 AFSL 521445. The Frazis Fund is open to wholesale investors only, as defined in the Corporations Act 2001 (Cth). The Company is not authorised to provide financial product advice to retail clients and information provided does not constitute financial product advice to retail clients. The information provided is for general information purposes only, and does not take into account the personal circumstances or needs of investors. The Company and its directors or employees or associates will use their endeavours to ensure that the information is accurate as at the time of its publication. Notwithstanding this, the Company excludes any representation or warranty as to the accuracy, reliability, or completeness of the information contained on the company website and published documents. The past results of the Company's investment strategy do not necessarily guarantee the future performance or profitability of any investment strategies devised or suggested by the Company. The Company, and its directors or employees or associates, do not guarantee the performance of any financial product or investment decision made in reliance of any material in this document. The Company does not accept any loss or liability which may be suffered by a reader of this document.
|

27 Jan 2022 - Fund Review: Bennelong Long Short Equity Fund December 2021
BENNELONG LONG SHORT EQUITY FUND
Attached is our most recently updated Fund Review on the Bennelong Long Short Equity Fund.
- The Fund is a research driven, market and sector neutral, "pairs" trading strategy investing primarily in large-caps from the ASX/S&P100 Index, with over 19-years' track record and an annualised return of 14.22%.
- The consistent returns across the investment history highlight the Fund's ability to provide positive returns in volatile and negative markets and significantly outperform the broader market. The Fund's Sharpe Ratio and Sortino Ratio are 0.84 and 1.33 respectively.
For further details on the Fund, please do not hesitate to contact us.

27 Jan 2022 - Performance Report: Bennelong Twenty20 Australian Equities Fund
| Report Date | |
| Manager | |
| Fund Name | |
| Strategy | |
| Latest Return Date | |
| Latest Return | |
| Latest 6 Months | |
| Latest 12 Months | |
| Latest 24 Months (pa) | |
| Annualised Since Inception | |
| Inception Date | |
| FUM (millions) | |
| Fund Overview | |
| Manager Comments | The Bennelong Twenty20 Australian Equities Fund has a track record of 12 years and 3 months and has consistently outperformed the ASX 200 Total Return Index since inception in November 2009, providing investors with a return of 11.72%, compared with the index's return of 8.42% over the same time period. On a calendar basis the fund has had 2 negative annual returns in the 12 years and 3 months since its inception. Its largest drawdown was -26.09% lasting 9 months, occurring between February 2020 and November 2020 when the index fell by a maximum of -26.75%. The Manager has delivered higher returns but with higher volatility than the index, resulting in a Sharpe ratio which has fallen below 1 four times and currently sits at 0.73 since inception. The fund has provided positive monthly returns 96% of the time in rising markets, and 8% of the time when the market was negative, contributing to an up capture ratio since inception of 125% and a down capture ratio of 96%. |
| More Information |

27 Jan 2022 - Lithium - Where to From Here?
|
Lithium - Where to From Here? Airlie Funds Management 17 January 2022 |
|
Following on from our report last month on Mineral Resources and in particular its lithium business, we thought our background work on the lithium industry and supply/demand fundamentals might be of interest: Over the past 12 months, the share price movements for ASX-listed lithium producers and developers have been eye-watering. Pure-play producer Pilbara Minerals (PLS) is up +280%. Nickel / lithium producer IGO is up +80%, having completely reshaped their entire business through a procession of transactions to become an integrated "battery metals" business. Iron ore / lithium / mining services company Mineral Resources (MIN - an Airlie favourite) is up +50%, despite a 27% decline in the iron ore price over the same time. Listed developers / explorers Liontown Resources (LTR), Firefinch (FFX) and Core Lithium (CXO) are up +318%, +380% and +270% respectively (!). The sceptic in me is wary of being the greater fool in the lithium sector, but pragmatically the equation is simple - even the most conservative estimates see the lithium market entering a material deficit at some point over the next 10 years as the electrification of transport takes place globally.
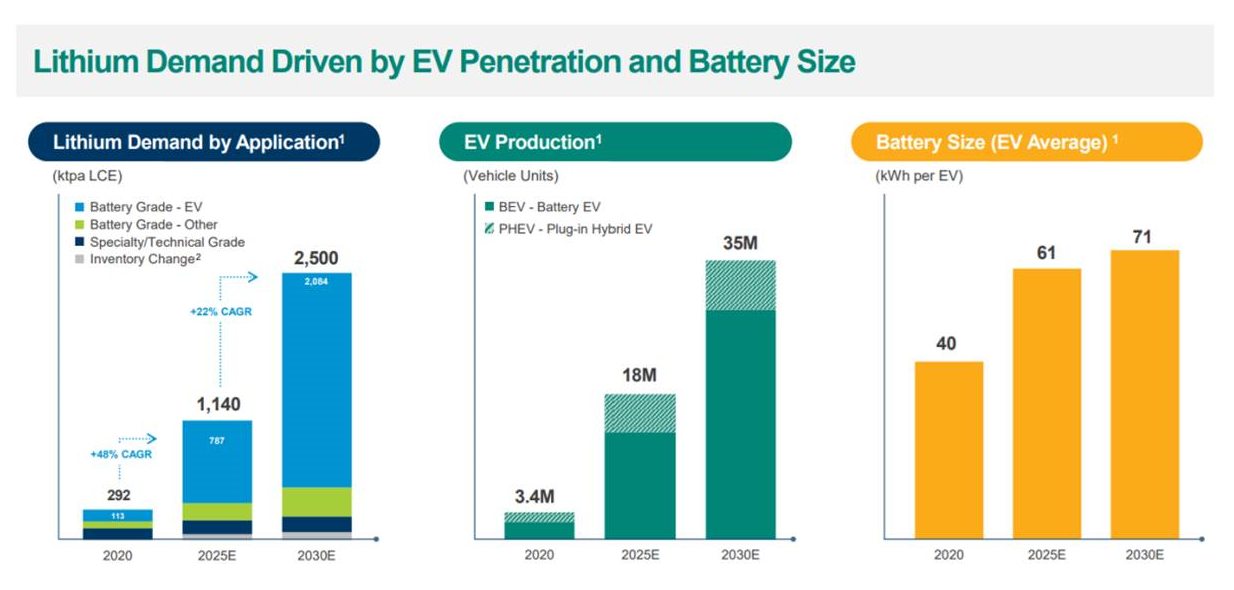
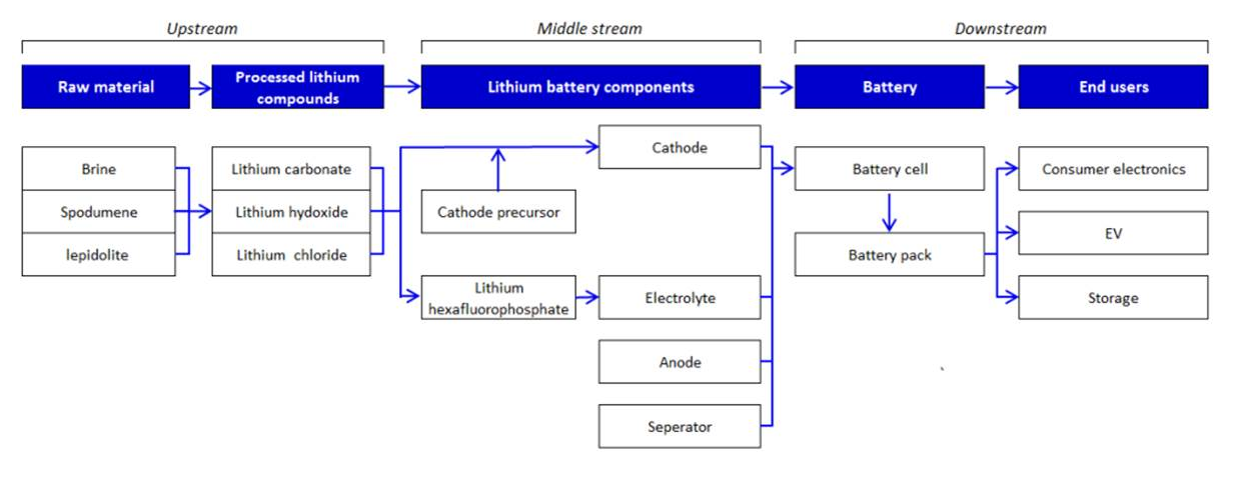
Figure 1 - Airlie Funds Management The potential for a material lithium supply deficit means prices for lithium raw materials and chemical products could continue to rise. As more lithium extraction volumes and processing capacity comes online, the cost curve for lithium will continue to evolve and potentially result in a range of economic outcomes for companies depending on their cost position and capital invested. Herein lies the opportunity and uncertainty for investing in lithium extractors and processors going forward. DemandLithium mining and processing aren't new industries, but they are experiencing a structural change in their demand profile. Lithium is a chemical element that doesn't occur freely in nature, but only in compounds, and is generally extracted from hard-rock despots or brines and then processed into a useable chemical product. Historically, demand for lithium chemical products has come from applications in glass and ceramics, as well as additives in steel and aluminium production. Today, due to the superior energy-to-weight characteristics of lithium, lithium chemical products have become an important component of the rechargeable battery cells that can be found in most modern electric vehicles. As the world looks to transition away from fossil fuels, the demand for electric vehicles, and subsequently lithium chemical products, is robust.
Figure 2 - Albemarle Investor Day September 2021; Roskill The trouble is, while lithium is not exactly scare, the supply chain from raw material to useable chemical product is still developing as demand grows rapidly.
ExtractionAs mentioned earlier, lithium must be extracted (via hard-rock mines or brine lakes) and then processed into a useable chemical product. The Australian lithium extraction industry is dominated by hard-rock assets (mines) that produce an ore which contains the lithium-bearing mineral spodumene. Like all ore bodies, hard rock spodumene deposits can vary in size and grade, which ultimately affects the quantity, quality and cost of the product produced (see Australian spodumene cost curve below). Spodumene must be processed into a concentrate of a suitable grade before it can be processed into a chemical product, and thus higher-grade ore bodies can have significantly less costly pathways to final product. Brine assets (most found in South America) take saline brines with high lithium content and pump them from below the earth's surface into a series of evaporation ponds from which a more concentrated lithium-brine is produced.
ProcessingSpodumene concentrate can be converted directly to lithium hydroxide, while brine assets ultimately produce a lithium carbonate, which can then be further treated to create a hydroxide product if necessary. To further complicate things, not all processing assets are integrated with upstream raw material extraction assets, meaning they must procure raw materials (i.e., spodumene or lithium carbonate) from producers. Currently China has the dominant share of downstream lithium conversion capacity, a function of a historical cost advantage and proximity to customers. Australia's share of global downstream conversion is significantly smaller than its extracted share and will remain so even as assets currently under construction come online. Increasingly, Australian spodumene producers are looking to capitalise on the opportunity for margin expansion via vertical integration into downstream conversion, largely because of the price strength in lithium chemical products and the view that customers will want an ex-China supply chain. Given Australia is long spodumene (and China is short) it makes sense to develop optionality around spodumene concentrate offtake and create a lever around which the "seaborne" lithium products markets can be kept tight. Like extraction assets, processing assets will have different capital requirements and cost positions depending on their location, scale, and access to raw materials. The cost curve for integrated processing assets remains in its infancy, given many projects that make up industry cost estimates are either still under construction or ramping up.
SupplyUltimately to meet demand raw material supply will have to come from both hard-rock and brine assets. Battery chemistry will vary depending on the availability of supply as well as the manufacturers preference, meaning supply of both lithium hydroxide and carbonate will be necessary. The main takeaway here is simply that the lithium battery supply chain is complex, and that given this it should be expected that theoretical supply will undoubtedly differ from realised supply. Below is a consensus estimate of the future supply-demand balance for lithium (as measured in Lithium Carbonate Equivalent tonnes) out to 2030. While obviously these estimates are rubbery, it gives a feel for the extent to which an imbalance may eventuate.
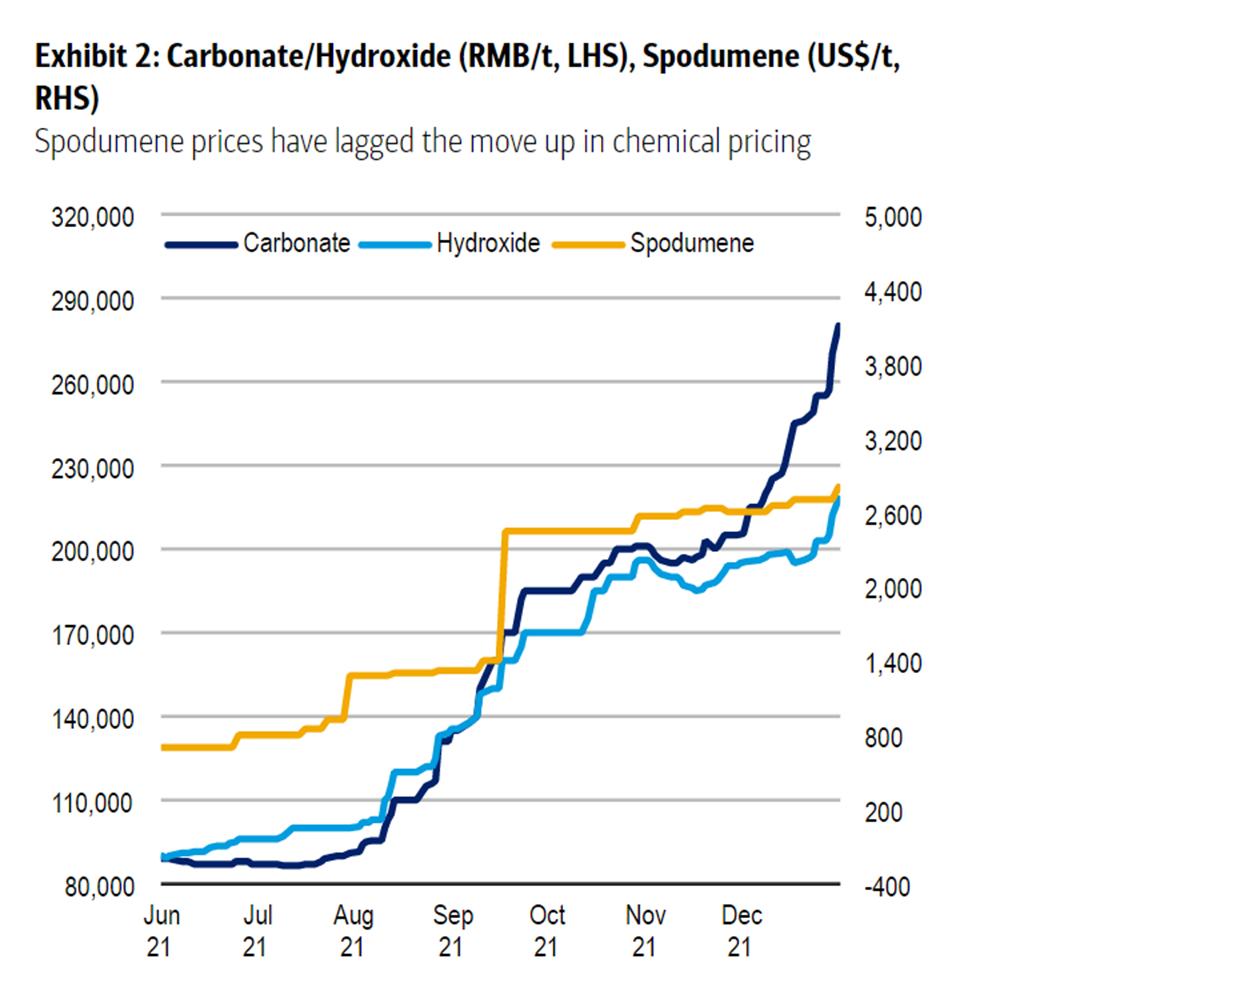
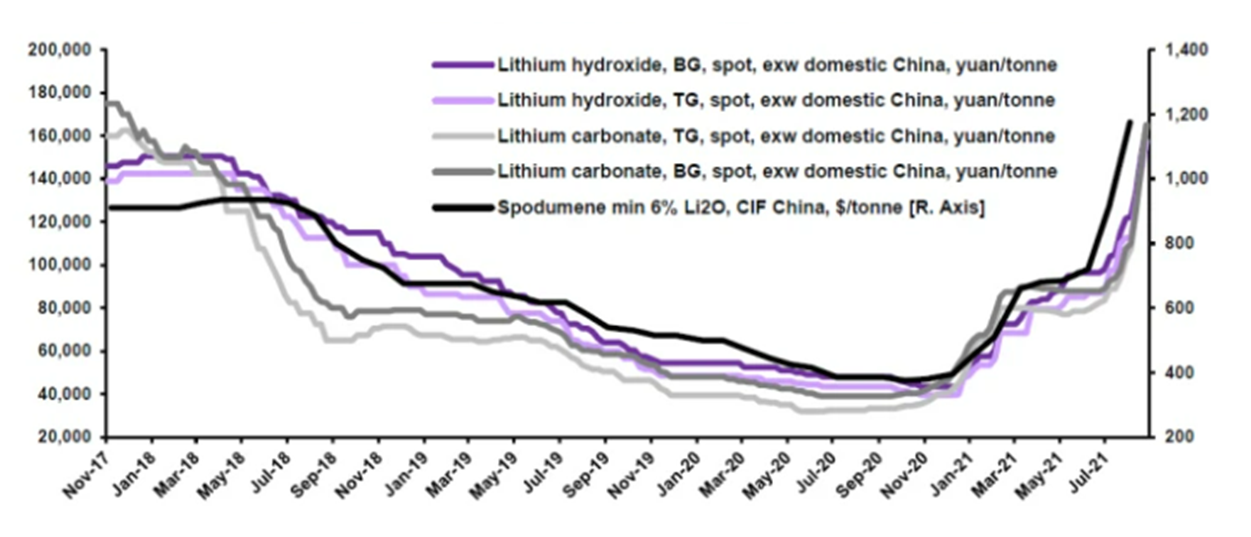
Figure 6- Airlie Funds Management PriceOf course, the reason cost curves, and supply-demand paradigms are poured over by investors is to take a view on future prices. Often with resources stocks, get the commodity price right and you'll give yourself a fighting chance investing in the right companies. Over the past twelve months, prices for lithium products have exploded.
Figure 7 - BofA Global Research, January 2022
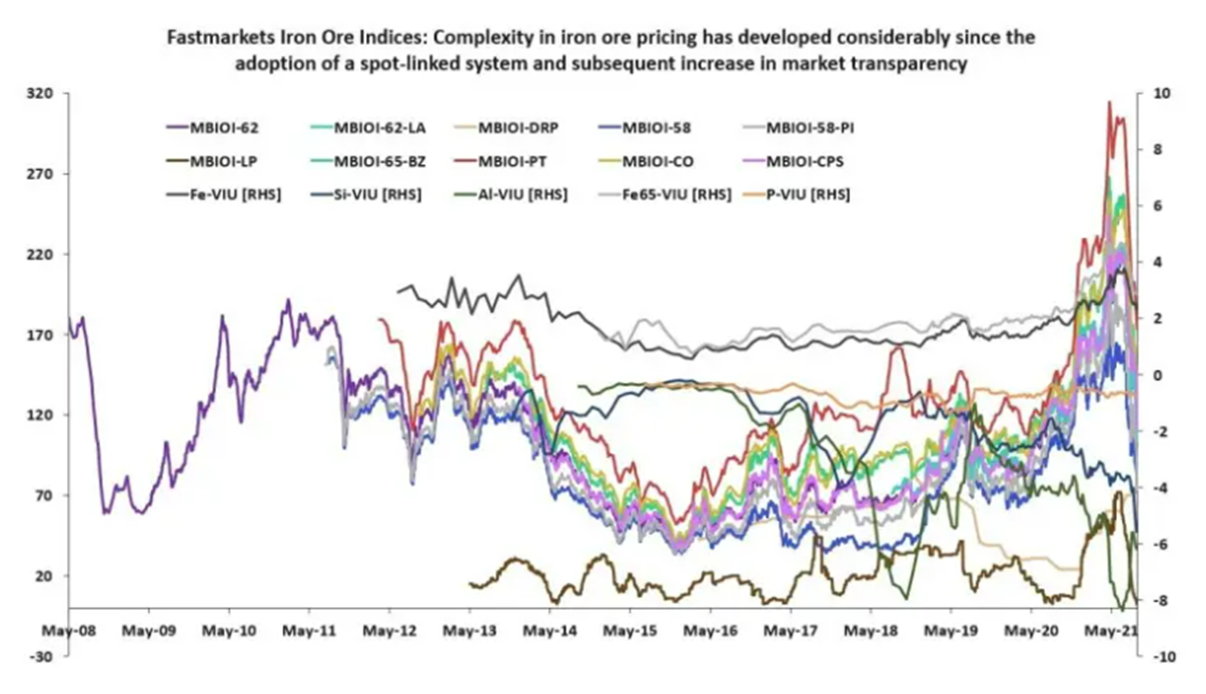
Figure 8 - Fastmarkets 2021 But how should we interpret spot prices given the structure of the lithium industry? Are "spot" prices an accurate reflection of what producers are receiving? At present, spot transactions only account for a small portion of supply of lithium raw materials and chemical product producers, with most volumes traded in fixed price or index-linked contracts (for set periods). For spodumene spot pricing, many market participants have begun relying on Pilbara Minerals (PLS) BMX Platform results, in which the company auctions off small parcels of spodumene to prospective customers. If these "spot" prices reflect what is being paid for the marginal tonne of product, then they still give great insight into the market balance. Without wanting to oversimplify things or draw flawed comparisons, we can look at the development of the iron ore price (and value-in-use price variation) as a guide to how the lithium pricing system could mature. The iron ore market moved to a spot-linked pricing system in 2008, despite considerable variation in product quality and specific end-use. The result has ultimately been a significant increase in market transparency which we believe should be expected for lithium over the next decade.
With greater transparency over market pricing should come greater ability for market participants to allocate capital, and ideally create a smoother transition to electric vehicle use. Yet, as investors we still must take a view on future prices even as pricing systems develop. For mature commodities, long-term price forecasts typically reflect a marginal cost of production, where prices are set by cash operating cost levels that ultimately mean those at the top of the cost curve are not profitable, so as not to induce oversupply. The general rule of thumb most people use here is equivalent to ~90% of the cost curve. An obvious example where this logic is applied is to a mature commodity is again iron ore, where long run prices are usually US$60-80/t, with 90% of the cost curve effective profitable at ~US$70/t. Using this approach for say spodumene, would yield a long run price of ~US$450/t, versus spot of >US$3,000t. Given the lithium market is not "mature" in the sense that pricing is underdeveloped, and the future supply-demand equation remains so unbalance, a marginal cost of production method for forecasting future price is perhaps unreasonable. Instead, to address the future supply-demand imbalance predicted, new production needs to be incentivised - i.e., Long-term pricing must be bid-up to encourage investment in new supply, and so it's not out of the realm of possible that current spot prices can hold for longer than people expect, or for long run prices to settle above the current cost curve (especially given this cost curve will have to change over the next decade). All in all, without a crystal ball and given the plethora of unknowns, we remain open to the possibility that spot prices can hold or go higher despite their impressive run. Even modest changes to the supply-demand equation can see hefty price responses, and it would be foolish to assume to future will not be volatile in both directions. How are we navigating the lithium sector at Airlie?Given the industry dynamics discussed above, we believe it is prudent to have some form of lithium exposure in our portfolio. The uncertainty that features in all aspects of the lithium paradigm means each opportunity warrants a degree of conservatism, and valuation is still important, despite rubbery supply, demand, and price forecasts. Undoubtedly, we will see an endless stream of new explorers-cum-developers front the market over the next decade, some of which will be fantastic investment opportunities and some of which will be looking to take advantage of investor optimism. In our previous Stock Story, we highlighted Mineral Resources (MIN) as our preferred lithium exposure. Mineral Resources represents a compelling investment both in isolation, and when considering its relative valuation versus other ASX-listed producers. For MIN, earnings growth will be driven by the organic expansion of spodumene and iron ore production volumes, as well as the development of a lithium hydroxide conversion plant via a JV with global producer Albemarle. Supporting this growth is MIN's robust mining services business and exceptional management, and it remains a key holding in our portfolios. Written By Joe Wright, Analyst - Airlie Funds Management Funds operated by this manager: Airlie Australian Share Fund |
.PNG)
.PNG)
.PNG)
.PNG)