
NEWS

3 May 2022 - Performance Report: Laureola Australia Feeder Fund
| Report Date | |
| Manager | |
| Fund Name | |
| Strategy | |
| Latest Return Date | |
| Latest Return | |
| Latest 6 Months | |
| Latest 12 Months | |
| Latest 24 Months (pa) | |
| Annualised Since Inception | |
| Inception Date | |
| FUM (millions) | |
| Fund Overview | Life Settlements are resold life insurance policies and can be thought of as a form of finance extended to an individual backed by the person's life insurance policy. This financing is repaid upon maturity by collecting the death benefit from the insurance company. Risk mitigation measures implemented by Laureola include science-driven due diligence of policies, active monitoring of insured through a vertically integrated operation, and investor aligned fund design. |
| Manager Comments | The Laureola Master Fund has a track record of 8 years and 11 months and has outperformed the Bloomberg AusBond Composite 0+ Yr Index since inception in May 2013, providing investors with an annualised return of 14.48% compared with the index's return of 2.9% over the same period. On a calendar year basis, the fund hasn't experienced any negative annual returns in the 8 years and 11 months since its inception. Over the past 12 months, the fund's largest drawdown was -2.39% vs the index's -8.66%, and since inception in May 2013 the fund's largest drawdown was -4.9% vs the index's maximum drawdown over the same period of -8.94%. The fund's maximum drawdown began in December 2018 and lasted 10 months, reaching its lowest point during December 2018. The fund had completely recovered its losses by October 2019. During this period, the index's maximum drawdown was -0.98%. The Manager has delivered these returns with 1.87% more volatility than the index, contributing to a Sharpe ratio which has consistently remained above 1 over the past five years and which currently sits at 2.3 since inception. The fund has provided positive monthly returns 97% of the time in rising markets and 94% of the time during periods of market decline, contributing to an up-capture ratio since inception of 160% and a down-capture ratio of -204%. |
| More Information |

3 May 2022 - Twitter bids, social media monetisation and control in volatile markets
|
Twitter bids, social media monetisation and control in volatile markets Forager Funds Management 02 May 2021
In this episode, CIO Steve Johnson is joined by whisky-naysayer (and Senior Analyst) Chloe Stokes to discuss the bid for Twitter, social media monetisation, and control in volatile markets. Chloe also shares her experience as a younger investor and reveals the stocks (and burgers) currently on her watchlist. "As shareholders, we can't help but be disappointed. We bought [Twitter] because we thought the platform had a lot of potential," Chloe tells Steve. "It's obvious that we think it's worth more than the bid, because we held it through periods where it was trading much higher and still thought it was worth more than those higher prices. So, we are definitely not happy from a price perspective, but on the other hand, we can't stop talking about it." Timestamps 02.30 Start |
|
Funds operated by this manager: Forager Australian Shares Fund (ASX: FOR), Forager International Shares Fund |

3 May 2022 - ESG Insights: Being a good NABER
|
ESG Insights: Being a good NABER Tyndall Asset Management March 2022 Whenever stranded assets are mentioned we are likely to conjure the image of a dilapidated oil terminal that no longer has any value attached to it due to alternate fuels or costly environmental regulations. Commercial real estate rarely enters our consciousness and as a result the REIT sector has never had the intense ESG spotlight shone on it by the public or the wider investor base. How is ESG impacting investing? ESG focused investing has really ramped up in recent history and has gradually shifted from just the direct operations of a company to now analyzing the impact of all its organs. As a result, firms will have to reflect and act on every part of their operations - whether that includes a manufacturer assessing the carbon intensity of its HQ, a pharmaceutical trying to lessen water usage at its distribution centre or a tech company maximizing the air quality on its campuses. Thus, the real estate occupied by those firms will become increasingly scrutinized and assets that cannot be adapted to the tenant's growing requirements risk becoming obsolete and costly for its owners to hold.
While there are similar NABERS ratings on water, indoor air and waste, energy has grown to be the most prolific due to legislative requirements. Under the current system all commercial offices over 1000sqm that wish to advertise for leasing or selling purposes must disclose their NABERS energy rating. Furthermore, in order to attract the government as a tenant the base building requires a minimum 4.5 star NABERS rating. As a result, NABERS has become the leading benchmark for assessing the 'green-ness' of a property. What can businesses expect to see? The current landscape in the Australian market is that of institutional investors leading the pack and commandeering more of the higher star rating assets. Morgan Stanley research found that the three biggest listed office landlords had a significantly high performing portfolio with Mirvac (MGR), Dexus (DXS), and GPT achieving a portfolio average rating of 5.5, 5, and 5 respectively for their office assets. This has largely been the result of an active development pipeline helping refresh the age of the portfolio as well as conscious decisions to refurbish older assets to meet modern environmental standards. Employees are also increasingly expecting their employers to be environmentally conscious - a survey by HR resource company ELMO found that 71% of Generation Z workers would refuse to work for a company that was not seriously dealing with climate change. Furthermore, ambience and aesthetics are also rising in importance with a future workplace wellness study found that 31% of employees lose the equivalent of 60 minutes of productivity if the environmental wellness of their environment such as air quality and other factors were not satisfactory. Increasingly the mental health of employees is being brought to the fore thanks to the pandemic and companies who wish to be seen as socially responsible will need to accommodate this. Employers are taking note - JLL reported that 73% of their APAC based tenants surveyed saying they will be retrofitting assets by 2025 to meet these requirements such as achieving net zero and ensuring the office is a pleasant location to be. The COVID pandemic has shaken up the office sector in various ways. Vacancies in CBDs have ballooned, with Sydney climbing from 4% pre-pandemic to 13% currently. Companies are re-assessing their space requirements which will certainly be influenced on how successfully they are able to persuade staff to return to the office. With widespread reports of labour shortages, it looks that the balance of power has shifted towards the employees. Employers in a post-COVID world will face the dual challenges of keeping their staff by aligning their actions with the staff's ESG values as well as also providing enticements to lure them back into the offices - no doubt challenges landlords will have a stake in. It has become clear that for employers to retain talent and encourage employees back to their offices for physical collaboration, they will need to ensure their assets and workspaces are up to scratch. Feedback from asset owners and leasing agents are that expectations from tenants are shifting to asset owners providing the amenities required by their employees such as coffee shops or breakout areas whereas previously the landlord was only responsible for the capital to ensure the base building was environmentally friendly. The costs of these amenities historically would be recouped through higher rents or lower incentives however the supply/demand dynamics in this market means tenants have effectively externalized a portion of their costs to meet environmental and social expectations to landlords. Where are we seeing vacancies? If history is any guide, the current over-supply situation (highlighted by elevated vacancies) will result in lower rental price growth and higher incentives (in the form of fit out contributions or rent-free periods) which negatively impact the cashflow of the landlords. While this trend was observed in 2020-2021, our channel checks have found that the performance of assets have become increasingly bifurcated. Prime grade assets (Premium & A grade) continue to hold onto higher rents and lower vacancy while the declines in rents has mostly been felt in B grade assets and below. One asset owner has even stated that they are seeing further bifurcation with A grade starting to lose some of its lustre leading to a 'Premium vs everything else' situation. This trend has been accelerated post-COVID with a common theme in the Feb-2022 reporting season being an acute sense of 'flight to quality'. For example Mirvac called out 80% of their vacancies were located in their lower tier assets. This is not surprising given higher-grade assets predominately have 5-6 star ratings further enhanced with numerous amenities to maintain tenants and their increasingly demanding staff. The Australian listed market and other large institutional owners have been acutely aware of this and have largely been successful in ensuring their portfolios are at the higher end of the NABERS spectrum. Conversely, B-grade assets and below are mostly held by private owners. Typically such owners have less access to capital and as such may struggle to make the necessary investment to upgrade the asset ratings. Refurbishments required to drive an increase in the NABERS ratings require significant capital and often involve asset downtime (from 1 - 2 years). Activities such as replacing the cladding of a building has shown to potentially cost >10% of the asset value itself. As such, we expect more and more assets becoming more obsolete as the capital costs to upgrade older assets are prohibitive especially for non-institutional investors. Additionally, debt markets are also starting to differentially price ESG factors. In 2021 GPT issued their inaugural Green Bond of $250m and we expect this to be the first of many. Whilst this has not translated to lower cost of debt for green assets yet, expectations are that liquidity pools will become more discerning around ESG which over time should translate to higher cost of debt for ESG-poor assets. Ultimately while we are concerned about the current oversupply in the market and the uncertainty in the sector's vacancy outlook due to COVID and increased working from home, we are somewhat comforted by the fact that the Australian listed players have positioned themselves relatively well in regards to the sustainability of their asset portfolios. This should partially offset future structural uncertainties as we believe not all the competing supply in the market is fit for purpose and given ESG requirements on buildings are only getting more stringent, we expect the pool of 'ESG-ready' assets to shrink further. Funds operated by this manager: Tyndall Australian Share Concentrated Fund, Tyndall Australian Share Income Fund, Tyndall Australian Share Wholesale Fund Important information: This material was prepared and is issued by Yarra Capital Management Limited (formerly Nikko AM Limited) ABN 99 003 376 252 AFSL No: 237563 (YCML). The information contained in this material is of a general nature only and does not constitute personal advice, nor does it constitute an offer of any financial product. It does not take into account the objectives, financial situation or needs of any individual. For this reason, you should, before acting on this material, consider the appropriateness of the material, having regard to your objectives, financial situation, and needs. The information in this material has been prepared from what is considered to be reliable information, but the accuracy and integrity of the information is not guaranteed. Figures, charts, opinions and other data, including statistics, in this material are current as at the date of publication, unless stated otherwise. The graphs and figures contained in this material include either past or backdated data, and make no promise of future investment returns. Past performance is not an indicator of future performance. Any economic or market forecasts are not guaranteed. Any references to particular securities or sectors are for illustrative purposes only and are as at the date of publication of this material. This is not a recommendation in relation to any named securities or sectors and no warranty or guarantee is provided. |

2 May 2022 - 10k Words
|
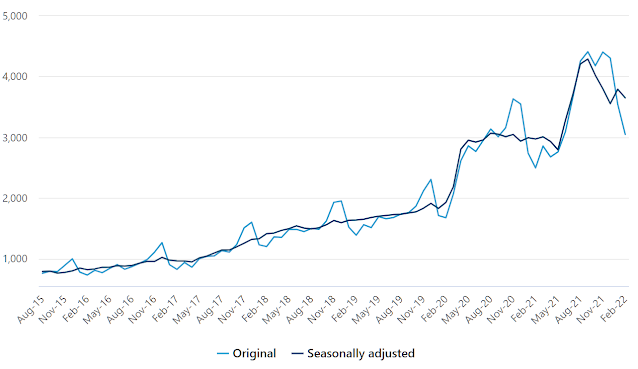
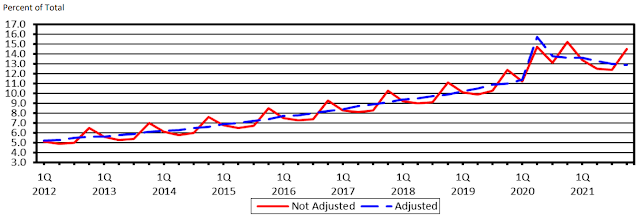
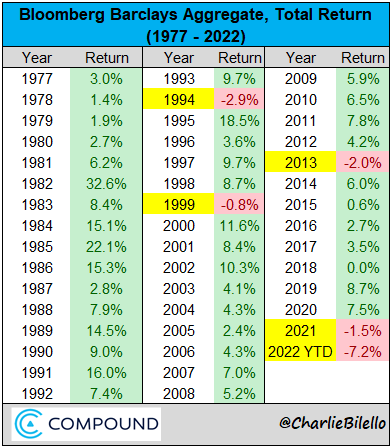
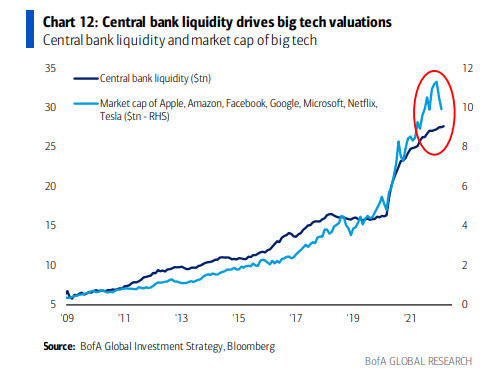
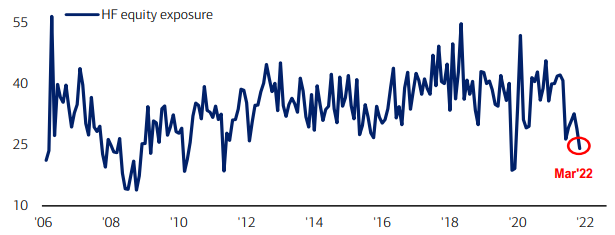
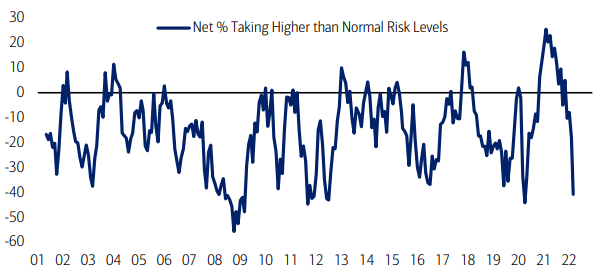
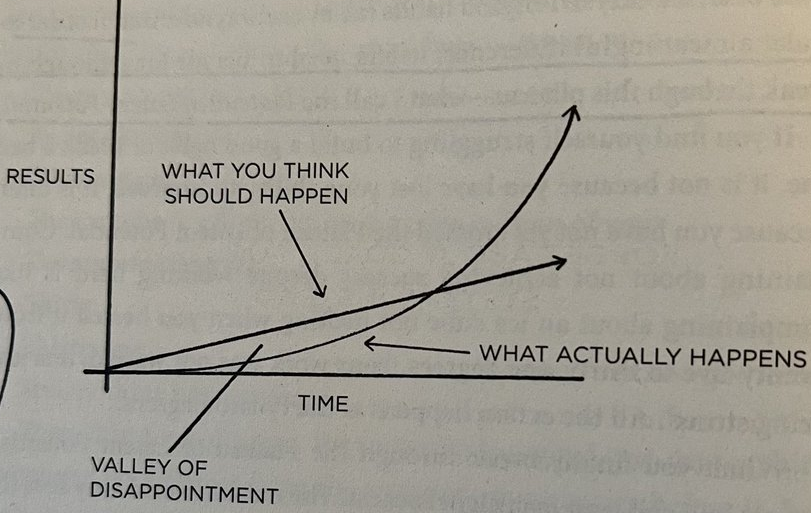
10k Words Equitable Investors April 2022 Apparently, Confucius did not say "One Picture is Worth Ten Thousand Words" after all. It was an advertisement in a 1920s trade journal for the use of images in advertisements on the sides of streetcars. Even without the credibility of Confucius behind it, we think this saying has merit. Each month we share a few charts or images we consider noteworthy. Online sales volumes have retreated in absolute numbers and as a share of total sales as the charts from the Australian Bureau of Statistics and the US Census Bureau show. US government bonds are on track to deliver their worst annual loss, Compound Capital Advisors highlights. Bank of America links the preceeding surge in central bank liquidity with the value of "Big Tech" stocks. A correlation between inflation worries and the relative valuation of small caps is charted by BCA Research. Quantitative Value co-author Tobias Carlisle shows that "unexcellent" stocks have outperformed "excellent" stocks over time. We return to BofA to look at how hedge funds and fund managers have become reluctant to take on risk. And, finally, "The Plateau of Latent Potential" is a chart from the book Atomic Habits that spoke to us.
Source: ABS
Source: US Census Bureau
Source: Bank of America
Source: Bank of America
Source: @JamesClear, Atomic Habits via @SvnCapital April Edition Funds operated by this manager: Equitable Investors Dragonfly Fund Disclaimer Nothing in this blog constitutes investment advice - or advice in any other field. Neither the information, commentary or any opinion contained in this blog constitutes a solicitation or offer by Equitable Investors Pty Ltd (Equitable Investors) or its affiliates to buy or sell any securities or other financial instruments. Nor shall any such security be offered or sold to any person in any jurisdiction in which such offer, solicitation, purchase, or sale would be unlawful under the securities laws of such jurisdiction. The content of this blog should not be relied upon in making investment decisions.Any decisions based on information contained on this blog are the sole responsibility of the visitor. In exchange for using this blog, the visitor agree to indemnify Equitable Investors and hold Equitable Investors, its officers, directors, employees, affiliates, agents, licensors and suppliers harmless against any and all claims, losses, liability, costs and expenses (including but not limited to legal fees) arising from your use of this blog, from your violation of these Terms or from any decisions that the visitor makes based on such information. This blog is for information purposes only and is not intended to be relied upon as a forecast, research or investment advice. The information on this blog does not constitute a recommendation, offer or solicitation to buy or sell any securities or to adopt any investment strategy. Although this material is based upon information that Equitable Investors considers reliable and endeavours to keep current, Equitable Investors does not assure that this material is accurate, current or complete, and it should not be relied upon as such. Any opinions expressed on this blog may change as subsequent conditions vary. Equitable Investors does not warrant, either expressly or implied, the accuracy or completeness of the information, text, graphics, links or other items contained on this blog and does not warrant that the functions contained in this blog will be uninterrupted or error-free, that defects will be corrected, or that the blog will be free of viruses or other harmful components.Equitable Investors expressly disclaims all liability for errors and omissions in the materials on this blog and for the use or interpretation by others of information contained on the blog |
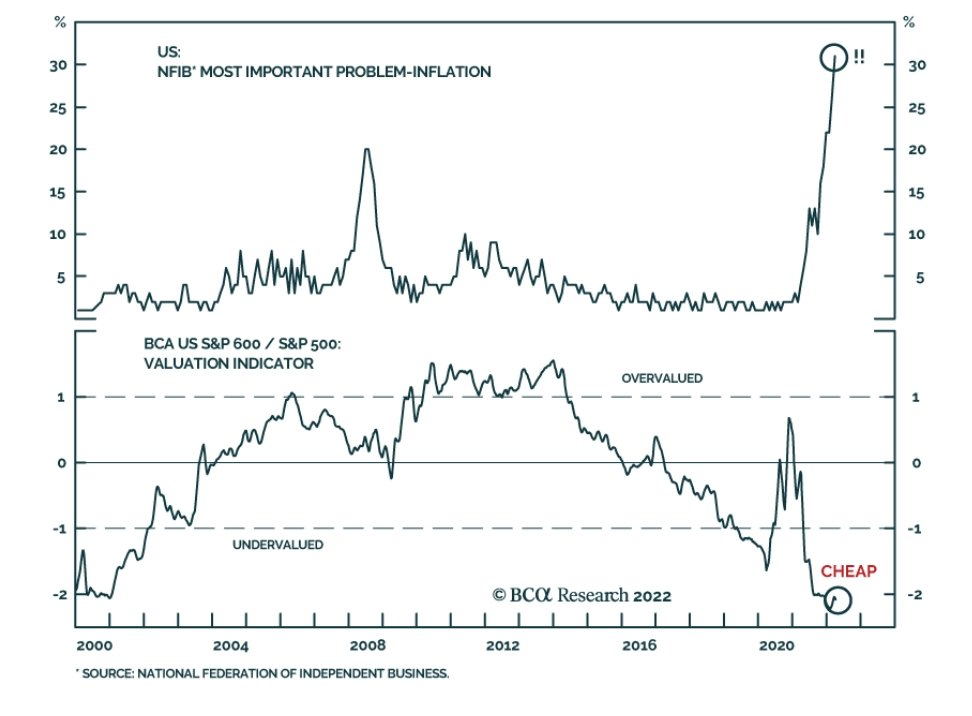 Source: BCA, @Scutty
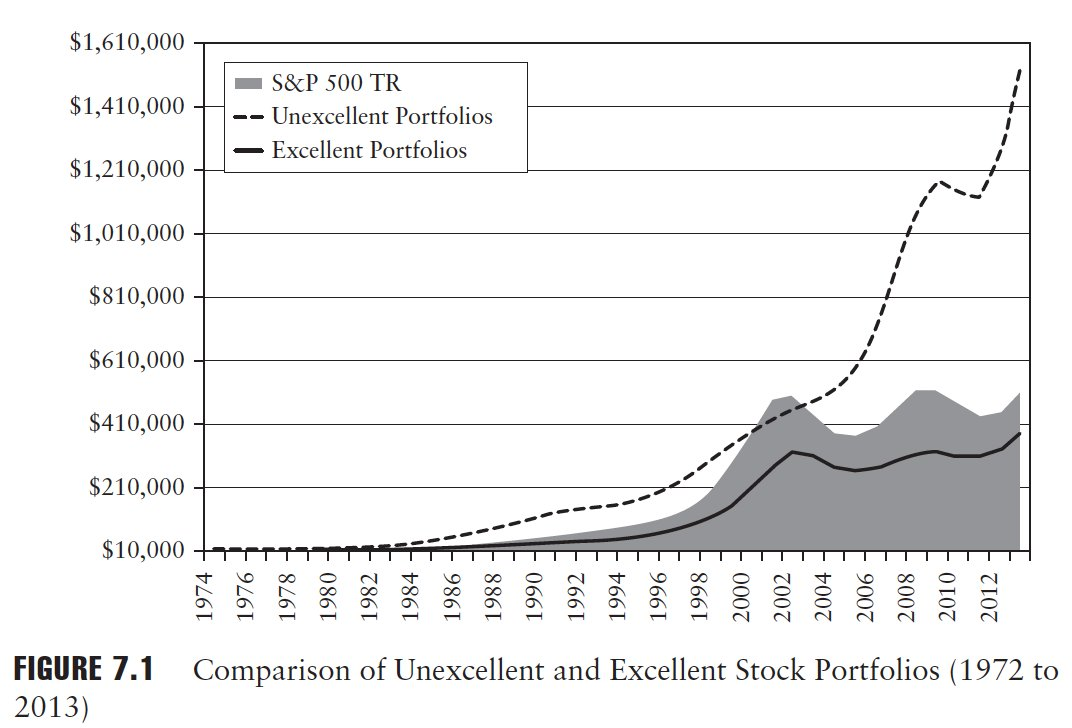

29 Apr 2022 - Hedge Clippings |29 April 2022
|
|
|
|
Hedge Clippings | Friday, 29 April 2022
Half way there - only three weeks to go... Only Anthony Albanese's staunchest supporters would describe him as an exciting, inspiring or charismatic politician. So whilst he's been locked away with COVID how come this election campaign has seemed even more boring than usual? To be fair, the requirements of, or for, a good PM don't have to include charisma, or to be inspirational, but even a touch of either would liven things up a bit. Given (according to the polls) it looks a better than even chance he'll be running the country in a few weeks' time one can only hope that whilst in isolation he has at least been able to brush up on his long forgotten, but recently recalled, economics degree. Hedge Clippings doesn't want to put any of our hard earned on the outcome, but our current call is for a minority government, with a group of independents (hopefully excluding Clive and his UAP) calling the shots. If that outcome comes to pass, that's democracy in action, but who knows where it will lead over the following three years? In the meantime there were two major confirmations over the past week: Firstly, that China is much smarter strategically and politically than Australia, the USA and New Zealand put together. Any thoughts that China WON'T militarise the Solomon Islands seem implausible, otherwise why would they have bothered in the first place, and why won't they release the terms of the deal? One can assume that no amount of pressure or persuasion will result in them retreating back to the Chinese mainland, the Spratly Islands - or even in due course, to Taiwan. Secondly, confirmation this week that inflation, and therefore interest rates, will soon be rising. A couple of months ago we thought this would not occur before June to avoid the impending election, but the RBA now has to justify why NOT to move in May at next Tuesday's board meeting. Whilst it will make all the headlines, the questions that really need to be asked are how many more, and how much higher will they go? Much of the latest annual 5.1% increase in inflation was sourced externally (oil, energy, COVID, supply chain, etc) or seasonal food prices, leaving the increase in the "trimmed rate" a slightly less alarming 3.7%. However, given inflation has averaged around 2.5% for the last 30 odd years, that's enough to worry the RBA, and the property market. Rates will certainly rise, but from such a low level that the effect on the economy, and the negative effects on consumer spending, will be magnified. How the government - whichever party or parties prevail - manages and the wage claims that follow will be critical. Given the uncertainty currenlty prevailing - both locally, and globally - the outcome of the election is going to be crucial, and we suspect the following three years will be painful. Much like the past two years, albeit for different reasons! News & Insights Hedging against inflation - gold or real estate? | Quay Global Investors The Experience Megatrend | Insync Fund Managers 10k Words | Equitable Investors |
|
|
March 2022 Performance News |
|
|
If you'd like to receive Hedge Clippings direct to your inbox each Friday
|

29 Apr 2022 - Fund Review: Insync Global Capital Aware Fund March 2022
INSYNC GLOBAL CAPITAL AWARE FUND
Attached is our most recently updated Fund Review on the Insync Global Capital Aware Fund.
We would like to highlight the following:
- The Global Capital Aware Fund invests in a concentrated portfolio of 15-30 stocks, targeting exceptional, large cap global companies with a strong focus on dividend growth and downside protection.
- Portfolio selection is driven by a core strategy of investing in companies with sustainable growth in dividends, high returns on capital, positive free cash flows and strong balance sheets.
- Emphasis on limiting downside risk is through extensive company research, the ability to hold cash and long protective index put options.
For further details on the Fund, please do not hesitate to contact us.

29 Apr 2022 - Gradually, then suddenly
|
Gradually, then suddenly Novaport Capital April 2022 Markets always present a multitude of opportunities and obstacles. However at any given point in time there are only a select few, around which traders coalesce. Commentary and action align to these few factors, which then powerfully drive markets. Recognising this, and the rationale for it, or indication of a pivot in market trends helps identify and reprioritise risk. In this way, issues which the market has long ignored can suddenly seem to be the only thing that matters. During the GFC, the market seemed only to care about balance sheets. In recent years it has been pre-occupied with innovation and disruption. Today, we are grappling with the most fundamental changes to international relations since the end of the Cold War. These risks have always been present, yet the reprioritisation of these risks is changing the flow of funds, between nations, between asset classes, and within the underlying sectors of asset classes. Small cap investing: Top down has become paramount A trend of the last decade has been the grouping of stocks into ever more diverse 'baskets' (often known as an index). Today these 'baskets' are sold by securities dealers as a product. Stocks can be grouped by industry, quantitative factors or thematic association. In the past, the profit motivation behind these classifications formed part of a two-step process.
When investors purchase a basket from a dealer, they are de-emphasising stock selection. In recent years we have observed a shift in Australian Small Companies market dynamics. Increasingly, money is deployed with a greater emphasis on macro-strategy (i.e. step one above); yet seemingly without significant focus applied to the fundamental performance of the underlying businesses (step two). The outcome is a growing number of companies exhibiting a divergence between their share price performance and operational performance. The most obvious demonstration of this has been the increasing correlation of stocks within certain baskets. For example, the correlation of Australian Technology stocks to the US NASDAQ index. This correlation ignores the fact that each Australian tech stock has its own fundamental and operational opportunities and challenges distinct from the success of Nvidia, Facebook, Netflix or Tesla. In contemporary markets, it seems that share price performance depends on being allocated to the 'right' group of stocks rather than actual business performance. This has been particularly evident in the last two reporting seasons. We saw many companies fail to deliver on expectations. Yet their share price performance was more powerfully explained by broader market trends than their underlying performance. It is important to note that this relates not only to profit but outcomes have also been skewed for looser metrics, such as revenue. The willingness of markets to overlook operational performance of individual stocks is not sustainable. However we do not dictate how the market chooses to reward speculation. Markets are expressions of emotions as well as logic and we cannot expect them to be rational. What we can look for is catalysts which might change sentiment and behaviour. At this point in time, there are several. None of these are new, yet suddenly they have become relevant. Looking ahead We believe identifying and responding to change faster than the market is key to successful investing. So much has changed since March 2020 and the market is still adapting. The assumption that markets will resume their pre-covid trajectory ignores the profound changes that have occurred. The following trends are reshaping market dynamics in our view. 1. Demographics The ageing global population has been apparent for a long time however its adverse impact has been offset by globalisation and trade, which delivered to enterprises the gift of a huge increase in the pool of available labour. While its sustainability has always been questionable (particularly due to the ageing population in China) it has not registered as a concern for markets. The escalation of tensions in global markets brings the challenges of a shrinking workforce into sharper focus. 2. ESG Awareness of Environmental, Social and Governance issues is challenging the status quo. For example, the current US Trade Representative Katherine Tai has been vocal in raising ESG issues at the World Trade Organisation, arguing that trade policy must take the environment and workers' rights into account. Whilst coming from a different angle, this approach is a continuation of the more assertive trade policy adopted by the previous US administration. Trade frictions will not only impact labour markets but will also alter the flow of capital through financial markets. When President Trump first pushed back against free trade the market seemed less concerned. Now it is clear that scrutiny of trade relationships is bipartisan. The market must now reprioritise this risk. 3. Geopolitics Relationships between the world's great powers were evolving prior to the pandemic. Tensions were evident due to conflicts in Syria and Crimea. Since the shocking invasion of Ukraine there has been a call to action. Today global leaders are not only worried about the equitable distribution of the benefits of trade, but also the security and resilience of their economies. Our own Prime Minister has recently committed to support development of 'Just in Case' rather than 'Just in Time' models for critical supply chains. Aligning national security with industrial development is a significant contrast to decades of globalisation. It will require substantial investment and impact trade relationships, labour markets and capital markets. The weaknesses of globalisation have always been obvious. The sudden need to address these weaknesses has become a priority which is rapidly changing the investment landscape. 4. Market structure The pandemic forced economic change at a scale and breadth almost unimaginable to contemporary financial markets. GFC-era measures were enhanced and expanded to ensure the resilience of financial markets. There was also increased validation for the role of Government in the economy. The US Federal Reserve has put in place massive backstops to ensure the liquidity of the market for US Treasuries and the core banking system. Yet today, with extra ordinary guard rails around banking and risk-free assets, there may be scope for a lower strike of the famous "Fed Put" on markets. 5. Experience The current cohort of market leaders have enjoyed their dominant position for an extended period. Software as a Service and the Cloud are no longer new concepts and markets have had time to become more discriminating about which companies they are going to support. After a period of time, all start-ups progress from 'promising' to having a demonstrated track record. Good or bad. The incipient pivot from judging the best known and loved start-ups of the last decade on what they promise to deliver relative to what they have delivered is inevitable yet will seem sudden. In summary, plenty has changed… These five themes will force markets to reprioritise their risk assessments. None of these risks are obscure or unknown, however changing events is triggering a reassessment. The market tends to focus on a relatively small number of issues. So when these change, price movements can seem extraordinary. Therefore, we adapt There are important implications for investors in Australian Small Companies. Over the last half decade investors converged around a growth thematic supported by the theory that low inflation, low interest rates and market-friendly central banks would remain enduring features. As a result, investing in baskets of stocks aligned to this theme became as important if not more so than understanding the actual performance of underlying businesses. Changes in the inflation and monetary outlook also challenge the significant weight of money aligned with the established macro-strategic positioning. Investors can adapt by re-evaluating the outlook for the businesses they are invested in on a case-by-case basis, then refocusing on those businesses which they consider enduring or alternatively finding new investments which can be beneficiaries of change. Author: Sinclair Currie, NovaPort Principal and Co-Portfolio Manager Funds operated by this manager: NovaPort Microcap Fund, NovaPort Wholesale Smaller Companies Fund |
28 Apr 2022 - Performance Report: Equitable Investors Dragonfly Fund
| Report Date | |
| Manager | |
| Fund Name | |
| Strategy | |
| Latest Return Date | |
| Latest Return | |
| Latest 6 Months | |
| Latest 12 Months | |
| Latest 24 Months (pa) | |
| Annualised Since Inception | |
| Inception Date | |
| FUM (millions) | |
| Fund Overview | The Fund is an open ended, unlisted unit trust investing predominantly in ASX listed companies. Hybrid, debt & unlisted investments are also considered. The Fund is focused on investing in growing or strategic businesses and generating returns that, to the extent possible, are less dependent on the direction of the broader sharemarket. The Fund may at times change its cash weighting or utilise exchange traded products to manage market risk. Investments will primarily be made in micro-to-mid cap companies listed on the ASX. Larger listed businesses will also be considered for investment but are not expected to meet the manager's investment criteria as regularly as smaller peers. |
| Manager Comments | In March, the fund's best performed holdings were the largest and more liquid: Omni Bridgeway (OBL) and EML Payments (EML). Equitable added that the Fund underperformed benchmarks like the S&P/ASX Small Ordinaries and Emerging Companies indices that are weighted to more liquid investments - and unlike the Fund they also feature a material exposure to the resources sector, which had a strong month. The portfolio holdings that made positive contributions in the quarter were generally those with a track record of profitability, such as Earlypay (EPY), Omni Bridgeway (OBL), Pental (PTL) and Reckon (RKN). Three of the four of those names have market caps greater than $100m (OBL is just shy of $1 billion, PTL is the odd one out at ~$70m). At the other end of the spectrum, three of the four worst performed investments for the quarter had market caps less than $50m. The volume of shares traded declined by at least 50% for each of these four names when comparing the March 2022 quarter with the December 2021 quarter - and volume for three of the four was at least 40% lower compared to the prior March quarter. Equitable emphasised their view that liquidity is a double-edged sword and in this quarter it hurt their mark-to-market NAV pricing. |
| More Information |

28 Apr 2022 - Fund Review: Bennelong Kardinia Absolute Return Fund March 2022
BENNELONG KARDINIA ABSOLUTE RETURN FUND
Attached is our most recently updated Fund Review. You are also able to view the Fund's Profile.
- The Fund is long biased, research driven, active equity long/short strategy investing in listed ASX companies.
- The Fund has significantly outperformed the ASX200 Accumulation Index since its inception in May 2006 and also has significantly lower risk KPIs. The Fund has an annualised return of 8.07% p.a. with a volatility of 7.69%, compared to the ASX200 Accumulation's return of 6.72% p.a. with a volatility of 14.18%.
- The Fund also has a strong focus on capital protection in negative markets. Portfolio Managers Kristiaan Rehder and Stuart Larke have significant market experience, while Bennelong Funds Management provide infrastructure, operational, compliance and distribution capabilities.
For further details on the Fund, please do not hesitate to contact us.

28 Apr 2022 - Is it time for an overweight allocation to Australian shares?
|
Is it time for an overweight allocation to Australian shares? Fidante Partners April 2022
For decades Australian investors have been encouraged to look beyond their backyard for investment opportunities. Holding an overweight exposure to the Australian market leads to an unintended skew towards the financial and mining sectors, which together comprise 53.41 per cent of a highly concentrated market as shown in Table 1 below. An allocation to international markets broadens a portfolio's exposure to global leading companies in the IT and Healthcare sectors, which are underrepresented in Australia. Table 1: Index Weightings
Source: https://www.spglobal.com/spdji/en/ as at 28 February 2022 This is a sound long-term strategic approach. However, at this juncture and after a decade of low interest rates across developed economies, we are now starting to see indications of a turn in the market cycle. Higher inflation and normalising interest rates are expected to remain a feature for the short to medium term. For several reasons outlined below, these factors are aligning to make Australian shares a compelling tactical investment opportunity on a relative basis in the medium term. 1. Relative valuation Despite the 8.22 per cent fall in the S&P 500 since the beginning of 2022 and after a decade of outperformance relative to global equities more broadly, US equities are still trading at P/E multiples close to their historical averages. The S&P 500 for example, has a forward P/E of 18.5 times, down from 22x at the start of the year and now in line with its long-term average of 18.6x. The derating is most apparent in the tech sector with mega caps such as Amazon, Alphabet, and other FANG+ stocks which were responsible for much of the index return over the past decade. As the US market surged over this period, the Australian market lagged on a relative basis. Based on a Global Fund Management survey (Chart 1 below) it appears that global fund managers are repositioning away from US equities with a preference for more attractively priced investment opportunities. Chart 1: Absolute net% OW positioning by investors
2. Longer path to higher rates Annual inflation rate in the US accelerated to 7.9 per cent in February of 2022, the highest in 40 years. Energy remained the biggest contributor (25.6 per cent versus 27 per cent in January), with gasoline prices surging 38 per cent (40 per cent in January). Other countries including the UK and Eurozone are not far behind. As a result, in many jurisdictions, bond markets have priced in a path of interest rate hikes particularly over the short term to temper the spike in the cost of goods and services. Higher interest rates will push up borrowing costs for businesses and households and slow economic growth. According to the Reserve Bank of Australia (RBA), a divergent path in Australia looks likely with inflation barely within their 2 to 3 per cent target band and wage inflation modest. Australia is also less impacted - but not immune - to rising energy costs as we are a net exporter of gas. China, our largest trading partner, is also seeing lower price growth with annual CPI at 1.5 per cent. Also, in contrast to other markets, China is taking a stimulatory approach to their economy adding liquidity rather than withdrawing Quantitative Easing. This should be a net positive for commodity producers. Chart 2
Source: Bloomberg as at 28 February 2022 3. Sector composition The dominance of banks and mining stocks in the Australian market could present opportunities for stock pickers at this point in the cycle. Concerns over rising interest rates over the medium term could increase banks' net interest margins as the gap between lending rates and deposit rates widens allowing greater scope to increase margins. Rising rates also reflects a stronger economic environment which leads to greater demand for credit and lower bad debts. Insurance companies also benefit as they can invest in bonds with higher yields. Australian Banks are well capitalised and are expected to maintain their dividend payout ratios, which are high relative to other companies in the market. As a major commodity producer, Australia is a beneficiary of rising gas prices, higher demand from reopening economies as well as higher agricultural prices. Commodities often have a positive correlation to inflation and play a safe haven role in inflationary environments and a hedge against falls in equity markets. Compounding the problem is the conflict in Ukraine which is impacting the supply of energy and other metals. A rise in demand combined with a reduction in supply could lead to a commodities super cycle. 4. Dividends and franking Australia's imputation system lends itself to higher payout ratios than global peers. Companies are incentivised to return capital to shareholders when there isn't a compelling opportunity to reinvest earnings. This reduces the risk of management teams pursuing capital-intensive projects that may not be in the best interest of shareholders. The average dividend yield for the ASX 200 is 4 per cent which is significantly higher than the 1.3 per cent average of the S&P 500. If stock market gains are more muted in 2022, with lower capital returns than we have experienced over the past decade, a higher franked dividend could prove attractive given the lower risk profile than growth focused stocks. Summary The big winners of the past decade have been long duration global growth stocks. Much of their returns have been driven by higher earnings expectations, due to the pull forward in demand caused by the COVID pandemic. Contrast this to banks or commodity-related companies where long-term growth rates are not be expected to be materially different to the current rate. In a climate of higher interest rate expectations, it is these higher growth stocks who are expected to suffer on a relative basis as the earnings outlook for other sectors improves. Despite the expectation of monetary policy tightening in Australia, inflation is relatively controlled thus far and short-term interest rates are generally favourable due to a slower than expected interest rate hiking cycle relative to other global markets. Funds operated by this manager: Bentham Asset Backed Securities Fund, Bentham Global Income Fund, Bentham Global Income Fund (NZD), Bentham Global Opportunities Fund, Bentham High Yield Fund, Bentham Syndicated Loan Fund, Bentham Syndicated Loan Fund (NZD) This material has been prepared by Fidante Partners Limited ABN 94 002 835 592 AFSL 234668 (Fidante), a member of the Challenger Limited group of companies (Challenger Group). The information in this material is not a recommendation, offer or solicitation to buy or sell any securities or to adopt any investment strategy. The opinions expressed may change as subsequent conditions vary. Neither of Fidante nor any of its respective related bodies corporate, associates and employees, shall have any liability whatsoever (in negligence or otherwise) for any loss howsoever arising from any use of the material or otherwise in connection with the material. It is intended to provide general information only and is not intended to provide you with financial advice or take into account your objectives, financial situation or needs. Any projections are based on assumptions which we believe are reasonable but are subject to change and should not be relied upon. Past performance is not a reliable indicator of future performance. Fidante, its related bodies corporate, its directors and employees and associates of each may receive remuneration in respect of the financial services provided by Fidante. |


