
NEWS

19 May 2022 - Nestlé: innovation strengthens the moat
|
Nestlé: innovation strengthens the moat Magellan Asset Management April 2022 Vrimp, the vegan alternative to shrimp, is made from peas, seaweed and konjac root, a vegetable found in Asia. The vEGGie, a vegan egg, is a mixture of soy protein and omega-3 fatty acids. Wunda is a pea-based alternative milk. Offered too are the Vuna, a vegan tuna alternative, and vegan burgers, while an experiment is underway to make vegan chicken that comes with fake skin and bones. These products add to the plant-based dairy alternatives for chocolate, coffee, creamers, ice cream and malt beverages. Such are newest offerings of the Swiss-based Nestlé, the world's biggest food and drinks maker, as it responds to the latest twist in consumer demand. The innovation drive extends to the staples that bring in so much of Nestlé's revenue, which reached 87.1 billion Swiss francs in fiscal 2021, a jump of 7.5% on an organic basis from 2020 and the fastest pace in 13 years. Coffee (26% of fiscal 2021 sales) has benefited from the launch of Starbucks at Home, a tie-up with Starbucks and Nespresso, and a revamped approach to producing Nescafe instant coffee. Bean selection is now approached in much the same way as wine makers grade grapes and there's an organic option. Of note is that in 2021 Nestlé scientists discovered two novel plant varietals of the coffee tree that produces Robusta beans. The result is a jump in yields by up to 50%, lower carbon emissions and people can now enjoy a super-premium barista blend in their soluble coffee. And every second of every day, the world enjoys another 5,500 cups of Nescafé, including the premium Nescafé Gold. The pet care staple (18% of sales) has become personalised (animalised?) and much science has gone into producing healthy high-end labels. In many parts of the world at production volumes that achieve economies of scale, Fido can receive a unique blend of dog food and supplements delivered to the home with his name stamped on the front. For house pets so inclined, there's a pet food line where insects and plant protein from fava beans and millet are mixed with meat. Pet carers are considered too. Improved online ordering means people don't have to lug home heavy packets. The KitKat staple, which was revitalised by a marketing campaign in Japan in 2014 that exploited how the Japanese pronunciation of KitKat (kitto katto) resembles the phrase 'you will win' (kitto katsu), now has stand-alone stores. These 'KitKat bars' offer almost countless flavours including a vegan option (KitKat V) and let people devise their own recipes - 'create your break'. Such is the revamp of a company with a history stretching to 1866 since Mark Schneider became CEO in 2017. Key drivers of success under Schneider include a switch into healthier products such as plant-based foods and vitamins and supplements, and a focus on novel products and faster times to market with the latest offerings. Schneider has reinvigorated the company's portfolio of assets by conducting at least 85 divestments and acquisitions over the past five years. Nestlé shares are trading around the record high set in November last year because investors recognise that an overhauled company with great brands is enjoying a virtuous cycle kicked off by digitalisation. The enhanced consumer insights improve innovation, which leads to the creation and successful launch of better products produced at economies of scale that bestow an unassailable competitive advantage on the company. What brands the company has. Nestlé has 31 'mega-brands' including Coffee mate, Haagen-Dazs ice cream, Maggi noodles, Milo, Nescafé, Nesquik, Nespresso, Purina pet care and San Pellegrino mineral water. Each has loyal consumers, which means these products command a premium price and superior access to supermarket shelves. Each generates global sales of more than one billion Swiss francs every year. Nestlé, in all, boasts 2,000-plus brands that are sold in 186 countries and many hold the No. 1 or No. 2 positions in their categories. The brands are split across seven segments. These are in order of fiscal 2021 sales: powdered & liquid beverages (28%), pet care (18%), nutrition & healthcare (15%), prepared dishes & cooking aids (14%), milk products & ice cream (12%), confectionery (9%) and water (5%). Nestlé's great brands mean the company has steady cash flow and earnings streams no matter the state of the economy. As such, the stock has a 'defensive' appeal, which is why it's held up better than most during the share slide so far in 2022. Since Nestlé is well positioned to achieve its sales growth target of 4% to 6% in coming years, the stock is likely to generate superior returns for investors for a long while yet. To be sure, Nestlé products face ferocious competition. Some products (chocolate) are struggling to boost sales. But the success of coffee and pet foods make up for these laggards. The health push exposes the food processor to charges of hypocrisy because many of its goods are unhealthy and cannot easily be made wholesome. But the company is out to reduce that percentage and sales show junk food is popular enough. For all its global reach, Nestlé is overexposed to a downturn in the US, where it sources about 33% of its sales and profits. The company has warned that higher costs for its agricultural ingredients, packaging, energy and shipping threaten margins. Russia's invasion of Ukraine has intensified that challenge, especially that wheat and energy prices are rising. But as a third of sales come from premium products, Nestlé is better placed than most of its peers. A business that has changed so much since two Americans established the Anglo-Swiss Condensed Milk Company 156 years ago (that eventually merged with a company Henri Nestlé founded to sell milk-based baby food one year later) is used to overcoming challenges. If Nestlé can make such a successful start to going vegan and vegetarian (sales of 800 billion Swiss francs in fiscal 2021), what can't it do? Sources: Company filings and website, Bloomberg News and Dunn & Bradstreet. |
|
Funds operated by this manager: Magellan Global Fund (Hedged), Magellan Global Fund (Open Class Units) ASX:MGOC, Magellan High Conviction Fund, Magellan Infrastructure Fund, Magellan Infrastructure Fund (Unhedged), MFG Core Infrastructure Fund Important Information: This material has been delivered to you by Magellan Asset Management Limited ABN 31 120 593 946 AFS Licence No. 304 301 ('Magellan') and has been prepared for general information purposes only and must not be construed as investment advice or as an investment recommendation. This material does not take into account your investment objectives, financial situation or particular needs. This material does not constitute an offer or inducement to engage in an investment activity nor does it form part of any offer documentation, offer or invitation to purchase, sell or subscribe for interests in any type of investment product or service. You should read and consider any relevant offer documentation applicable to any investment product or service and consider obtaining professional investment advice tailored to your specific circumstances before making any investment decision. A copy of the relevant PDS relating to a Magellan financial product or service may be obtained by calling +61 2 9235 4888 or by visiting www.magellangroup.com.au. Past performance is not necessarily indicative of future results and no person guarantees the future performance of any strategy, the amount or timing of any return from it, that asset allocations will be met, that it will be able to be implemented and its investment strategy or that its investment objectives will be achieved. This material may contain 'forward-looking statements'. Actual events or results or the actual performance of a Magellan financial product or service may differ materially from those reflected or contemplated in such forward-looking statements. This material may include data, research and other information from third party sources. Magellan makes no guarantee that such information is accurate, complete or timely and does not provide any warranties regarding results obtained from its use. This information is subject to change at any time and no person has any responsibility to update any of the information provided in this material. Statements contained in this material that are not historical facts are based on current expectations, estimates, projections, opinions and beliefs of Magellan. Such statements involve known and unknown risks, uncertainties and other factors, and undue reliance should not be placed thereon. Any trademarks, logos, and service marks contained herein may be the registered and unregistered trademarks of their respective owners. This material and the information contained within it may not be reproduced, or disclosed, in whole or in part, without the prior written consent of Magellan. |

18 May 2022 - Performance Report: Insync Global Quality Equity Fund
| Report Date | |
| Manager | |
| Fund Name | |
| Strategy | |
| Latest Return Date | |
| Latest Return | |
| Latest 6 Months | |
| Latest 12 Months | |
| Latest 24 Months (pa) | |
| Annualised Since Inception | |
| Inception Date | |
| FUM (millions) | |
| Fund Overview | Insync invests in a concentrated portfolio of high quality companies that possess long 'runways' of future growth benefitting from Megatrends. Megatrends are multiyear structural and disruptive changes that transform the way we live our daily lives and result from a convergence of different underlying trends including innovation, politics, demographics, social attitudes and lifestyles. They provide important tailwinds to individual stocks and sectors, that reside within them. Insync believe this delivers exponential earnings growth ahead of market expectations. Insync screens the universe of 40,000 listed global companies to just 150 that it views as superior. This includes profitability, balance sheet performance, shareholder focus and valuations. 20-40 companies are then chosen for the portfolio. These reflect the best outcomes from further analysis using a proprietary DCF valuation, implied growth modelling, and free cash flow yield; alongside management, competitor, and industry scrutiny. The Fund may hold some cash (maximum of 5%), derivatives, currency contracts for hedging purposes, and American and/or Global Depository Receipts. It is however, for all intents and purposes, a 'long-only' fund, remaining fully invested irrespective of market cycles. |
| Manager Comments | The Insync Global Quality Equity Fund has a track record of 12 years and 7 months and has outperformed the Global Equity Index since inception in October 2009, providing investors with an annualised return of 12.23% compared with the index's return of 10.9% over the same period. On a calendar year basis, the fund has only experienced a negative annual return once in the 12 years and 7 months since its inception. Over the past 12 months, the fund's largest drawdown was -22.17% vs the index's -10.7%, and since inception in October 2009 the fund's largest drawdown was -22.17% vs the index's maximum drawdown over the same period of -13.59%. The fund's maximum drawdown began in January 2022 and has lasted 3 months, reaching its lowest point during April 2022. During this period, the index's maximum drawdown was -10.7%. The Manager has delivered these returns with 1.48% more volatility than the index, contributing to a Sharpe ratio which has fallen below 1 five times over the past five years and which currently sits at 0.86 since inception. The fund has provided positive monthly returns 82% of the time in rising markets and 21% of the time during periods of market decline, contributing to an up-capture ratio since inception of 83% and a down-capture ratio of 85%. |
| More Information |

18 May 2022 - Performance Report: Bennelong Concentrated Australian Equities Fund
| Report Date | |
| Manager | |
| Fund Name | |
| Strategy | |
| Latest Return Date | |
| Latest Return | |
| Latest 6 Months | |
| Latest 12 Months | |
| Latest 24 Months (pa) | |
| Annualised Since Inception | |
| Inception Date | |
| FUM (millions) | |
| Fund Overview | |
| Manager Comments | The Bennelong Concentrated Australian Equities Fund has a track record of 13 years and 3 months and has outperformed the ASX 200 Total Return Index since inception in February 2009, providing investors with an annualised return of 15.07% compared with the index's return of 10.37% over the same period. On a calendar year basis, the fund has experienced a negative annual return on 2 occasions in the 13 years and 3 months since its inception. Over the past 12 months, the fund's largest drawdown was -20.9% vs the index's -6.35%, and since inception in February 2009 the fund's largest drawdown was -24.11% vs the index's maximum drawdown over the same period of -26.75%. The fund's maximum drawdown began in February 2020 and lasted 6 months, reaching its lowest point during March 2020. The fund had completely recovered its losses by August 2020. The Manager has delivered these returns with 1.81% more volatility than the index, contributing to a Sharpe ratio which has fallen below 1 five times over the past five years and which currently sits at 0.86 since inception. The fund has provided positive monthly returns 90% of the time in rising markets and 19% of the time during periods of market decline, contributing to an up-capture ratio since inception of 137% and a down-capture ratio of 94%. |
| More Information |
18 May 2022 - Perception vs Reality: When a good story trumps rationality
|
Perception vs Reality: When a good story trumps rationality Colins St Asset Management April 2022 |
|
|
Despite our best efforts, human nature dictates that in life and in investing we often find ourselves making irrational decisions. That's not to say that those decisions aren't reasonable, but instead that most people prefer to act 'reasonably' rather than rationally.
In the early 1900's a doctor by the name of Julius Wagner-Lauregg began testing the premise that a fever as treatment for certain ailments could dramatically reduce mortality. He tested his theory on patients with neurosyphilis and discovered that his patients (with an induced fever) had twice the survival rate of patients left untreated. Dr Wagner-Lauregg went on to win a Nobel Prize in 1927 for his discovery before Penicillin was discovered and made his treatments redundant. Nonetheless, his research clearly identified the healing properties of a fever, and its usefulness in treating illness. Yet, despite his discovery, and despite the fact that modern medicine recognises the fever's role in the healing process, I know very few people who wouldn't immediately offer their sick child Panadol at the earliest signs of an increased temperature. The challenge is that what we know and how we feel are in direct conflict. We may recognise the benefits of the fever, but at the same time, we can't stand the thought of our child suffering. The same is often the case in investments. Even for those not speculating, for those who know the underlying value of a business, it's no easy feat to watch the value of one's holdings fall (considerably) and not feel the pull of the emotional pain of that loss. The Cost of Loss: Most parents and investors act reasonably in their avoidance of pain and suffering. Reasonably, but not rationally. Rational investment decision making requires one to look past how they feel about an idea, and instead focus on the numbers. However, that is a concept far simpler in principle than in practice. You see, psychological studies have often found that the pain felt from an investment loss is considerably greater than the joy felt by a gain. In fact, that loss:gain coefficient is thought to be as high as 2.5x. Take a moment for yourself as you read this now to consider what your own loss:gain coefficient might be. Consider a coin toss scenario (a 50/50 toss). Now consider a meaningful stake; a potential loss of $250,000 (for some that might be $200, or $2million). How much would you need to be offered to win in order to risk losing that $250,000?
The psychology is very interesting, and within that psychology lies the vast majority of our opportunities as fund managers. Our role is quite simple: recognise those emotional drivers that push investors into irrational decision making, and when the difference between the reasonable and the rational is wide enough, to take advantage. Keeping Things Simple: Even in the face of identifying emotional behaviours in the market it's not enough. At the risk of stretching an analogy, there are plenty of tasty looking fruit on the tree, and common thinking seems to be that investors should focus first on those lowest hanging fruit. We take a different approach. We don't want to pick fruit at all. Why stretch and stress when there are wonderful ideas already lying on the floor. I'd rather pick up a watermelon (investment idea) off the floor than stretch to pick an apple any day of the week. And there are plenty of 'watermelon' ideas available to those looking for them. They aren't necessarily as exciting as the more complex highly prospective ideas, but they are simple, they are profitable, and there is far less chance of falling off a ladder (getting oneself into financial trouble) if you aren't climbing one. "The fewer the steps between an idea and its success the better." That may seem anecdotally obvious, but the numbers describe a very compelling story. Imagine for a moment that we were investing geniuses. So good are we at investing that we could accurately predict outcomes at a rate of 70%. Now by most accounts, a 70% accuracy rating in investing terms would generate extraordinary outcomes. Simply by predicting earnings outcomes would mean that we are right 7 out of 10 times, and no doubt our results would be great. But what if, on top of having to accurately predict earnings, we also needed to predict market growth rates, or margins, or the outcome of a strategy adjustment? Well, if we need to predict two factors accurately to generate a positive investment outcome, our strike rate falls from 70% to (70%x70%) 49%! If we are required to accurately predict three factors to generate a positive outcome, that rate falls all the way down to 34%. The more decisions we need to get right, the lower our strike rate. And from what started off as an enviable and impressive 70% very rapidly deteriorates to getting things wrong more often than getting them right. It's not just unnecessary to invest in complex ideas, it's hubris to think that we as investors have the capacity to know the full impact of each variation and how it may play out in markets. Recognising the importance of keeping things simple truly is the ultimate indication of investing sophistication.
|

18 May 2022 - The forgotten asset class set to outperform in 2022
|
The forgotten asset class set to outperform in 2022 Yarra Capital Management 05 May 2022
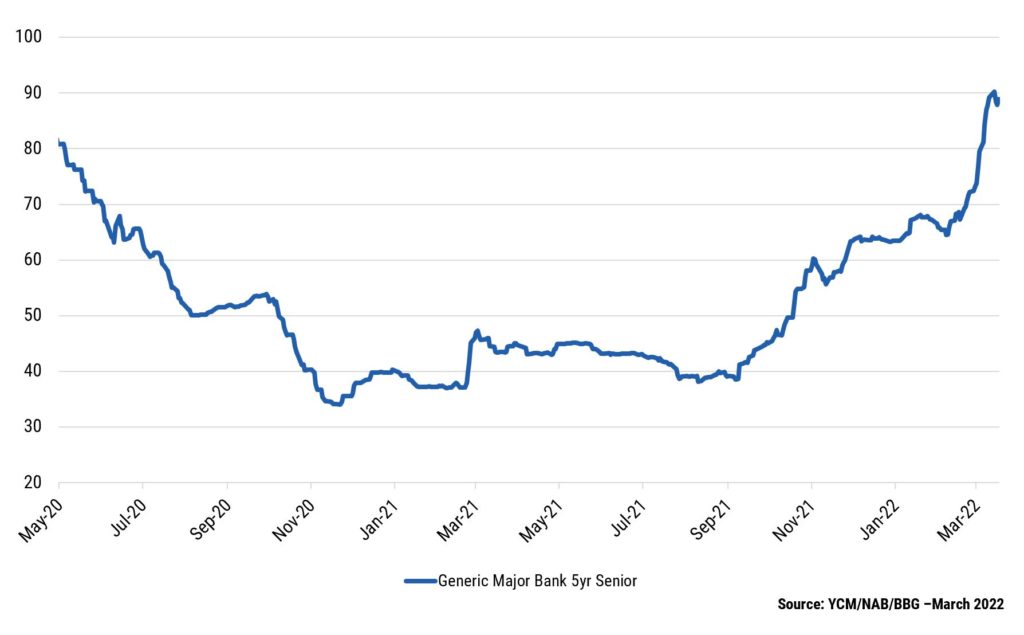
Against a backdrop of economic and geopolitical uncertainty, rising inflation and rate hikes, Australian investors are searching for investments that can benefit from these evolving market conditions. With credit spreads at attractive levels, now might be the opportune time to have exposure to hybrids and credit. With minimal returns on cash continuing to underpin strong demand for hybrid securities, we anticipate demand for yield to remain robust throughout 2022, resulting in strong returns over the year for this asset class. The upside of rising interest ratesRising inflation, above average GDP growth and the unwinding of quantitative easing (QE) in 2022 has seen financial markets reprice interest rate expectations. The rising rate environment will push the outright return on hybrid securities higher, without having a material impact on spreads given the strong economic backdrop. Given most hybrids are floating rate, investors will benefit via higher income from these rising short-term rates. Strong balance sheets you can bank onAustralian banks are the largest issuers of hybrids domestically and their balance sheets are in fantastic shape, with capital ratios at historical high levels. COVID-19 provided Australian banks with access to cheap funding via the Term Funding Facility (TFF), which provided them with a degree of funding certainty and lower funding costs. Following the withdrawal of the TFF in 2021, new bank issuance is coming to market at attractive credit margins, providing the ideal environment for active credit managers to identify the most positive risk adjusted opportunities. For instance, bank senior credit margins are significantly off their TFF lows, which is leading to an attractive re-pricing across all bank capital issuance (refer to Chart 1). Overvalued growth sectors are likely to lead an equity market sell off similar to 2000 - 02, but are unlikely to impact credit market returns. Chart 1: Bank senior credit margins - Well-Off their TFF 2021 lows
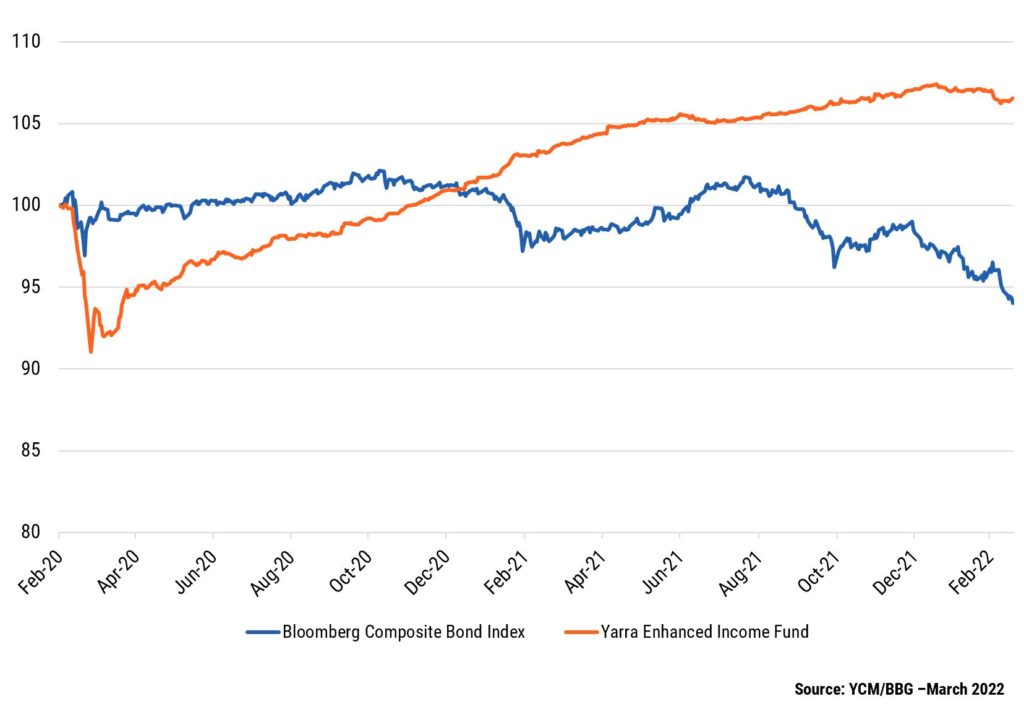
The higher the carry (running yield of an investment), the greater the protection it offers investors from adverse movements in credit margins. The carry for the Yarra Enhanced Income Fund is currently sitting at ~3.0% above cash. Based on an average portfolio maturity of ~3 years, we'd need to see an extreme 1.0% move wider in credit margins to wipe-out the carry. However, given the robust economic backdrop in 2022, we expect credit margins to remain relatively stable throughout, adding to floating rate credit's income generating credentials. This benign outlook is in contrast to the capital losses currently being observed in traditional fixed income due to the reset in interest rates and real yields. Usually, a rise in real yields will impact the value of everything long interest rate duration, from traditional fixed income to most equities. That's not the case with floating rate credit, since its short duration offers protection to portfolio valuations from rising interest rates. This is observable in EIF's outperformance compared to traditional fixed income (Bloomberg Composite Index) since February 2020 (see Chart 2). Chart 2: Floating rate credit with carry continues to outperform fixed rate with little carry
Making the gradeIn a world that seems to be getting riskier by the minute, investment grade hybrids look to be a safe haven for investors. Here's why:
Getting exposure to hybrids and creditBeing able to access fixed rate securities for floating rate portfolios remains a key competitive advantage for Yarra's clients. The Yarra Enhanced Income Fund invests in high yielding, floating rate credit and hybrid securities to deliver better returns than traditional cash management and fixed income investments. |
|
Funds operated by this manager: Yarra Australian Equities Fund, Yarra Emerging Leaders Fund, Yarra Enhanced Income Fund, Yarra Income Plus Fund |


17 May 2022 - Performance Report: Glenmore Australian Equities Fund
| Report Date | |
| Manager | |
| Fund Name | |
| Strategy | |
| Latest Return Date | |
| Latest Return | |
| Latest 6 Months | |
| Latest 12 Months | |
| Latest 24 Months (pa) | |
| Annualised Since Inception | |
| Inception Date | |
| FUM (millions) | |
| Fund Overview | The main driver of identifying potential investments will be bottom up company analysis, however macro-economic conditions will be considered as part of the investment thesis for each stock. |
| Manager Comments | The Glenmore Australian Equities Fund has a track record of 4 years and 11 months and therefore comparison over all market conditions and against its peers is limited. However, the fund has outperformed the ASX 200 Total Return Index since inception in June 2017, providing investors with an annualised return of 25.4% compared with the index's return of 9.58% over the same period. On a calendar year basis, the fund hasn't experienced any negative annual returns in the 4 years and 11 months since its inception. Over the past 12 months, the fund's largest drawdown was -8.65% vs the index's -6.35%, and since inception in June 2017 the fund's largest drawdown was -36.91% vs the index's maximum drawdown over the same period of -26.75%. The fund's maximum drawdown began in October 2019 and lasted 1 year and 1 month, reaching its lowest point during March 2020. The fund had completely recovered its losses by November 2020. The Manager has delivered these returns with 7.18% more volatility than the index, contributing to a Sharpe ratio which has only fallen below 1 once over the past four years and which currently sits at 1.13 since inception. The fund has provided positive monthly returns 90% of the time in rising markets and 42% of the time during periods of market decline, contributing to an up-capture ratio since inception of 232% and a down-capture ratio of 96%. |
| More Information |
17 May 2022 - Performance Report: Insync Global Capital Aware Fund
| Report Date | |
| Manager | |
| Fund Name | |
| Strategy | |
| Latest Return Date | |
| Latest Return | |
| Latest 6 Months | |
| Latest 12 Months | |
| Latest 24 Months (pa) | |
| Annualised Since Inception | |
| Inception Date | |
| FUM (millions) | |
| Fund Overview | Insync invests in a concentrated portfolio of high quality companies that possess long 'runways' of future growth benefitting from Megatrends. Megatrends are multiyear structural and disruptive changes that transform the way we live our daily lives and result from a convergence of different underlying trends including innovation, politics, demographics, social attitudes and lifestyles. They provide important tailwinds to individual stocks and sectors, that reside within them. Insync believe this delivers exponential earnings growth ahead of market expectations. The fund uses Put Options to help buffer the depth and duration that sharp, severe negative market impacts would otherwide have on the value of the fund during these events. Insync screens the universe of 40,000 listed global companies to just 150 that it views as superior. This includes profitability, balance sheet performance, shareholder focus and valuations. 20-40 companies are then chosen for the portfolio. These reflect the best outcomes from further analysis using a proprietary DCF valuation, implied growth modelling, and free cash flow yield; alongside management, competitor, and industry scrutiny. The Fund may hold some cash (maximum of 5%), derivatives, currency contracts for hedging purposes, and American and/or Global Depository Receipts. It is however, for all intents and purposes, a 'long-only' fund, remaining fully invested irrespective of market cycles. |
| Manager Comments | The Insync Global Capital Aware Fund has a track record of 12 years and 7 months and has underperformed the Global Equity Index since inception in October 2009, providing investors with an annualised return of 10.33% compared with the index's return of 10.9% over the same period. On a calendar year basis, the fund has experienced a negative annual return on 2 occasions in the 12 years and 7 months since its inception. Over the past 12 months, the fund's largest drawdown was -22.2% vs the index's -10.7%, and since inception in October 2009 the fund's largest drawdown was -22.2% vs the index's maximum drawdown over the same period of -13.59%. The fund's maximum drawdown began in January 2022 and has lasted 3 months, reaching its lowest point during April 2022. During this period, the index's maximum drawdown was -10.7%. The Manager has delivered these returns with 0.83% more volatility than the index, contributing to a Sharpe ratio which has fallen below 1 five times over the past five years and which currently sits at 0.75 since inception. The fund has provided positive monthly returns 81% of the time in rising markets and 22% of the time during periods of market decline, contributing to an up-capture ratio since inception of 59% and a down-capture ratio of 80%. |
| More Information |
17 May 2022 - Performance Report: Bennelong Australian Equities Fund
| Report Date | |
| Manager | |
| Fund Name | |
| Strategy | |
| Latest Return Date | |
| Latest Return | |
| Latest 6 Months | |
| Latest 12 Months | |
| Latest 24 Months (pa) | |
| Annualised Since Inception | |
| Inception Date | |
| FUM (millions) | |
| Fund Overview | |
| Manager Comments | The Bennelong Australian Equities Fund has a track record of 13 years and 3 months and has outperformed the ASX 200 Total Return Index since inception in February 2009, providing investors with an annualised return of 13.46% compared with the index's return of 10.37% over the same period. On a calendar year basis, the fund has only experienced a negative annual return once in the 13 years and 3 months since its inception. Over the past 12 months, the fund's largest drawdown was -17.91% vs the index's -6.35%, and since inception in February 2009 the fund's largest drawdown was -24.32% vs the index's maximum drawdown over the same period of -26.75%. The fund's maximum drawdown began in February 2020 and lasted 6 months, reaching its lowest point during March 2020. The fund had completely recovered its losses by August 2020. The Manager has delivered these returns with 1.32% more volatility than the index, contributing to a Sharpe ratio which has fallen below 1 four times over the past five years and which currently sits at 0.79 since inception. The fund has provided positive monthly returns 91% of the time in rising markets and 18% of the time during periods of market decline, contributing to an up-capture ratio since inception of 129% and a down-capture ratio of 97%. |
| More Information |
17 May 2022 - What have rubber bands got to do with successful stock selection?
|
What have rubber bands got to do with successful stock selection? Insync Fund Managers April 2022 Lifting of pandemic restrictions has generated an overly enthusiastic view that economically sensitive companies will rebound quickly across many business sectors. Insync deliberately has no exposure to stocks of this ilk. We favour companies that are not only are some of the most profitable companies in the world but are also expected to consistently grow their earnings at high rates regardless of how the global economy performs. As the earnings growth across our portfolio continues to compound at high-rates, the gap grows ever wider between their stock price and their valuations (currently circa 50%+ below valuations). In these shorter periods of relative underperformance, a tension permeates in markets. This creates ideal conditions for entry as a sudden 'snap-back' in stock prices can occur very quickly. Snap backs are triggered by a change in market conditions, an event or simply the market recognizing the big disparities between the companies promising to deliver to the ones actually delivering. We liken it to an elastic band. The more you stretch it (the widening of the gap between valuation and share price), the greater the likelihood of a rapid 'snap-back'. Whilst it's impossible to time exactly when the snap back will occur, when it does do so, it delivers strong outperformance to those stocks with the real underlying earnings and profits to support a sustainable uptick in their price. At the same time, the reverse occurs for those presently leading this latest bout of exuberant price growth. We like value but we are not value Investors. We recently had an extensive meeting with a fund researcher where we took him through our valuation approach. One of his key conclusions was that Insync is a 'value investor'. Whilst we would not describe ourselves as value investors based on conventional metrics (just buying companies based on low Price/Earnings ratios), an important part of Insync's process includes building a high degree of confidence in understanding the worth of a company's future cashflows beyond its present state. To make money involves finding companies where the value we see is significantly greater than the price we have to pay. The current investor exuberance around chasing returns in hyped up sectors has the Insync portfolio of quality growth companies trading at circa 50% below our assessed valuations. A question to ponder is this..... Would you buy into highly profitable businesses if you could buy them at such a large discount? And after doing all your investigations and crunching the numbers, its forward earnings were compounding strongly. Or would you buy a very richly valued popular business whose forward looking numbers don't support its price but everyone was enthusiastic about it today? This is the choice that investors face and this sets up perfect conditions for the Insync portfolio to deliver strong returns. P.S. Insync is of course categorised as a 'Quality Growth' Investor. Traditional valuation metrics are losing their predictive power. PE (Price/Earnings) and PB (Price/Book) ratios have been declining in their ability to predict value. The main reason is in the "E" part of the P/E ratio. Our modern global economy is increasingly driven by intangible assets. Items such as intellectual property, R&D, brands, and networks. In the last decade or so this has accelerated to dominate in many key industries. In the past capital equipment and other tangible assets used to figure large on balance sheets.
'Intangibles' now represent 84% of the market value of the S&P 500 as depicted above. The old focus supported the old P/E and P/B ratios suitability. The problem occurs when it is applied to this new world - to the industries and companies that invest heavily in intangibles. It creates a misleading and distorted picture.
By example, when Pfizer invests R&D in a new drug for Covid-19 (forecasted to generate sales of US$45.7 Bn this year), or Amazon spending on building their cloud capability (sales of US$60 Bn expected from this division), these investments are classified as intangibles. They have to be expensed through their income statements. This means it significantly depresses their earnings today despite these 'investments of expenditure' creating significant sales and profits for many years to follow. Their resulting P/E and P/B ratios are thus negatively impacted. This is important to remember when investing for the future. Beware of using the rear-view mirror. Life has changed. Fastest decline in history. By way of contrast, old-industry companies, say a steel company, has to invest heavily in property and machinery (tangibles). The accounting rules treat these investments as capital expenditures. It immediately goes onto the balance sheet and does not detract from that year's earnings unlike intangibles. Effectively this inflates its present earnings and the book value. P/E and P/B ratios look good.
This inconsistent treatment of the drivers of future growth between intangibles and tangibles leads to wrong conclusions on what actually represents good value and what does not. P/Es are thus not a useful indictor for industries with high intangibles, and even more misleading if taking an average across a broad index. Conventional portfolio blending methods. Many research houses lump funds managers into simplified groupings primarily based on P/E ratios. Growth managers tend to be holding businesses with higher than market average P/E or P/B ratios. Value managers holding a portfolio of low P/E ratios, and GARP or Core managers somewhere in-between. Not only is this old measure being over-used to compare managers in the same group, it is further adapted as the primary means of blending managers across entire client portfolios and investment models. People tend towards simplicity even if its misleading. Given the change in intangible expenditures this is an increasingly unwise approach for professional advice givers. It is also worth noting that P/B and P/E ratios represent two of the three variables used to determine stock inclusion in the widely followed style index, MSCI World Value. The key driver of future earnings - intangibles, is not being appropriately reflected in the income statements and balance sheets in a rapidly changing economy. Accounting rules have not yet adapted. This, we strongly contend, is a key reason for the long-term underperformance of Value indices post the Global Financial Crisis. Intangibles- a key to investing in today's world Even though it is impossible to measure the value of intangibles precisely, it is essential for investment professionals to come up with a logical approach to incorporate intangibles into their decision making; otherwise, they risk being relics in this new age of information. At Insync we have developed a systematic way of incorporating the cashflows that intangibles are delivering into our valuation methodology. This results in a more accurate assessment of the value of a business and a key reason of our successful stock selections. Funds operated by this manager: Insync Global Capital Aware Fund, Insync Global Quality Equity Fund Disclaimer |


16 May 2022 - Performance Report: Cyan C3G Fund
| Report Date | |
| Manager | |
| Fund Name | |
| Strategy | |
| Latest Return Date | |
| Latest Return | |
| Latest 6 Months | |
| Latest 12 Months | |
| Latest 24 Months (pa) | |
| Annualised Since Inception | |
| Inception Date | |
| FUM (millions) | |
| Fund Overview | Cyan C3G Fund is based on the investment philosophy which can be defined as a comprehensive, clear and considered process focused on delivering growth. These are identified through stringent filter criteria and a rigorous research process. The Manager uses a proprietary stock filter in order to eliminate a large proportion of investments due to both internal characteristics (such as gearing levels or cash flow) and external characteristics (such as exposure to commodity prices or customer concentration). Typically, the Fund looks for businesses that are one or more of: a) under researched, b) fundamentally undervalued, c) have a catalyst for re-rating. The Manager seeks to achieve this investment outcome by actively managing a portfolio of Australian listed securities. When the opportunity to invest in suitable securities cannot be found, the manager may reduce the level of equities exposure and accumulate a defensive cash position. Whilst it is the company's intention, there is no guarantee that any distributions or returns will be declared, or that if declared, the amount of any returns will remain constant or increase over time. The Fund does not invest in derivatives and does not use debt to leverage the Fund's performance. However, companies in which the Fund invests may be leveraged. |
| Manager Comments | The Cyan C3G Fund has a track record of 7 years and 9 months and has outperformed the ASX Small Ordinaries Total Return Index since inception in August 2014, providing investors with an annualised return of 11.51% compared with the index's return of 8.31% over the same period. On a calendar year basis, the fund has only experienced a negative annual return once in the 7 years and 9 months since its inception. Over the past 12 months, the fund's largest drawdown was -21.46% vs the index's -9.15%, and since inception in August 2014 the fund's largest drawdown was -36.45% vs the index's maximum drawdown over the same period of -29.12%. The fund's maximum drawdown began in October 2019 and lasted 1 year and 4 months, reaching its lowest point during March 2020. The fund had completely recovered its losses by February 2021. The Manager has delivered these returns with 0.24% more volatility than the index, contributing to a Sharpe ratio which has fallen below 1 five times over the past five years and which currently sits at 0.67 since inception. The fund has provided positive monthly returns 86% of the time in rising markets and 38% of the time during periods of market decline, contributing to an up-capture ratio since inception of 64% and a down-capture ratio of 66%. |
| More Information |