
NEWS

30 Jan 2023 - Performance Report: DS Capital Growth Fund
| Report Date | |
| Manager | |
| Fund Name | |
| Strategy | |
| Latest Return Date | |
| Latest Return | |
| Latest 6 Months | |
| Latest 12 Months | |
| Latest 24 Months (pa) | |
| Annualised Since Inception | |
| Inception Date | |
| FUM (millions) | |
| Fund Overview | The investment team looks for industrial businesses that are simple to understand, generally avoiding large caps, pure mining, biotech and start-ups. They also look for: - Access to management; - Businesses with a competitive edge; - Profitable companies with good margins, organic growth prospects, strong market position and a track record of healthy dividend growth; - Sectors with structural advantage and barriers to entry; - 15% p.a. pre-tax compound return on each holding; and - A history of stable and predictable cash flows that DS Capital can understand and value. |
| Manager Comments | The DS Capital Growth Fund has a track record of 10 years and has outperformed the ASX 200 Total Return benchmark since inception in January 2013, providing investors with an annualised return of 12.13% compared with the benchmark's return of 8.65% over the same period. On a calendar year basis, the fund has experienced a negative annual return on 2 occasions in the 10 years since its inception. Over the past 12 months, the fund's largest drawdown was -15.63% vs the index's -11.9%, and since inception in January 2013 the fund's largest drawdown was -22.53% vs the index's maximum drawdown over the same period of -26.75%. The fund's maximum drawdown began in February 2020 and lasted 6 months, reaching its lowest point during March 2020. The fund had completely recovered its losses by August 2020. The Manager has delivered these returns with 1.69% less volatility than the benchmark, contributing to a Sharpe ratio which has fallen below 1 five times over the past five years and which currently sits at 0.88 since inception. The fund has provided positive monthly returns 88% of the time in rising markets and 32% of the time during periods of market decline, contributing to an up-capture ratio since inception of 63% and a down-capture ratio of 68%. |
| More Information |

30 Jan 2023 - Equities 2023 - What's the bigger risk?
|
Equities 2023 - What's the bigger risk? Insync Fund Managers January 2023 Insync Funds Management CEO, Monik Kotecha, says there's no denying that 2022 was a difficult year for equities - but as one US commentator recently pointed out, years in which the S&P was down more than 18%, as it was in 2022, have been followed by years of 20% plus returns, every single time for the past 90 years. This, plus a few other key factors identified by Insync suggest that standing on the sidelines may pose a bigger risk than investing. Equities 2023 - What's the bigger risk? As we enter 2023, Insync Funds Management CEO, Monik Kotecha says standing on the sidelines may pose a bigger risk than investing. Everybody, and their mother, brother, sister, cousin, and uncle, is negative on the first half of 2023. Wealth destruction was the dominant theme of 2022. The global equity market shrank US$15 trillion in market capitalization, while global bond markets saw US$30 trillion in value wiped out. Virtually every asset class declined. Oil held up better, rising strongly in the first half but correcting as global growth expectations faltered, ending the year flat. The US dollar was the big winner, which rose 9% year-to-date. Cash, which was considered 'trash', gained 1.8%. High inflation, slowing growth and monetary tightening largely characterized the global economy throughout 2022. Rising inflation and slowing growth created stagflation concerns. But we think the market may surprise on the upside in 2023. The impact of 2022 There's no denying that 2022 was a difficult year for equities - but as US senior investment analyst, Luke Lango, from InvestorPlace recently pointed out, years in which the S&P was down more than 18%, as it was in 2022, have been followed by years of 20% plus returns, every single time for the past 90 years.
The sentiment at year-end was very negative, which is a good contrarian indicator. Typically, the average forecast from Wall Street's top strategists predicts the S&P 500 climbing by about 10%, which is in line with historical averages. This time around, the pros are unusually cautious, with most expecting the S&P to end 2023 lower. A Bank of America fund manager survey shows fund managers relative positioning of stocks versus bonds is the lowest level since 2009. Fund managers also hold the highest level of cash (5.9%) since the bursting of the technology bubble in 2000/01. The consensus view is that earnings have further to fall in 2023 and this remains a top investor concern. The market (buyside) tends to look out 6-12 months ahead of sell side analysts, and anticipates any earnings decline in advance of it actually happening. Earnings have historically bottomed after stocks bottomed. Since 1950, the trough in earnings growth lagged the bottom in the S&P 500 by about 6-7 months. Stock prices tend to inflect upwards before we see improvements in earnings, GDP, and employment. October 2022 may well have marked the lows in stock prices which has already discounted the fall in earnings ahead of sell side analysts. Looking ahead As we enter 2023, we think standing on the sidelines may pose a bigger risk than investing. Here's why. The US midterm elections The US midterm elections were held in November 2022. Historically, the S&P500 has outperformed the market in the 12-month period after a US midterm election with an average return of 16.3%, and not delivered a negative return during this period over the past 60 years. Inflation may still prove to be transitory Many argue that inflation will be much stickier than markets currently discount, and that it will take multiple years to restore price stability (2% inflation). However, we continue to believe that the outbreak of inflation is squarely the result of the pandemic shock. As the pandemic-related economic dislocation renormalizes and the Federal Reserve continues to tighten monetary policy, inflation may well eventually fall back to pre-pandemic norms. An area of additional concern, as a result of the pandemic, has been the reduction in the labour market participation rate. This has the potential to drive sustained increase in wages inflation and lower levels of productivity. We are today living in the golden age of technology and innovation which we continue to consider to be deflationary for two primary reasons: 1. Technology reduces the demand for labour, which puts downward pressure on wages and employment levels, which in turn reduces demand for goods and services because workers have less money to spend 2. Technological innovation also leads to automation, tools that make workers more efficient, and the elimination of some job roles So where are the opportunities? We have found that the long-term cash flows and valuation of companies exposed to megatrends do not change as a result of an increase in interest rates, or a slowdown in the global economy. Megatrends are unstoppable long-term growth trends with profitable industry structures. Here's just one example. The 60+ age cohort is set to more than double to 2.1 billion by 2050. This is what we call a demographics megatrend. The fastest ageing group within this cohort is those aged 70-75 and this is where we have identified prime investing opportunities. As the population ages, so does the incidence of chronic disease. Older people also often suffer from multiple chronic conditions at the same time. The second leading cause of death within those aged 70-75, after heart disease, is cancer. The demand for companies providing cancer drugs is not reduced by changes in interest rates, inflation, or recession. These factors also do not change the trajectory of ageing populations, nor the increasing demand for solutions for chronic diseases. Current volatile market conditions provide opportunities to invest in highly profitable businesses benefitting from megatrends at lower prices. Funds operated by this manager: Insync Global Capital Aware Fund, Insync Global Quality Equity Fund Disclaimer |


27 Jan 2023 - Hedge Clippings |27 January 2023
|
|
|
|
Hedge Clippings | Friday, 27 January 2023 In case you're still basking on the beach (or wherever) in blissful ignorance, Australia's December quarter inflation figure came in higher than expectations at 7.8%. Of course, if you ARE still away, you may also not be spending your Friday afternoon reading Hedge Clippings, but either way, it seems like RBA Governor Philip Lowe's New Year is going to start off being as difficult as his old one, although he'll no doubt be considerably more careful with his longer term forecasts than last year. The bottom line is that we suspect inflation is likely to stay stronger for longer, disappointing the optimists who were expecting it to peak early in the new year under the influence of last year's sharp rate rises. Thus, given the RBA's, and their offshore colleagues' previous perilous prognostications (try saying that quickly after a glass or three of Friday's lunchtime vino) that inflation can't and must not be allowed to become entrenched, there's going to be more pain in the form of rate rises, most likely when the RBA board gets together for the first time next Tuesday week. Early reports suggest some leading bank economists are predicting only one more rate rise, but the futures market is indicating at least two more, with no easing in sight until 2024 at least. So with the RBA's official rate currently sitting at 3.1%, and a 100% market probability of another 0.25% in February, we could see rates at 3.8% sometime in the June quarter. The consecutive rate increases totaling 3% in 2022 were the sharpest/fastest in most memories, so another 50 to 75 bps will put the icing even on that. The problem is that consumer spending hasn't changed significantly to have had an impact on inflation, and as yet, whilst there's obviously some stress in the housing market and in mortgage land, the flow-on effects that Philip Lowe is looking for haven't occurred. Of particular worry will be the fact that whilst last year's inflationary spike was primarily imported, unavoidable, or externally generated, (floods, oil, supply chain, Ukraine etc) there's the risk that home-grown inflation from wages pressure in a tight post-COVID labour market takes over. The theme of many of last year's editions of "Hedge Clippings" was interest rates and inflation, so it looks as if this year's shaping up the same way. Ditto Ukraine, which sadly doesn't look like ending quickly. Meanwhile, it does (hopefully) seem that the focus on the hard done by, but over-privileged whinger from Montecito has faded, although possibly only until his next issue - likely to be not getting a front row seat at the Coronation. Next week we'll publish the Australian Fund Monitors Review of fund and sector performances for 2022. In the meantime, we can recommend the four part documentary series on Bernie Madoff currently showing on Netflix. Or if you want something less serious, but no less enjoyable, try "Slow Horses" on Apple TV. Both are variously both more educational or entertaining than the six part Netflix saga of Harry and Meghan. That's it - the last time we mention them. (Promise). |
|
|
News & Insights Outlook Snapshot | Cyan Investment Management 10k Words | Equitable Investors December 2022 Performance News Insync Global Capital Aware Fund Bennelong Australian Equities Fund Bennelong Concentrated Australian Equities Fund Skerryvore Global Emerging Markets All-Cap Equity Fund |
|
|
If you'd like to receive Hedge Clippings direct to your inbox each Friday
|

27 Jan 2023 - Performance Report: Argonaut Natural Resources Fund
| Report Date | |
| Manager | |
| Fund Name | |
| Strategy | |
| Latest Return Date | |
| Latest Return | |
| Latest 6 Months | |
| Latest 12 Months | |
| Latest 24 Months (pa) | |
| Annualised Since Inception | |
| Inception Date | |
| FUM (millions) | |
| Fund Overview | Argonaut Natural Resources Fund ('ANRF') is an actively managed wholesale fund investing in listed resource and mining service companies. ANRF seeks to create a diversified portfolio of investments which will generate absolute returns in excess of the S&P ASX 300 Resources Index. The Fund typically holds between 10 and 25 separate equity investments. Its portfolio is built around a rigorous investment process that assesses Market conditions and Macro economic influences, then conducts detailed Micro stock specific analysis. At times, ANRF may consider holding higher levels of cash (max 30%) if valuations are full and it is difficult to find attractive investment opportunities. The Fund does not borrow for investment or any other purposes, but it may short sell securities as part of its portfolio protection strategies. |
| Manager Comments | The Argonaut Natural Resources Fund has a track record of 3 years and therefore comparison over all market conditions and against its peers is limited. However, the fund has outperformed the ASX 200 Total Return benchmark since inception in January 2020, providing investors with an annualised return of 42.35% compared with the benchmark's return of 5.55% over the same period. On a calendar year basis, the fund hasn't experienced any negative annual returns in the 3 years since its inception. Over the past 12 months, the fund's largest drawdown was -19.06% vs the index's -11.9%, and since inception in January 2020 the fund's largest drawdown was -19.06% vs the index's maximum drawdown over the same period of -26.75%. The fund's maximum drawdown began in April 2022 and lasted 7 months, reaching its lowest point during June 2022. The fund had completely recovered its losses by November 2022. During this period, the index's maximum drawdown was -11.9%. The Manager has delivered these returns with 3.51% more volatility than the benchmark, contributing to a Sharpe ratio which has only fallen below 1 once over the past three years and which currently sits at 1.66 since inception. The fund has provided positive monthly returns 83% of the time in rising markets and 33% of the time during periods of market decline, contributing to an up-capture ratio since inception of 200% and a down-capture ratio of 39%. |
| More Information |

27 Jan 2023 - Performance Report: Bennelong Emerging Companies Fund
[Current Manager Report if available]

27 Jan 2023 - The net-zero journey: creating a just transition for workers
|
The net-zero journey: creating a just transition for workers abrdn December 2022 A 'just transition' refers to the way the world transitions to low-carbon energy sources. It is a crucial part of the climate agenda. A just transition aims to minimise adverse impacts from the energy transition and to see everyone share its benefits - including workers, suppliers, communities and consumers. The journey to net zero will have uneven effects across industries and countries. One key aim of a just transition is to support vulnerable workers by creating green, high-quality jobs and helping equip workers with the skills necessary for achieving net zero. Net job impactsThe prevailing view is that the transition to a net-zero economy would lead to more job gains than job losses. According to McKinsey's calculation based on a net-zero 2050 scenario, the transition could create around 200 million jobs and displace around 185 million jobs. This could result in a net impact of around 15 million more jobs by 2050.1 These job gains include around 162 million jobs in operations and maintenance across different sectors of the economy, and around 41 million jobs associated with spending on physical assets needed for the net-zero transition by 2050. The International Labour Organisation (ILO) paints an even more positive picture, estimating that a net increase of 18 million jobs by 2030 is possible.2 What sectors and countries will be most affected?According to the ILO, most of the job creation that results from the energy transition will happen in construction, electrical machinery manufacturing, copper mining, renewable energy production, and biomass crop cultivation. Most of the job losses will occur in petroleum extraction and refinery, coal mining, and thermal coal. In addition, the shift to electric vehicles will require fewer workers for production, leading to net job losses - something that is already happening within the sector. The impact on jobs also varies by country, depending on its economic exposure to the net-zero transition. The transition would unevenly affect lower-income and fossil-fuel-producing countries, such as Pakistan, India, Bangladesh, Kenya, Nigeria and Indonesia. How companies manage the impacts of the transition on their workforce will pose considerable investment risks and opportunities for investors These tend to be countries with a relatively higher proportion of jobs, gross domestic product and capital stock in sectors that are more exposed to the transition - that is, sectors with emission-intensive operations, products and supply chains. Significant fossil-fuel resource production also creates high exposure for some countries, such as Qatar, Russia and Saudi Arabia. Investment implicationsHow companies manage the impacts of the transition on their workforce will pose considerable investment risks and opportunities for investors. There are two types of risks facing companies within the sectors that are most exposed to the energy transition: restructuring risks and human-capital risks. Firstly, when it comes to restructuring risks, the most obvious of these is operational disruption caused by mass redundancies. This can lead to costly pay-outs and challenging labour relations. Research shows that the top performers with higher restructuring management practices tend to be concentrated in Europe. This is also the case for companies within the fossil-fuel and emission-intensive sectors, which indicates that European companies are relatively more prepared for a just transition. Secondly, human-capital risks mainly manifest as skills mismatches and shortages, which can impede a company's progress on the green transition. According to the International Energy Agency (IEA), the energy sector already faces difficulty hiring qualified talent to keep pace with the growth in clean energy. If solar and wind installations reach four times today's annual level by 2030, as called for in the IEA's net-zero scenario, these labour constraints could impede the world's ability to accelerate the shift to a low-carbon future.3 According to the ILO's survey, while most countries have environmental policies, there are only a handful of countries with corresponding policies at either the national or the regional level for skills development. These are Denmark, Estonia, France, Germany, the UK, the US, China, India, South Korea, the Philippines and South Africa. Similarly, few countries have incorporated skills for the green transition into the formal vocational training curriculum.4 Companies also have an important role to play in identifying and anticipating skills, and in providing access to jobs and training for the green transition. In practice, this can be done in partnership with the government and educational organisations. Investors need to understand how these risks are being managed. For example, through our own extensive engagement with auto makers, we have learned that the industry is managing these risks through early retirement schemes, upskilling of the existing workforce, and proactive engagement with trade unions. In general, to understand how companies are managing these risks, investors can focus on four key indicators:
ConclusionThe energy transition will have a significant impact on employment. It will lead to the creation and displacement of millions of jobs. While the overall net impact is likely to be positive, the projected job gains will concentrate in sectors like renewable energy, electrical machinery and construction. From a geographical perspective, a higher level of disruption to the labour market is expected in developing countries that rely heavily on fossil-fuel and emission-intensive sectors. How companies and governments manage these impacts will present risks and opportunities for investors. Our ongoing research and engagement aim to understand the social impacts and potential risks to our investments from the energy transition. Our research in this area is expected to expand and grow in the future, in conjunction with our ongoing climate change, human rights, and labour and employment work. For example, building on our focus on workers in the energy transition, we will also consider the perspectives of communities and consumers, in order to integrate further insights into our investment process. Author: Ziggy You, Sustainability Analyst and Elizabeth Chiwashenga, Senior Sustainability Analyst |
|
Funds operated by this manager: Aberdeen Standard Actively Hedged International Equities Fund, Aberdeen Standard Asian Opportunities Fund, Aberdeen Standard Australian Small Companies Fund, Aberdeen Standard Emerging Opportunities Fund, Aberdeen Standard Ex-20 Australian Equities Fund (Class A), Aberdeen Standard Focused Sustainable Australian Equity Fund, Aberdeen Standard Fully Hedged International Equities Fund, Aberdeen Standard Global Absolute Return Strategies Fund, Aberdeen Standard Global Corporate Bond Fund, Aberdeen Standard International Equity Fund , Aberdeen Standard Life Absolute Return Global Bond Strategies Fund, Aberdeen Standard Multi Asset Real Return Fund, Aberdeen Standard Multi-Asset Income Fund 1. The net-zero transition: Its cost and benefits | Sustainability | McKinsey & Company |

25 Jan 2023 - Performance Report: Skerryvore Global Emerging Markets All-Cap Equity Fund
| Report Date | |
| Manager | |
| Fund Name | |
| Strategy | |
| Latest Return Date | |
| Latest Return | |
| Latest 6 Months | |
| Latest 12 Months | |
| Latest 24 Months (pa) | |
| Annualised Since Inception | |
| Inception Date | |
| FUM (millions) | |
| Fund Overview | The strategy is index unaware and is based on a focus on the quality of the businesses in which the Fund invests. The Skerryvore investment team select individual stocks based on their merit and without reference to the composition of the Benchmark. The Manager's country and sector allocations reflect the active bottom up investment approach of the Skerryvore team. The Fund also invests in companies that are incorporated and listed in developed market countries which have economic exposure to emerging markets. The difference in allocation against any emerging markets index can be significant. |
| Manager Comments | The Skerryvore Global Emerging Markets All-Cap Equity Fund has a track record of 1 year and 5 months and therefore comparison over all market conditions and against its peers is limited. However, the fund has outperformed the MSCI Emerging Markets (MMEF) AUD benchmark since inception in August 2021, providing investors with an annualised return of -5.45% compared with the benchmark's return of -6.47% over the same period. Over the past 12 months, the fund's largest drawdown was -13.9% vs the index's -20.81%, and since inception in August 2021 the fund's largest drawdown was -17.45% vs the index's maximum drawdown over the same period of -21.92%. The fund's maximum drawdown began in September 2021 and has so far lasted 1 year and 3 months, reaching its lowest point during June 2022. The Manager has delivered these returns with 2.92% less volatility than the benchmark, contributing to a Sharpe ratio for performance over the past 12 months of -0.68 and for performance since inception of -0.58. The fund has provided positive monthly returns 86% of the time in rising markets and 30% of the time during periods of market decline, contributing to an up-capture ratio since inception of 56% and a down-capture ratio of 70%. |
| More Information |

25 Jan 2023 - Performance Report: Cyan C3G Fund
| Report Date | |
| Manager | |
| Fund Name | |
| Strategy | |
| Latest Return Date | |
| Latest Return | |
| Latest 6 Months | |
| Latest 12 Months | |
| Latest 24 Months (pa) | |
| Annualised Since Inception | |
| Inception Date | |
| FUM (millions) | |
| Fund Overview | Cyan C3G Fund is based on the investment philosophy which can be defined as a comprehensive, clear and considered process focused on delivering growth. These are identified through stringent filter criteria and a rigorous research process. The Manager uses a proprietary stock filter in order to eliminate a large proportion of investments due to both internal characteristics (such as gearing levels or cash flow) and external characteristics (such as exposure to commodity prices or customer concentration). Typically, the Fund looks for businesses that fit one or more of the following criteria: a) under researched, b) fundamentally undervalued, c) have a catalyst for re-rating. The Manager seeks to achieve this investment outcome by actively managing a portfolio of Australian listed securities. When the opportunity to invest in suitable securities cannot be found, the manager may reduce the level of equities exposure and accumulate a defensive cash position. Whilst it is the company's intention, there is no guarantee that any distributions or returns will be declared, or that if declared, the amount of any returns will remain constant or increase over time. The Fund does not invest in derivatives and does not use debt to leverage performance. However, companies in which the Fund invests may be leveraged. |
| Manager Comments | The Cyan C3G Fund has a track record of 8 years and 5 months and has outperformed the ASX Small Ordinaries Total Return benchmark since inception in August 2014, providing investors with an annualised return of 6.09% compared with the benchmark's return of 5.79% over the same period. On a calendar year basis, the fund has experienced a negative annual return on 2 occasions in the 8 years and 5 months since its inception. Over the past 12 months, the fund's largest drawdown was -37.97% vs the index's -20.77%, and since inception in August 2014 the fund's largest drawdown was -45.18% vs the index's maximum drawdown over the same period of -29.12%. The fund's maximum drawdown began in November 2021 and has so far lasted 1 year and 1 month, reaching its lowest point during September 2022. During this period, the index's maximum drawdown was -24.24%. The Manager has delivered these returns with 0.84% more volatility than the benchmark, contributing to a Sharpe ratio which has fallen below 1 five times over the past five years and which currently sits at 0.35 since inception. The fund has provided positive monthly returns 83% of the time in rising markets and 34% of the time during periods of market decline, contributing to an up-capture ratio since inception of 54% and a down-capture ratio of 82%. |
| More Information |

25 Jan 2023 - Cashflow pothole in energy transition journey
|
Cashflow pothole in energy transition journey Yarra Capital Management December 2022
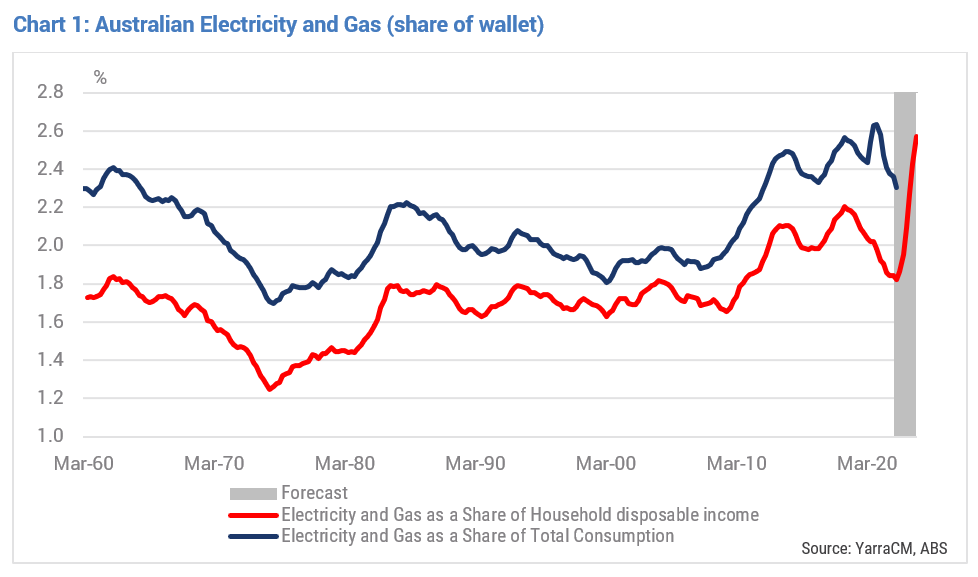
By now, people whose eyes don't immediately glaze over once discussions of personal or national budget are broached are well aware of an upcoming spike in their electricity and gas bills. However, for the majority of the Australian citizenry the 'sticker shock' from the increase in utility bills will still be felt in real time. Tim Toohey, Head of Macro and Strategy, details why for many Australians this will merely compound an already dire cashflow situation. For context, the Australian Treasury has assumed that electricity prices will rise 20% (y/y) by late 2022 and a further 30% in 2022-23. This will take utilities to an unprecedented share of wallet in 2023, some 2.6% of household income by Dec 2023 (refer Chart 1). While that may not sound like a particularly scary figure, it's 25% above the 10-year average and 49% above the long run average dating back to 1960. It will also represent the biggest one year rise in utility bills in the post-War period. The cause for the spike has been well documented. A surge in global coal and energy prices in reflex to the invasion of the Ukraine was the dominate force, some unfortunate timing of coal-fired power station maintenance and some less than transparent behaviour by market participants all played a role. Yet the cause of the trend rise in utility costs is less well understood at the household level; the rapid transition to renewables is unravelling the economics of running coal and gas-fired generation at an even more rapid rate.
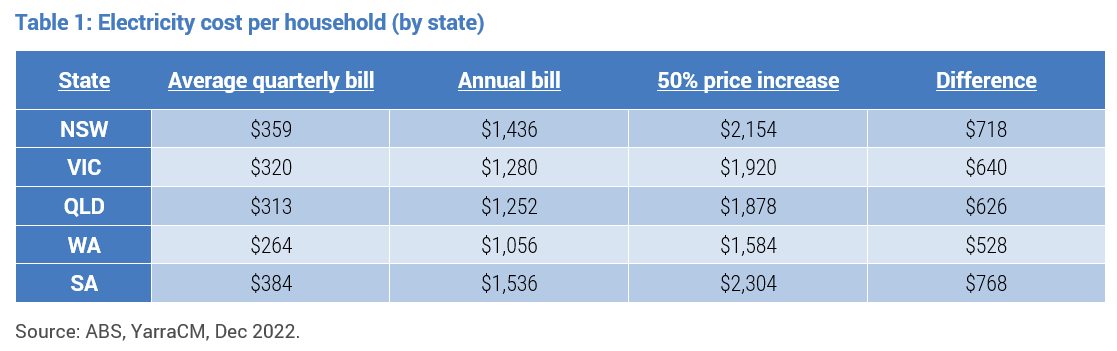
This is not to say that decarbonising the grid in an expeditious manner is not necessary or desirable. It merely means that the cost of the transition will be felt well beyond well-heeled investors asked to dig deep into their pockets to finance the capital cost of the transition. Indeed, it is the consumer that will invariably be forced to pay for the potholes in the road to decarbonisation as firms seek to recover the cashflow hit from declining economics of traditional generation via higher power bills. Utility companies know this. Politicians should know this. Households largely have no idea that they are ultimately on the hook if best intentions of a smooth energy transition turn to custard somewhere along the journey. To overwork the analogy, we have barely gotten the car out of the driveway with a long journey ahead to a known destination but without a clear map of how to get there. We don't have enough cash in our wallet to complete the journey, some of the roads have not yet been built, and the kids who have been fighting politically for years before getting in the car are continuing to do battle in the backseat. For those of us scarred from family car trip holidays at this time of year, we are collectively at the point where optimism and excitement at the start of a trip are about to be overwhelmed by the reality of a long-haul car trip in the Australian heat. The feeling of sizzling hot car seats, the taste of Aerogard inadvertently sprayed into a protesting mouth and the injustice as youthful back seat rebellion is brutally supressed by the front seat elites. Yes, it's going to be a long and painful journey. But to get a sense of who will bear more of the cost, we can look at the average quarterly electricity bill across different dimensions.
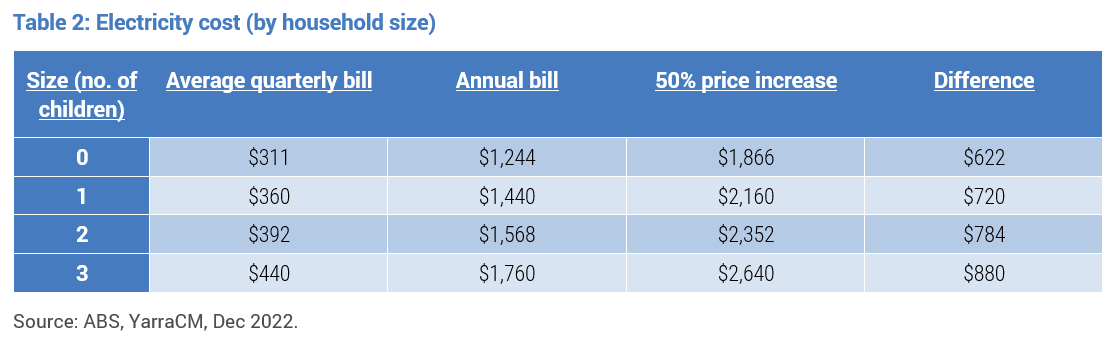
By household size (refer Table 2), the more children you have the greater the power bill increase (and the more time the parent spends wandering around the house turning off lights left on by their children).
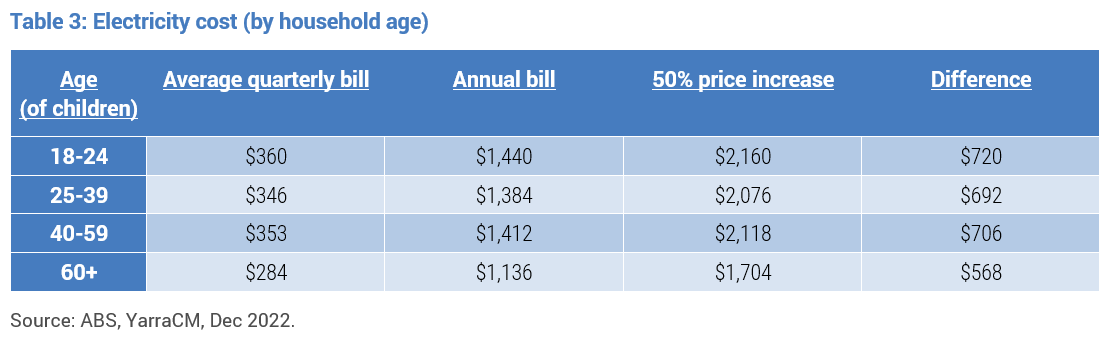
By age, it's the young that will feel the pain more acutely (refer Table 3). Indeed, Gen Z (18-24yo) power bills will swamp the bills of Baby boomers (60+) by $150 p.a. Yes, despite the moral superiority of youth, it seems it takes more power to fuel video gaming sessions in the wee hours and to charge the armoury of devices required to keep your social media presence tip top!
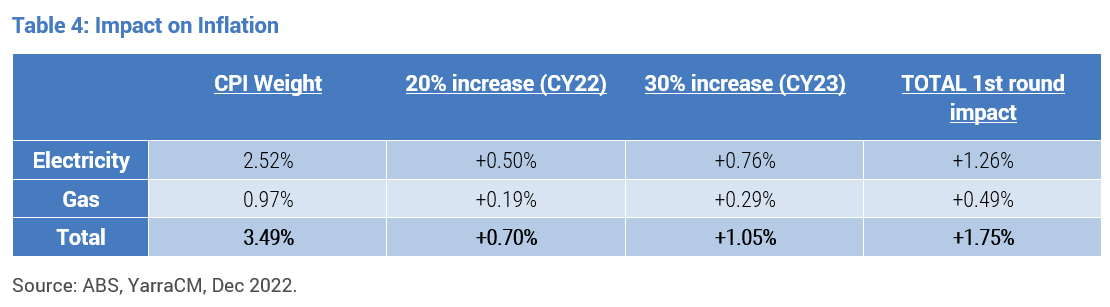
From the perspective of a top-down economist, the addition increment to inflation from rising power and gas bills could add 1.75% to inflation by the end of 2023 in first round impacts and potentially a further 0.35% in second round effects (Refer Table 4). That's a lot, but that's an average estimate. From the perspective of young households with multiple children living in the Eastern States, the impact will be larger and more painful.
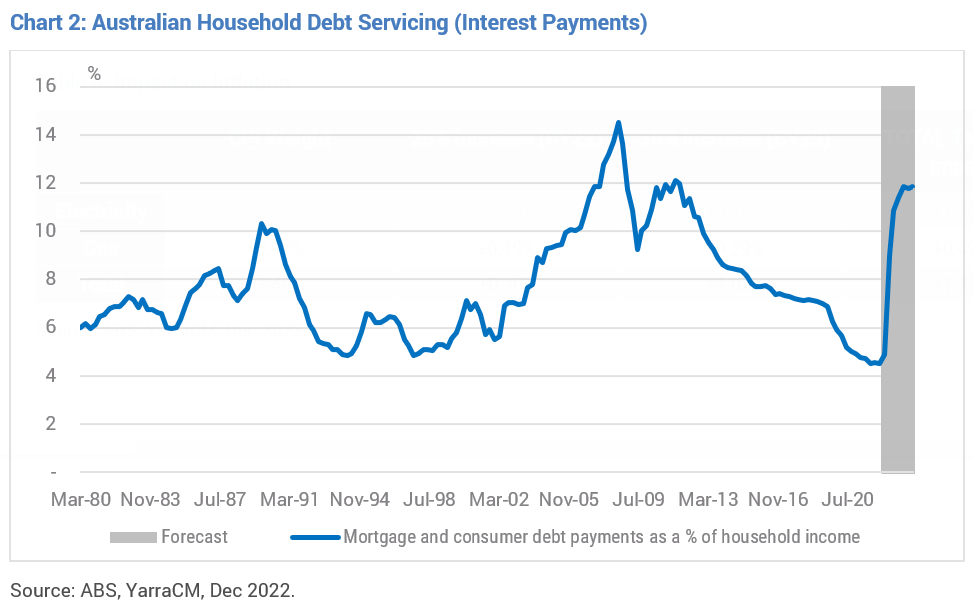
Worst still, this is the slice of the population that are most at risk of rising education, health, insurance and housing costs. We all know that the interest payments on the stock of existing total household debt are set to rise incredibly sharply in 2023, compounded by the roll off of fixed rate mortgages (refer Chart 2).
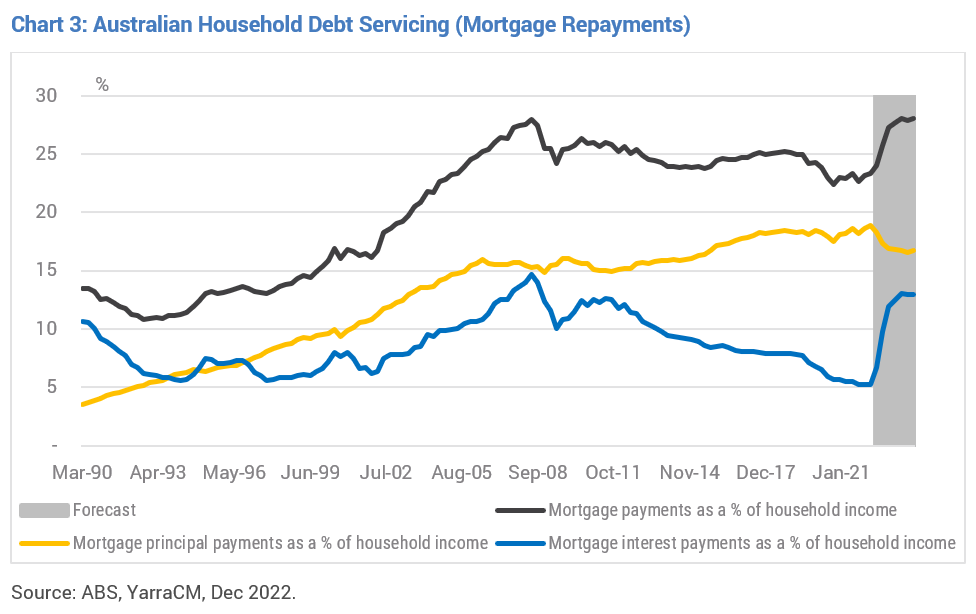
In conjunction with principal payments, debt servicing for the average household is set to breach the prior record during 2023 (refer Chart 3). Again, this is for the average household. The situation for young mortgaged households is far more dire, not to mention a rising proportion of the recent new homeowners who are now entering negative equity scenarios for their homes.
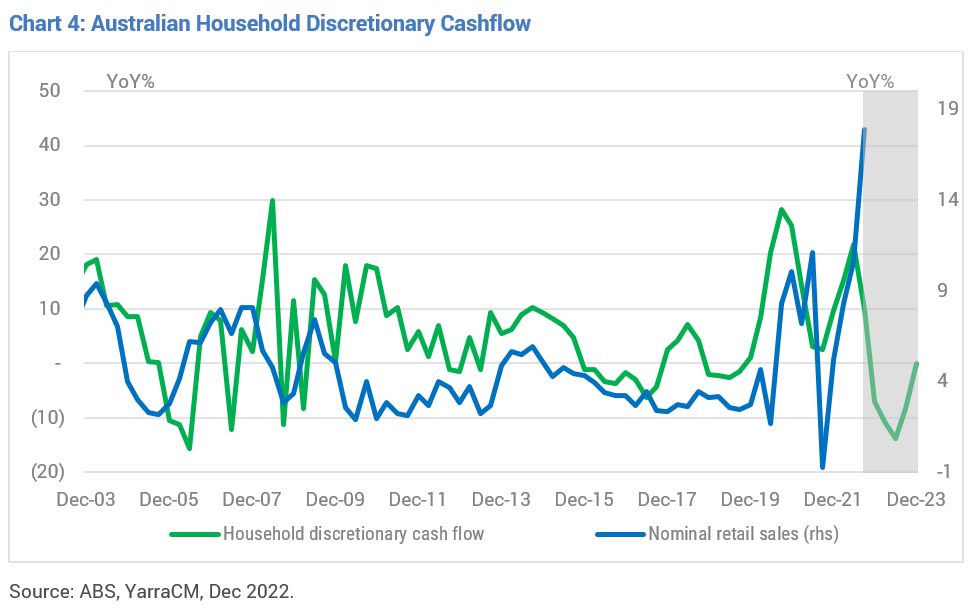
This will place an enormous impost on a large section of society. Nobody likes having their discretionary income squeezed and nobody likes an unexpected spike in their gearing ratio via falling asset prices. Even if we assume the ongoing robust growth in wages and employment in 2023 the impost of higher interest costs, utility costs, insurance costs and rents will be sufficient to see average discretionary cashflow fall by 15% by mid-2023 (refer Chart 4), and much more for young households with large families and large mortgages.
Given, retail sales growth normally closely tracks our measure of discretionary cashflow, we expect that retail sales will slow from the rapid rate of close to 20%(y/y) to zero growth by mid-2023. Note, this is likely the best-case scenario. It could easily be worse if sub-trend economic growth reveals labour market weakness with a lag, as observable in all prior downturns. The argument that Australians have accumulated 'buffers' via $260bn in 'excess savings' since the pandemic and via pre-payments on mortgages will exceed additional interest payments - for most borrowers at least - is illusionary. While this might be true in an accounting sense, the RBA is likely asking itself the wrong question. It is not a question of how big a 'buffer' is before tightening policy will hurt, it is why did households accumulate such a buffer in the first place? And is the economic outlook improving or deteriorating? Excess fiscal stimulus obviously contributed to the initial saving spike, but what if the ongoing accumulation of savings was more about de-risking asset exposure in an uncertain time or because a large cohort of the population is simultaneously entering retirement (COVID may have expedited this decision for many Baby Boomers). If this is the case, then the 'excess saving' is not suggestive that a consumption boom lies ahead that threatens future inflation. Quite the opposite: in times of rising economic uncertainty households tend to initially lift their saving rate. They do not decrease it. There has been ongoing debate whether the government has a role to play in capping utility costs. And, if so, whether that should be at the company level or the consumer level. Given the recent history of firms profiteering through the crisis by lifting prices rather than absorbing margin pressure and the impending cashflow hit for households, the answer should be obvious. More importantly, if the government wants to keep everyone in the car playing nicely during the initial phase of the energy transition, then the answer is very much yes: utility costs need to be controlled. Let's just hope that there are enough fiscal resources and goodwill to get us to that new energy destination as quickly and efficiently as possible. Author: Tim Toohey, Head of Macro and Strategy |
|
Funds operated by this manager: Yarra Australian Equities Fund, Yarra Emerging Leaders Fund, Yarra Enhanced Income Fund, Yarra Income Plus Fund |


24 Jan 2023 - Performance Report: L1 Capital Long Short Fund (Monthly Class)
| Report Date | |
| Manager | |
| Fund Name | |
| Strategy | |
| Latest Return Date | |
| Latest Return | |
| Latest 6 Months | |
| Latest 12 Months | |
| Latest 24 Months (pa) | |
| Annualised Since Inception | |
| Inception Date | |
| FUM (millions) | |
| Fund Overview | |
| Manager Comments | The L1 Capital Long Short Fund (Monthly Class) has a track record of 8 years and 4 months and has outperformed the ASX 200 Total Return benchmark since inception in September 2014, providing investors with an annualised return of 21% compared with the benchmark's return of 7.04% over the same period. On a calendar year basis, the fund has only experienced a negative annual return once in the 8 years and 4 months since its inception. Over the past 12 months, the fund's largest drawdown was -19.5% vs the index's -11.9%, and since inception in September 2014 the fund's largest drawdown was -39.11% vs the index's maximum drawdown over the same period of -26.75%. The fund's maximum drawdown began in February 2018 and lasted 2 years and 9 months, reaching its lowest point during March 2020. The fund had completely recovered its losses by November 2020. The Manager has delivered these returns with 6.39% more volatility than the benchmark, contributing to a Sharpe ratio which has fallen below 1 four times over the past five years and which currently sits at 0.96 since inception. The fund has provided positive monthly returns 79% of the time in rising markets and 63% of the time during periods of market decline, contributing to an up-capture ratio since inception of 88% and a down-capture ratio of 22%. |
| More Information |