NEWS

18 Jul 2024 - Interrogating the bull case for housing
|
Interrogating the bull case for housing Challenger Investment Management June 2024 Over the past few months, we've been puzzled by the strength of the bullish tone around house prices. Puzzled because the argument supporting house prices seems to be hanging on the lack of supply/strong migration creating a supply demand imbalance. Most other factors seem to be flashing warning signals. Consider:
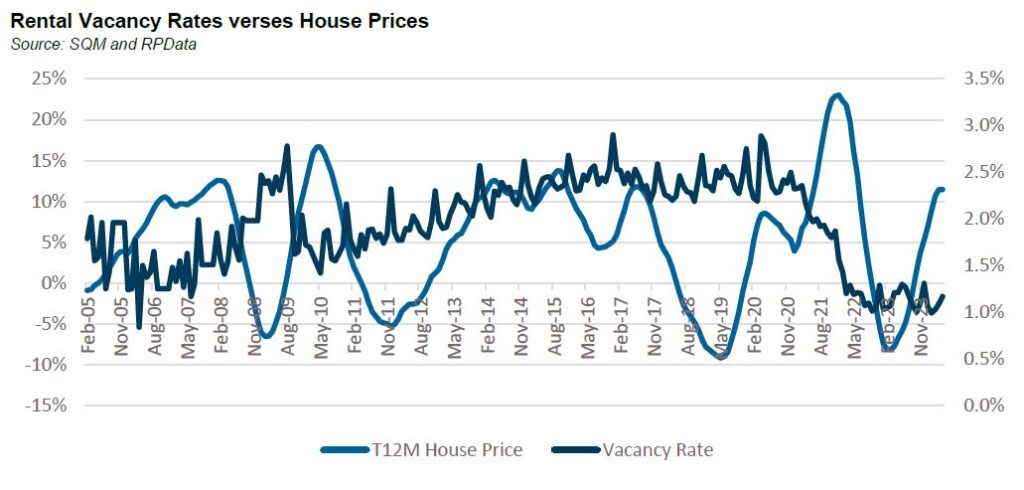
With all these negative indicators we are heavily reliant on the housing supply/demand argument holding up house price valuations. So how confident are we in the supply/demand imbalance? The first indicator for low supply seems to be the lack of vacant rental housing. Pre-COVID vacancy rates were around 2.5%, close to 20 year peaks. When COVID hit, vacancy rates spiked then declined sharply as household formation rates plummeted.
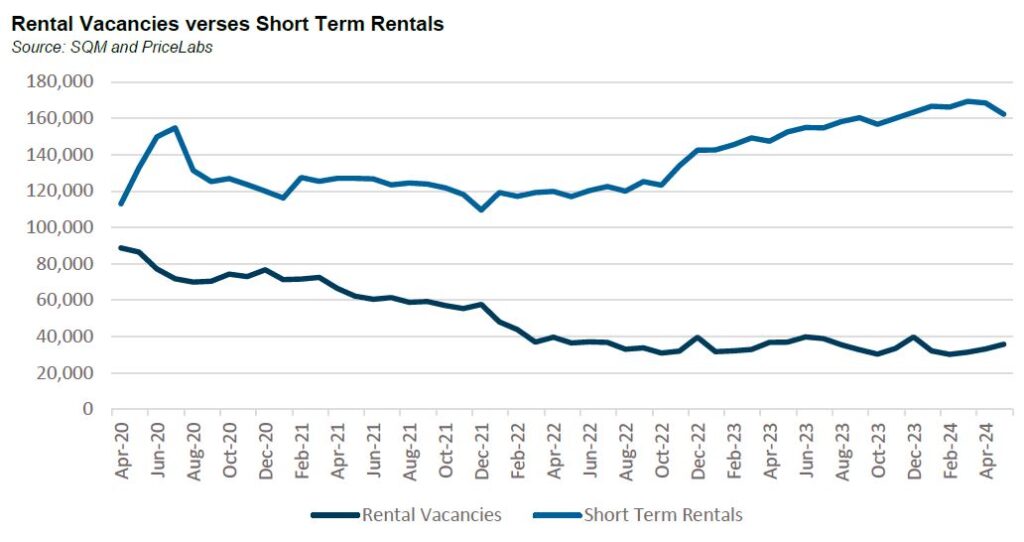
However, the relationship between vacancy rates and house prices does not appear to be as strong as the headlines suggest[1]. Coming out of the GFC, house prices rose strongly even as vacancy rates increased. For much of the 2010s vacancy rates were rangebound between 2-3% but in the second half of the decade prices began to decline. In fact, the last time vacancy rates were this low, it was prior to the GFC. When a vacancy rate of 1% is quoted, it's calculated as a percentage of total rental stock, not total housing stock. Total housing stock is c. 11 million units compared to rental stock of 3 million. To put in context the decline in the vacancy rate from March 2020 to current is equivalent a reduction of around 30,000 dwellings. Contrast this figure with the amount of unoccupied houses which was over 1 million on the night of the 2021 census of which 10,000 dwellings were completely vacant, 100,000 were secondary dwellings with the remaining 890,000 being primary dwellings which were empty. Historically there has always been around 10% of total housing stock that is unoccupied at any point in time. Related to this are short term rentals. These do not show up in the rental vacancy statistics mentioned above but according to PriceLabs, a site which tracks short term rentals, listings are up by close to 50,000 since the start of COVID. It's not unreasonable to assume that some of the rental stock taken out of the market has moved into the short term rental market.
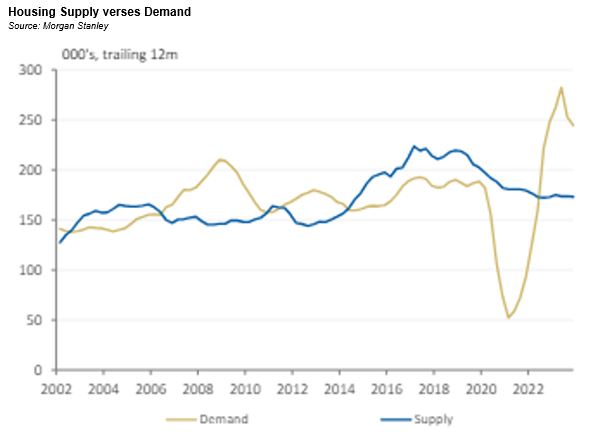
The question is, could it come back? Having rebounded strongly post COVID RevPAR[2] is down slightly on a year over year basis. With interest rates higher, the economics of short term rentals (and for that matter, long term rentals) is under pressure. Add to this, increases in land taxes for investors in Victoria plus an upcoming levy of 7.5% to be charged for short term rentals which is to be charged from 2025. It's not inconceivable that as financial conditions tighten, supply could come out of existing stock, either via second houses or short term rentals. On the supply side, it is clear that the government's target of building 1.2 million homes in 5 years is not happening. The National Housing Supply and Affordability Council estimated in May that around 903,000 dwellings would be built with a further 40,000 social and affordable dwellings built, figures that appear to be far more achievable. But they also expect demand to stabilise with around 871,000 new households forming as migration normalises. So, looking forward we don't seem to have a major housing supply issue. The question is whether we are grossly under supplied now. The below chart from Morgan Stanley attempts to answer this. It shows that we were undersupplying during the GFC and early 2010s and oversupplying from around 2015 until 2022 from which point the housing market became historically undersupplied. In fact, it is arguable that we are undersupplied right now; our view is that the market is extrapolating incremental demand exceeding incremental supply into a more significant and permanent imbalance than likely exists[3].
So, what does this all mean? We think the supply-demand argument is overbaked. The state of the housing market has much more to do with the amount of stimulus and lagged effect of interest rate increases than migration and construction. As the economy goes so too does the housing market. Already house prices in New Zealand and the United Kingdom, two markets with very tight supply demand characteristics, are declining. House prices in Canada are flat and slowing in the United States. House prices have had a strong run in Australia, but we expect some normalisation over the second half of 2024. Funds operated by this manager: Challenger IM Credit Income Fund, Challenger IM Multi-Sector Private Lending Fund For Adviser & Investors Only
[1] Academic research has shown there is a relationship between rental vacancy rates and rents and then a relationship between rents and house prices. Our view is simply that there are much more important factors at play driving house prices such as real incomes, interest rates, sentiment and asset prices. [2] RevPAR refers to Revenue Per Available Room. It is a standard acronym within the hotel sector and is used within the short term rental market. [3] We haven't discussed migration in this piece and instead relied on the NHSAC estimates for new household formation. Suffice to say migration is a highly politicised issue and risks are likely to the downside given the rhetoric from both sides of the aisle. |

17 Jul 2024 - Research in Focus: Fast food companies down, but not out
|
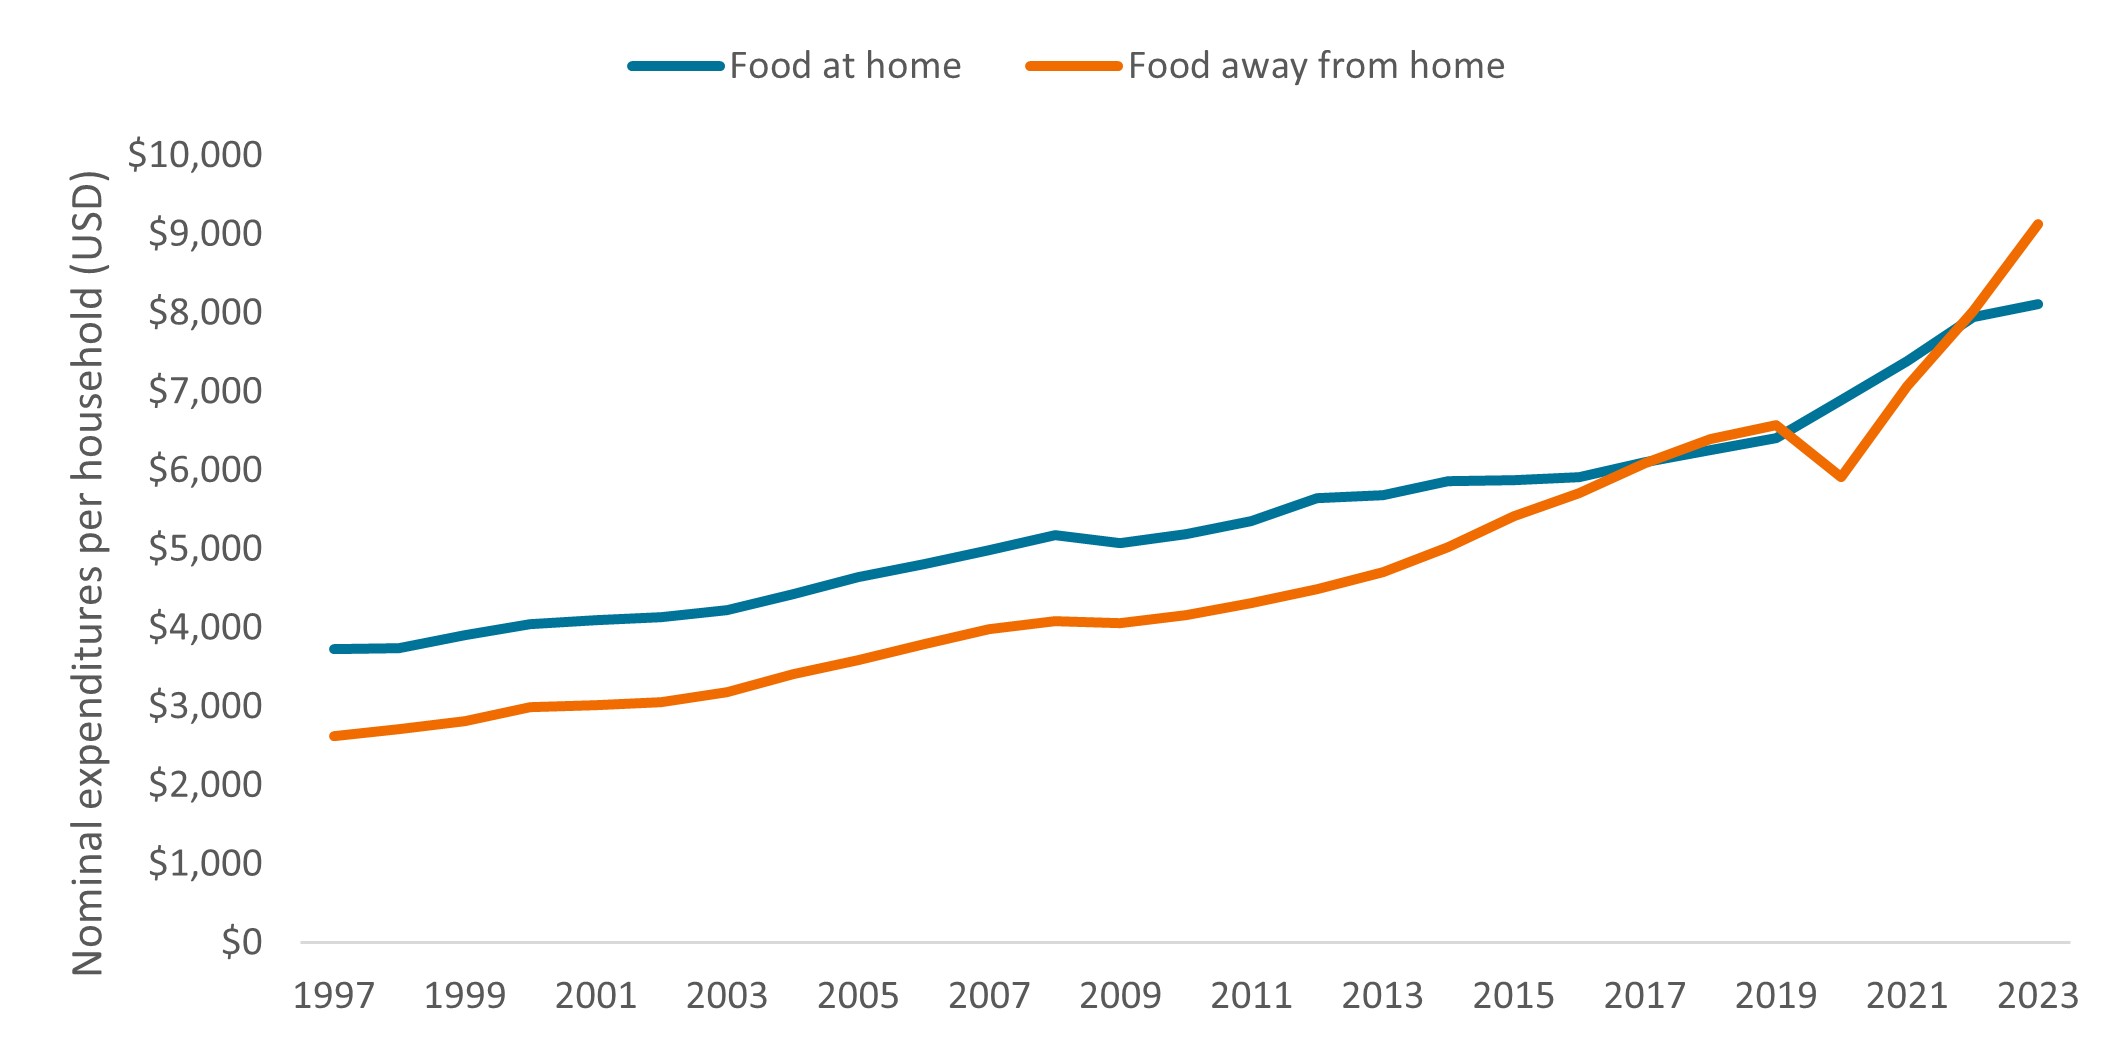
Research in Focus: Fast food companies down, but not out Janus Henderson Investors July 2024 Portfolio Manager and Research Analyst Joshua Cummings, from the Global Research Team, says that while inflation-weary consumers are pushing back against the price of fast food today, the industry's long-term prospects still appear strong. In a time of elevated inflation, anyone might reasonably think the fast-food industry would thrive as consumers seek out low-cost dining options. But judging by recent headlines and viral social media posts, these days, even fast food is getting pushback from cash-strapped consumers. "Americans are choking on surging fast-food prices," said one news report in May. "$18 Big Mac meals," exclaimed another headline, followed by social media posts purporting the famous hamburger deal now costs 100% more than it did five years ago. The furor became so deafening that in late May, Joe Erlinger, president of McDonald's USA, felt compelled to write a "Myth vs. Facts" blog post, defending the fast food chain's price increases. (Fact: the average Big Mac Meal is now $9.29, up only 27% from 2019.1) Even so, the damage has been done: During the latest quarterly reporting period, many fast-food chains reported a decline in year-over-year same-store sales growth. Their stocks have also lagged the broader equity market in 2024. And to win back customers, many companies are rolling out new value deals and adopting a "street-fighting mentality to win." Investor takeawayIn our view, the fast-food saga signals that more households are beginning to feel the cumulative impact of nearly three years of above-average inflation. Whether $5 value deals and other promotions will be enough to win them back in the short term remains to be seen. But we'd encourage investors to also consider longer-term trends and remember that business fundamentals - not headlines - tend to matter more to companies' long-term prospects. Over the last few months, the annual rate of inflation in the U.S. for food away from home (FAFH) has exceeded that of food at home (FAH), but since the pandemic, price increases in the two categories have largely kept pace (albeit with exceptions in some regions due to factors such as local minimum wage laws).2 And eating out has always been more expensive than FAH regardless of the inflation backdrop. Furthermore, data show that when looking at long-term patterns, consumers are increasingly choosing to dine out. The average household spent more on FAFH as a portion of their overall food budget for the first time starting in 2018. And that percentage - with the exception of 2020, during pandemic lockdowns - has continued to climb since (See "By the numbers"). To that end, while growth has recently slowed for some companies, sales are still well above where they were before the pandemic, allowing firms to boast double-digit operating margins. Will inflation reverse this trend? In a recent survey, nearly 80% of Americans said fast food is now a luxury because of price increases. But three-quarters of respondents also said they eat fast food at least once a week, and nearly half said they use store apps to unlock deals.3 In our view, these data points suggest fast food enterprises that are perceived to offer "value" - whether through loyalty programs, new menu items, quick service, and so on - have room for further growth. Geography could also come into play: One popular fast-casual restaurant serving up burritos still has 99% of its stores in the U.S. It is among the most popular fast food options with Americans, and while management has plans to nearly double the domestic footprint, they are also eyeing non-U.S. expansion. In our view, that suggests opportunity for significantly more - not less - growth ahead. By the numbers - U.S. household spending on food at home vs. away from home
Source: Calculated by U.S. Department of Agriculture, Economic Research Service from various sources. As of 3 June 2024. Author: Joshua Cummings, CFA |
|
Funds operated by this manager: Janus Henderson Australian Fixed Interest Fund, Janus Henderson Australian Fixed Interest Fund - Institutional, Janus Henderson Cash Fund - Institutional, Janus Henderson Conservative Fixed Interest Fund, Janus Henderson Conservative Fixed Interest Fund - Institutional, Janus Henderson Diversified Credit Fund, Janus Henderson Global Equity Income Fund, Janus Henderson Global Multi-Strategy Fund, Janus Henderson Global Natural Resources Fund, Janus Henderson Tactical Income Fund
This information is issued by Janus Henderson Investors (Australia) Institutional Funds Management Limited (AFSL 444266, ABN 16 165 119 531). The information herein shall not in any way constitute advice or an invitation to invest. It is solely for information purposes and subject to change without notice. This information does not purport to be a comprehensive statement or description of any markets or securities referred to within. Any references to individual securities do not constitute a securities recommendation. Past performance is not indicative of future performance. The value of an investment and the income from it can fall as well as rise and you may not get back the amount originally invested. Whilst Janus Henderson Investors (Australia) Institutional Funds Management Limited believe that the information is correct at the date of this document, no warranty or representation is given to this effect and no responsibility can be accepted by Janus Henderson Investors (Australia) Institutional Funds Management Limited to any end users for any action taken on the basis of this information. All opinions and estimates in this information are subject to change without notice and are the views of the author at the time of publication. Janus Henderson Investors (Australia) Institutional Funds Management Limited is not under any obligation to update this information to the extent that it is or becomes out of date or incorrect.
|

16 Jul 2024 - Why Anchoring is Sabotaging Your Stock Market Success
|
Why Anchoring is Sabotaging Your Stock Market Success Marcus Today July 2024 |
|
A landscape image representing the stock market and stock market analysis. The background features a digital chart with rising and falling stock prices, candlestick graphs, and financial data overlays. On the side of the image, a large anchor is more apparent and appears submerged into the stock market scene, symbolizing stability amidst the market fluctuations. The overall color scheme includes shades of blue, green, and red to reflect the dynamic nature of the stock market. No ocean or people are present in the image. Understanding Anchoring and Its Impact on Stock Market Investments What is Anchoring in Financial Markets? We all have a lot of trouble buying stocks that have gone up a lot and selling stocks that have gone down a lot. If that's you then I regret to inform you that you are being affected by a well-established financial concept that only affects soft brained investors. It is called "Anchoring". Anchoring, also known as a 'focusing bias', is the use of a reference point against which to judge value. You hear the issue every day in a broking office, it's when someone says "I can't buy that because the share price is up XYZ%" or "You can't sell that the price is down XYZ%". An even more soft brained development on the theme is when you find yourself saying "It's down XYZ% so it's cheap" or "It's up XYZ% so it's expensive". But making money in shares is all about where the share price is going. In that equation, where the share price has been is pretty much irrelevant and the fact that we don't buy or sell a stock because it is up X percent or down X percent, because of where the share price 'was', is unscientific. What you paid for a stock, what price it was in the past, in fact, any reference to the share price history, ignores the only relevant consideration which is what the share price is going to do tomorrow. BHP five years ago was priced on a different set of facts to BHP now, so what relevance is that old high or old low. It's irrelevant. Despite that it is common practice to reference how much a stock has moved from the lowest low or highest high and it is commonplace to take those past prices (laughably - the extreme highs or lows) as an anchor point from which to judge the current price as being expensive or cheap based on how far it is up or down since then. But past prices are simply a statement of where a price was. The more important consideration is what the company is worth now coupled with an understanding that the market's appreciation of what the company was worth at some point in the past has almost certainly changed. As soon as the value of a company changes, which arguably it does every day, you have to move your thinking along. If your decision making starts with a reference point from the past (It's up XYZ% from the low") you have proven yourself a bit amateur. To make a stock judgement past prices are the most unscientific of starting points. Another amateur manifestation of anchoring is buying stocks because they have fallen a lot. This is technically wrong to do (you should sell stocks going down not buy them). Buying bombed-out stocks (catching the knife) because they have fallen a lot, ignores the fact that the market's assessment of the company's value has changed, a lot, for the worse, so the 'attraction' of a big fall is irrelevant. The other very widespread use of anchoring is when traders use their purchase price as a reference point. "I'll sell it if it goes up 10%" or "I'll sell if it goes below my purchase price". All very nice but not rational, although, in its defence, anything, even unscientific anchoring, is better than nothing when it comes to having some trading discipline. An extension of anchoring is 'lazy jargon'. Saying that a stock is "cheap" or "undervalued" because it has fallen a lot. Or "expensive" or overvalued" if it's gone up a lot. A stock can only be valued with reference to what it is worth, not with reference to what the share price used to be. The best way to avoid anchoring is to forget the past price as a reference point and simply assess 'cheap or expensive' on some other criteria. PE history perhaps, or price relative to an intrinsic value calculation would be more useful. Meanwhile you can amuse yourself by listening out for anyone, you perhaps, making comments or decisions on the basis that a stock is up X% or down X% because your sole focus should be whether a stock is going up or not. The fact that it's gone up or not, that, is irrelevant. Anchoring - Another reason humans aren't wired to trade successfully. Author: Marcus Padley |
|
Funds operated by this manager: |

15 Jul 2024 - 10k Words | July 2024
|
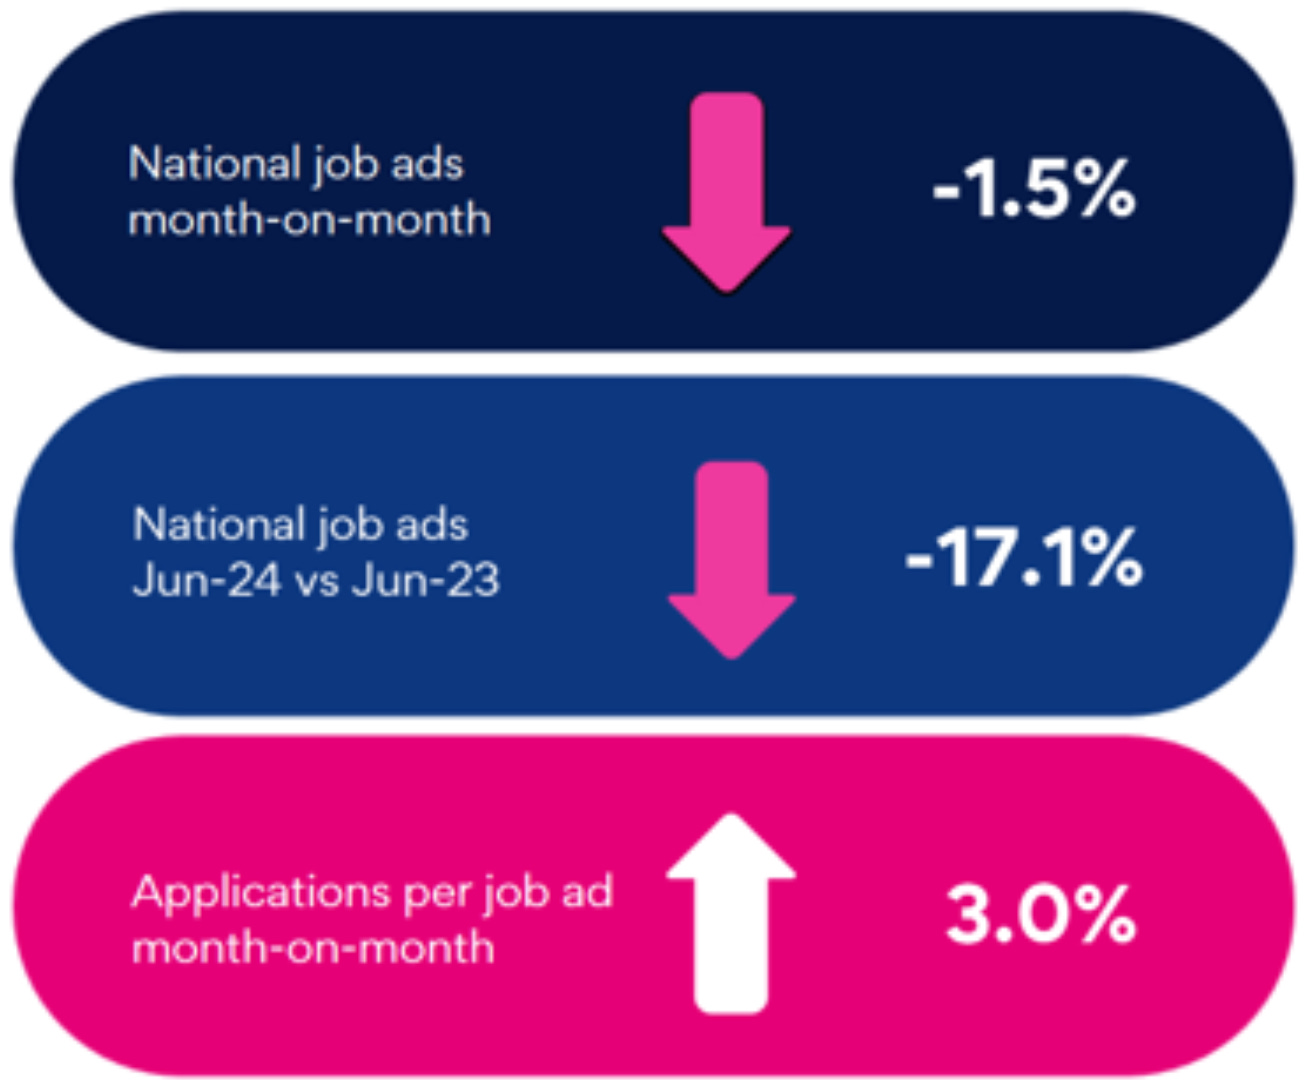
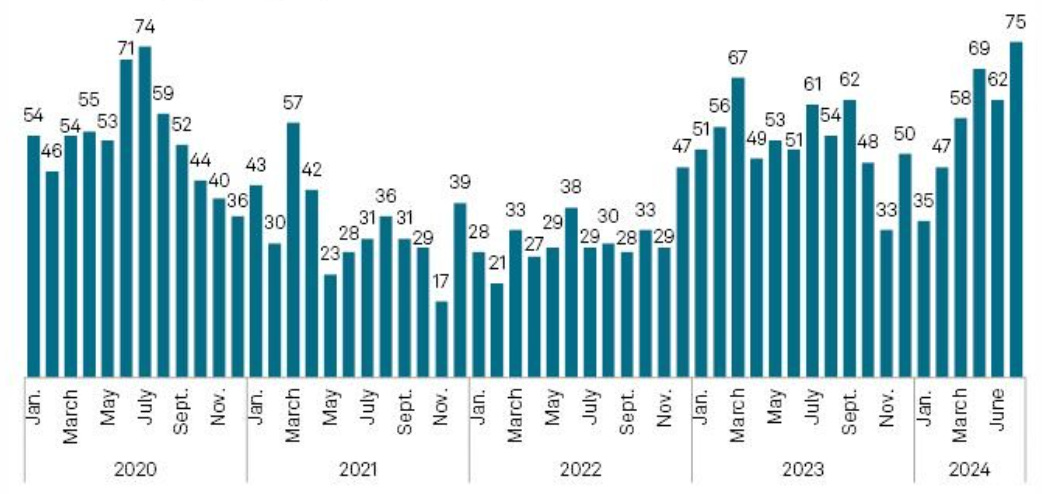
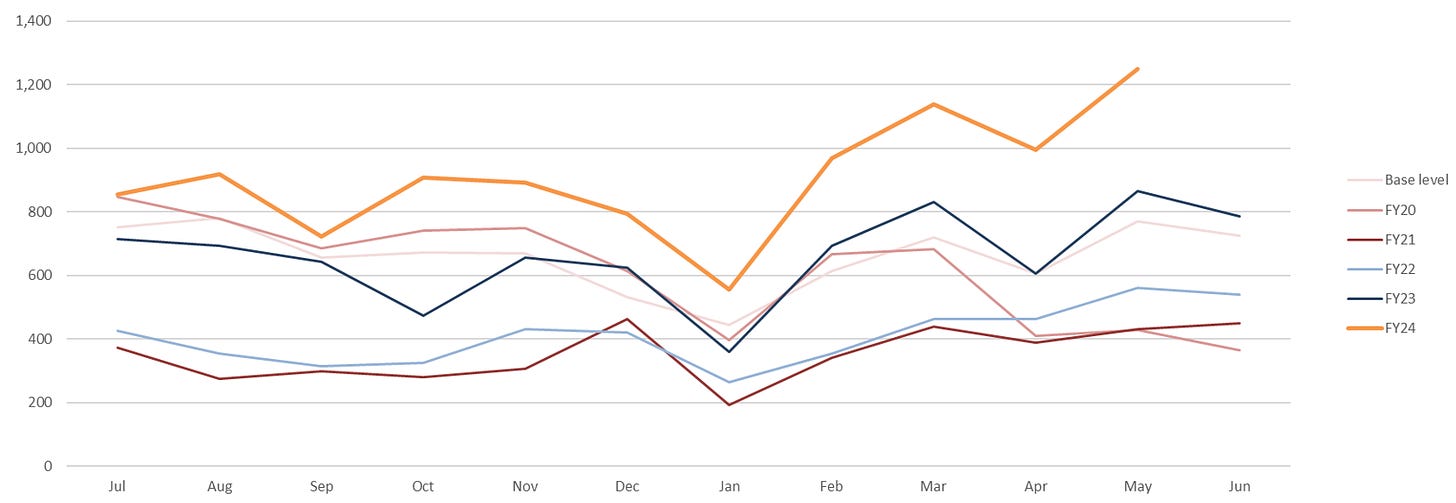
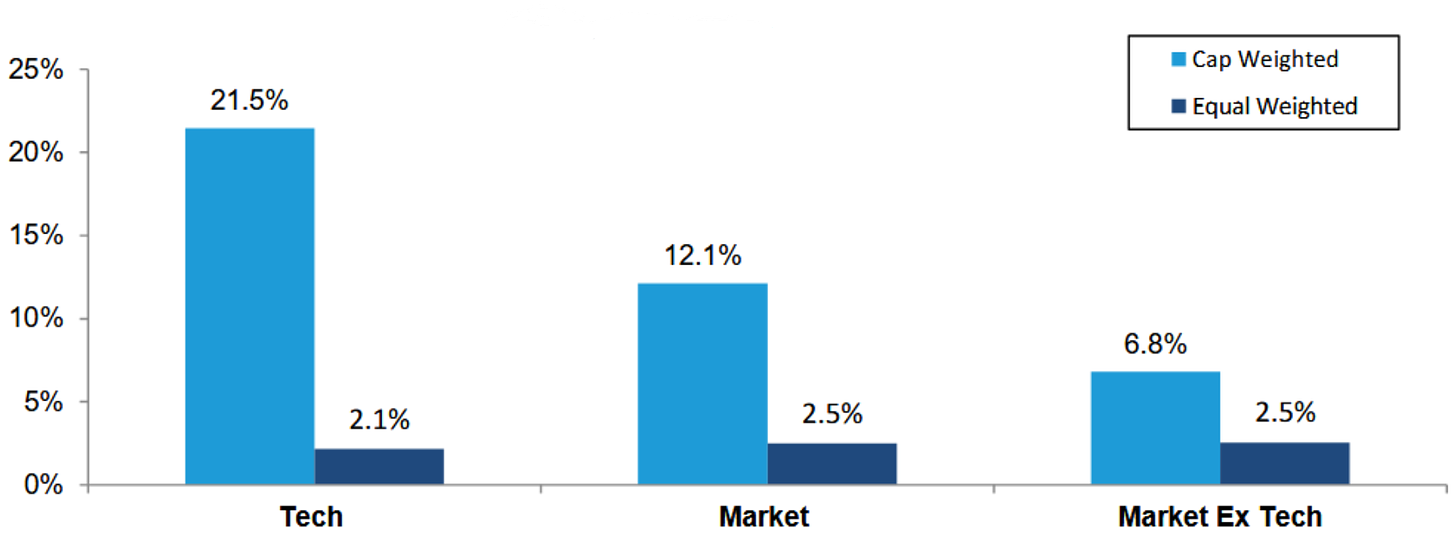
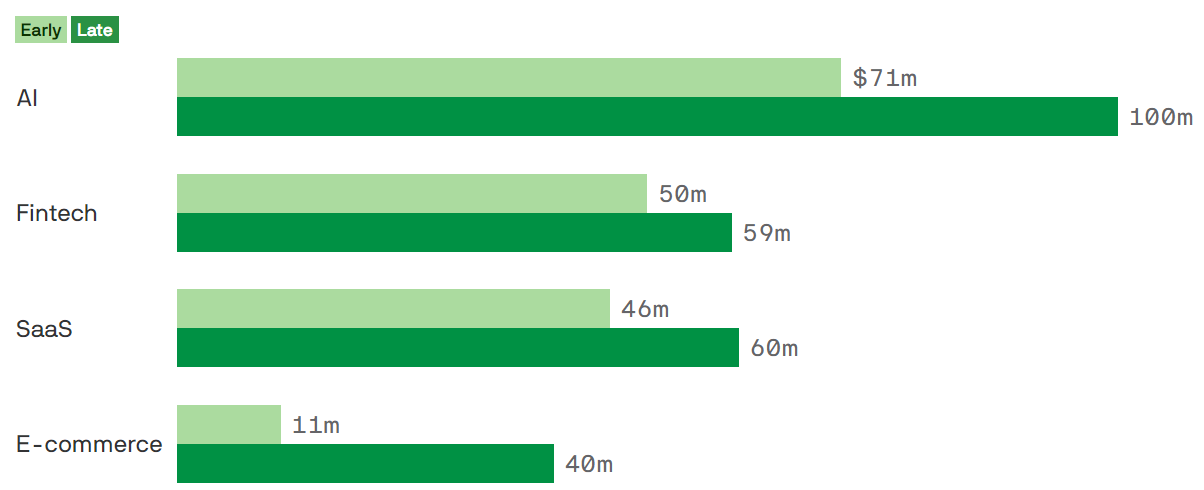
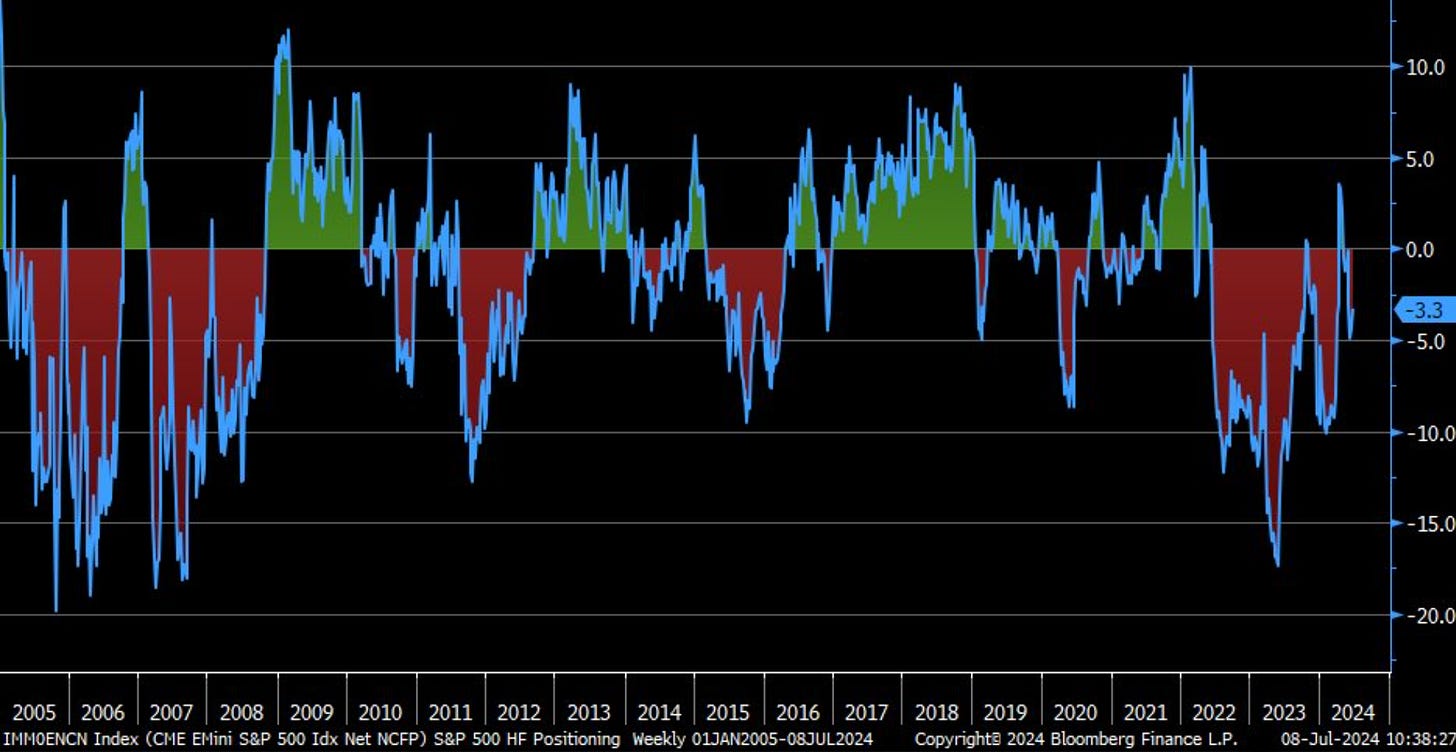
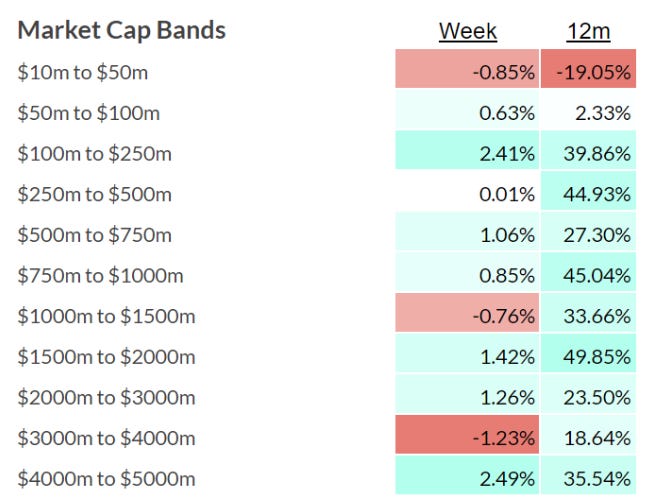
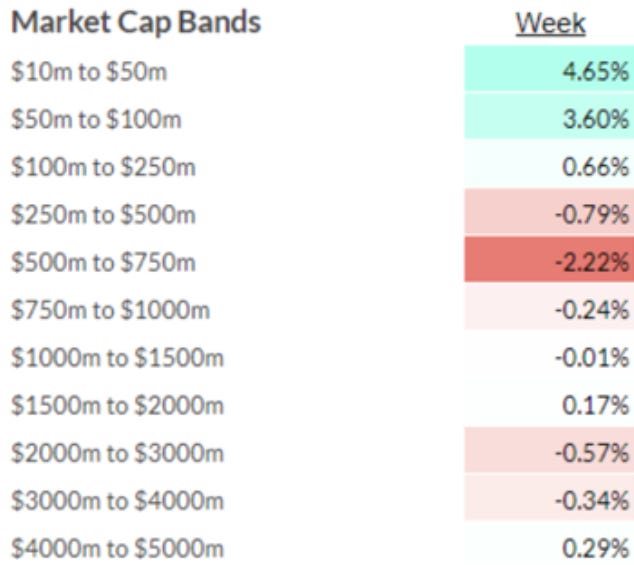
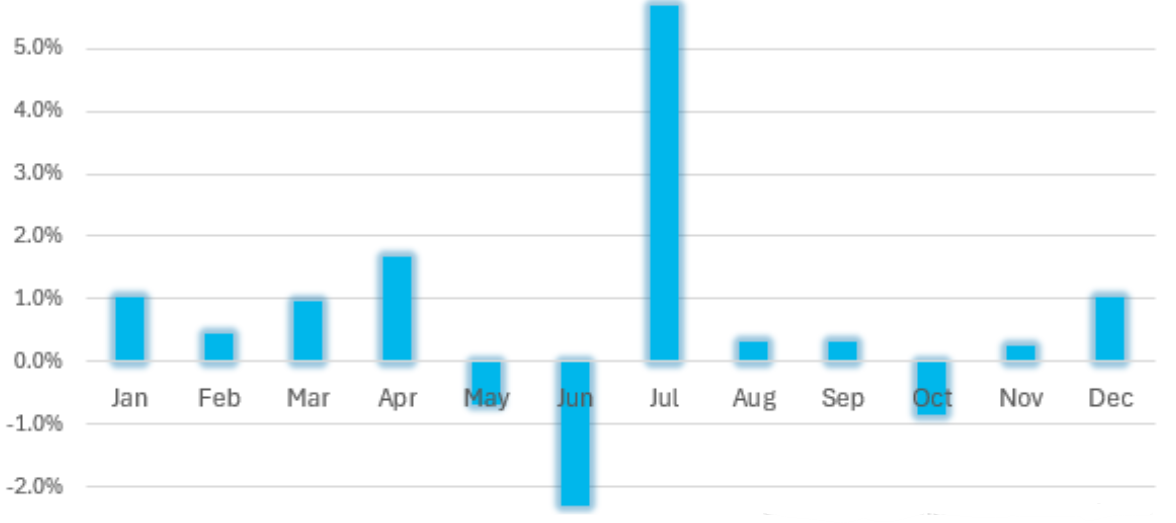
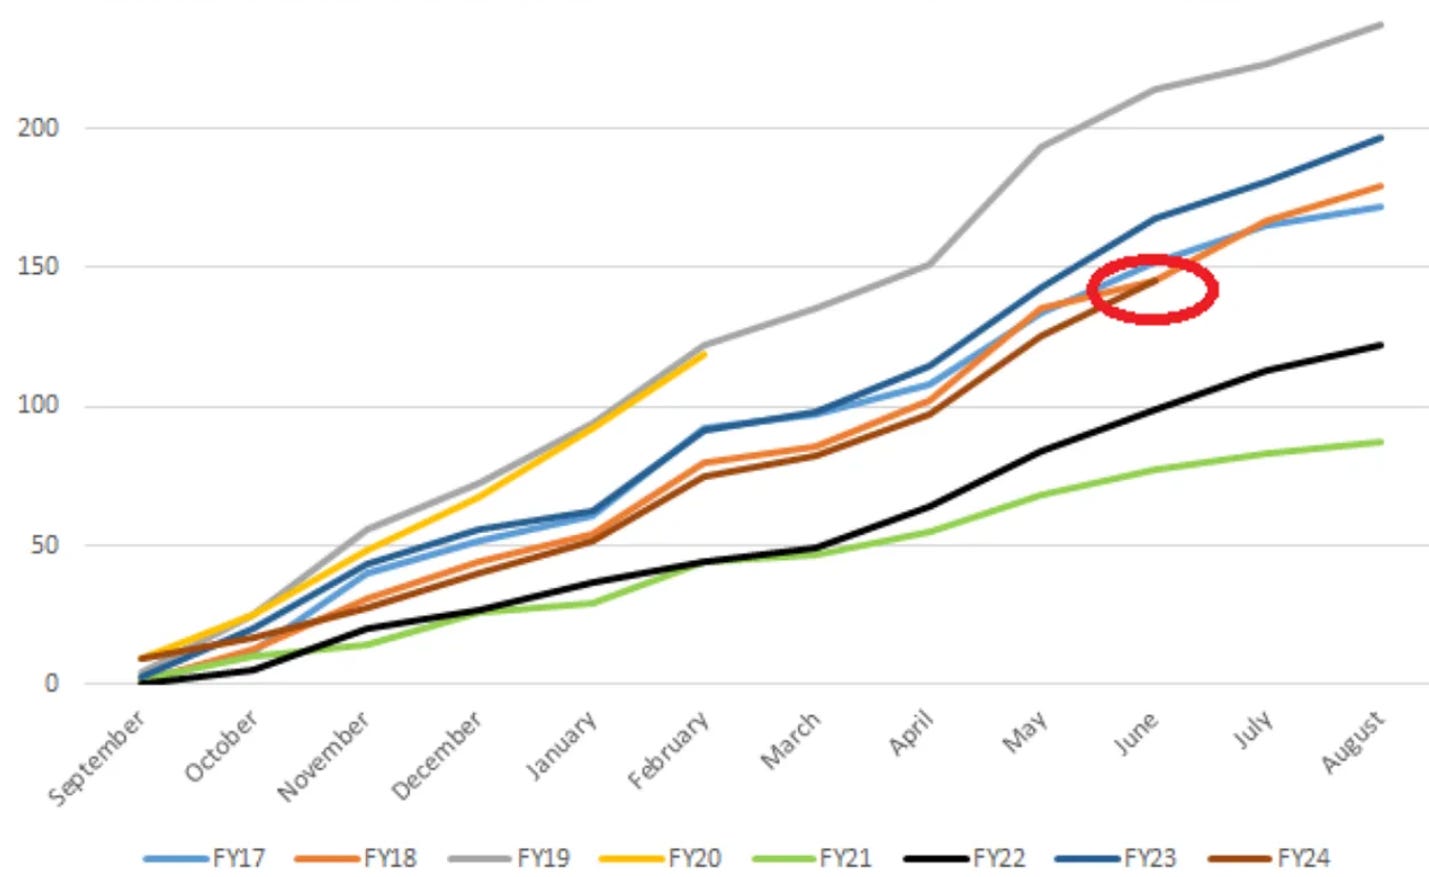
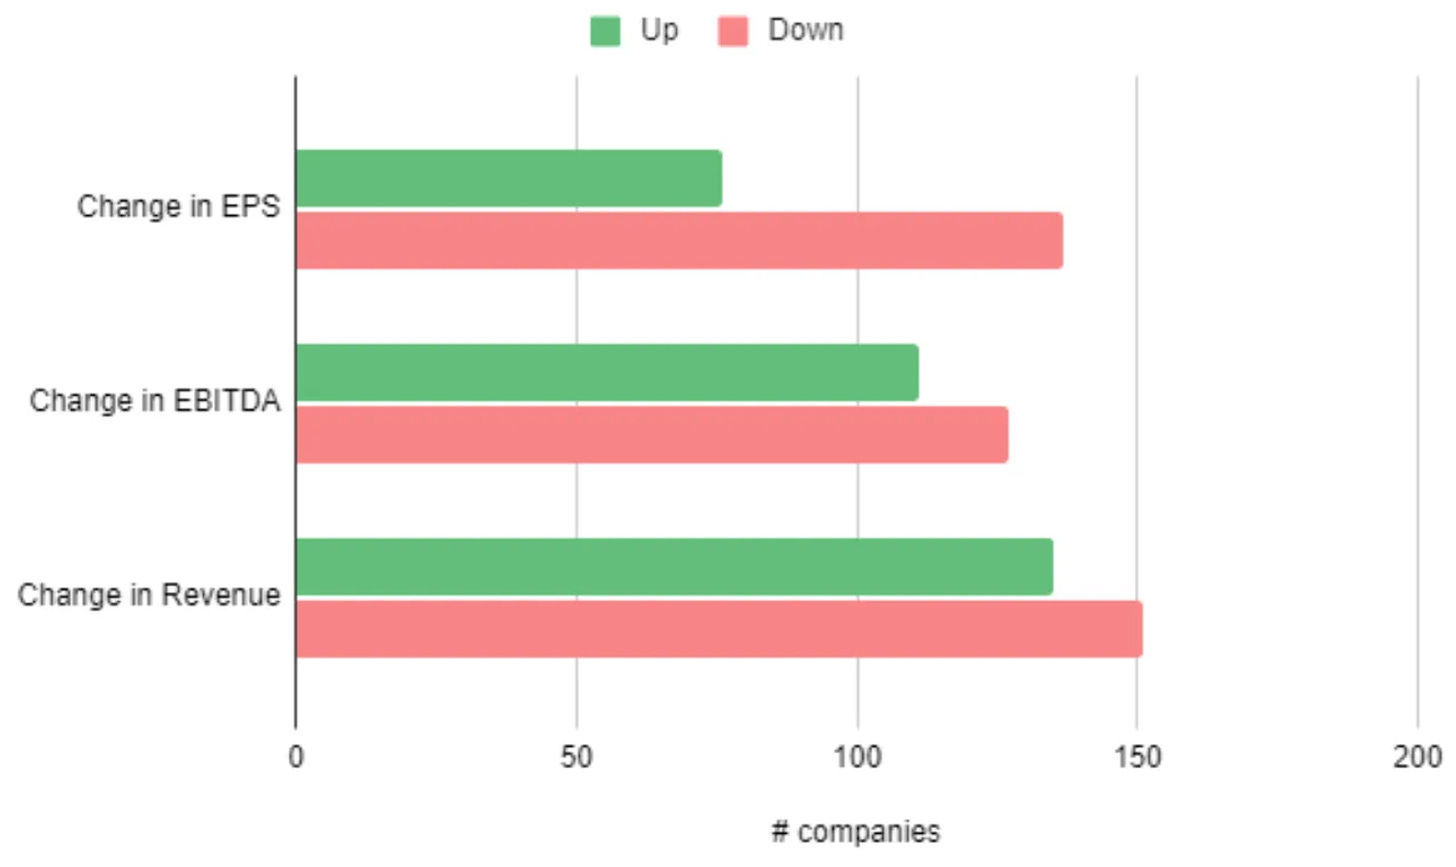
10k Words Equitable Investors July 2024 Seek's national job ads count is down 17% over 12 months; corporate bamkruptcy/administration filings at multi-year highs; equal-weighted tech stocks are lagging cap-weighted tech performance by even more than the broader US market; AI valuations holding up VC space too; sustained net short positon on S&P 500; ASX nano/micro caps and the seasonal performance driven by tax loss selling in June, with a rebound in July; and finally the volume of downgrades coming into ASX reporting season is in-line with prior years. Seek's June 2024 Australian job ads
Source: Seek US bankruptcies by month
Source: S&P Australian external administration appointments by year
Source: ASIC 2024 YTD absolute performance - tech v. rest of the market
Source: Bernstein via @modestproposal1 2024 VC-backed tech valuations of select verticals, by stage
Source: Axios E-Mini S&P 500 net non-commercial futures positions % of open interest
Source: @LizAnnSonders, Bloomberg ASX ex-resoures by market cap band over 12 months of CY2024
Source: Equitable Investors
ASX ex-resoures by market cap band - first week of FY2025 Source: Equitable Investors Average monthly return of S&P/ASX Emerging Companies Index (since March 2016, excluding COVID-impacted CY2020)
Source: Equitable Investors Number of ASX downgrades - comparison with past financial years (FY20 cut short by COVID) "FIT" universe (ASX micro-to-mid, ex resources) - changes to consensus estimates over past 12 months Source: Equitable Investors July 2024 Edition Funds operated by this manager: Equitable Investors Dragonfly Fund Disclaimer Past performance is not a reliable indicator of future performance. Fund returns are quoted net of all fees, expenses and accrued performance fees. Delivery of this report to a recipient should not be relied on as a representation that there has been no change since the preparation date in the affairs or financial condition of the Fund or the Trustee; or that the information contained in this report remains accurate or complete at any time after the preparation date. Equitable Investors Pty Ltd (EI) does not guarantee or make any representation or warranty as to the accuracy or completeness of the information in this report. To the extent permitted by law, EI disclaims all liability that may otherwise arise due to any information in this report being inaccurate or information being omitted. This report does not take into account the particular investment objectives, financial situation and needs of potential investors. Before making a decision to invest in the Fund the recipient should obtain professional advice. This report does not purport to contain all the information that the recipient may require to evaluate a possible investment in the Fund. The recipient should conduct their own independent analysis of the Fund and refer to the current Information Memorandum, which is available from EI. |

12 Jul 2024 - Fast food profits
|
Fast food profits Montgomery Investment Management June 2024 I have previously written here that one of the most repeatable ways to make money on the Australian Stock Exchange (ASX) is to buy into a retail store rollout story early. Catching the steepest part of the 'S' curve when revenue and profit growth are accelerating while head office becomes simultaneously more efficient usually produces good results thanks to the accompanying rise in the share price. And when like-for-like sales of existing stores are still growing and the number of new stores being added is high in proportion to the number of existing stores, jumping aboard early provides an even more beneficial tailwind. Store growth ambitions are often disclosed in a company's initial public offering (IPO) prospectus and within twelve months, investors usually have a good idea about management's ability to deliver on the stated plans, as well as customers' love for the concept. Recent retail success stories Some recent and not-so-recent examples include Lovisa (ASX:LOV), which sold its product through 60 stores in 2012. When it was listed in 2014, it had grown to 220 stores. Eight years after listing, Lovisa distributes its jewellery through 449 stores. And since it listed, the share price is 976 per cent higher. JB Hi-Fi (ASX:JBH) listed in October 2003, with just 25 stores, issuing shares at $1.55. Today, with 316 stores (including acquisitions of Clive Anthonys and The Good Guys) the shares trade at $58.46, a return of 3671 per cent, or 19.1 per cent per annum over 20 years, excluding dividends. The furniture retailer Nick Scali (ASX:NCK) was listed in May 2004. At the time of its 2004 full-year results, it reported sales of $43.4 million and earnings of $6.7 million from just 10 stores. The IPO price was $1. With 85 stores today, and more than 90 Plush stores, the share price is up 1378 per cent at $13.78, or 14 per cent per year over 20 years. Guzman y gomez IPO Recently, the healthy, fast, Mexican-inspired food chain Guzman y Gomez launched its prospectus for an already fully subscribed IPO to list shares on the ASX on 25 June. With its first store opening in 2006, and 185 stores in Australia currently, Guzman y Gomez's management has already proven to be one of Australia's fastest-growing quick service restaurant (QSR) teams. Guzman y Gomez plans to have over a thousand domestic stores in the next twenty years. This compares with McDonalds (NYSE:MCD) Australia, which opened its first store in 1971, reached 869 stores in 2011 and now has 1043 stores. Elsewhere, Subway, which launched in 1988, has 1227 stores across Australia today, while Domino's (ASX:DMP), which set up shop in 1983, now has 736 stores. And like Lovisa, JB Hi-Fi and Nick Scali before it, Guzman y Gomez lists 'new store openings' as its top source of future growth, stating, "new restaurant openings in Australia are expected to be the primary contributor to Guzman y Gomez's network sales growth over the long term. Guzman y Gomez believes there is an opportunity to grow its network to more than 1,000 restaurants in Australia over the next 20-plus years. The company believes that it has substantially built the team, restaurant pipeline, and infrastructure to be able to open 30 new restaurants per annum over the near-term [it opened 26 in CY23], increasing to 40 restaurants per annum within five years." As an aside, there are also 16 stores in Singapore, five in Japan and four in the U.S. Not only are store openings going to continue, they are expected to accelerate. That's the first source of growth. Importantly, individual store economics are extremely attractive, with Guzman y Gomez expecting to achieve a return on investment (ROI) in line with existing stores of approximately 50-55 per cent on new corporate restaurants and its franchisees to achieve an ROI of approximately 30 per cent on new franchise restaurants, with the difference being due to the royalty paid by franchisees. Not only is the number of these highly profitable stores expected to grow significantly and accelerate, but restaurant margins are also expected to improve. Guzman y Gomez restaurant margins improve with volume, and volume rises as Guzman y Gomez stores mature. In 2023, corporate restaurant margins were 14.4 per cent. In 2024, that margin is expected to rise to 17.1 per cent and 17.8 per cent in 2025. At the same time, the Franchise royalty rate is expected to rise from an average 7.6 per cent in FY23 to 8.3 per cent in 2025. And as the store count grows, the general and admin related costs should come down. Indeed, the company is aiming for a reduction in G&A-to-network-sales from the expected 6.8 per cent of sales in FY25. Accelerating store openings, continuing like-for-like sales growth, expansion in restaurant margins and franchise royalty rates should all add up to strong earnings growth, something investors are desperately seeking in an environment marred by slowing economic growth and heightened interest rates. What remains for investors to consider is the price they might be paying for all this growth. Cornerstone investors, which include Aware Super and Copper Investors, are acquiring their shares at $22 each following a 250-for-one share split. That price represents a very high price-earnings (P/E), so one might wonder what the cornerstone investors see that's worth paying up for, especially given at that multiple there will be any number of investors who turn their back on the opportunity. So is Guzman y Gomez the ultimate investor Mexican standoff? Valuation considerations Most investors value QSR businesses on an earnings before interest, tax, depreciation and amortisation (EBITDA) multiple basis, and the number on the prospectus is about 38 times, which, again, is very high. Importantly, it's worth understanding that 38 times includes the losses the company is currently incurring in the U.S. strip out those losses and the multiple applicable to the Australian business is about 32 times. It's also worth acknowledging a change in the terms between the company and its franchisees. When Guzman y Gomez first launched, the standard franchise contract included an eight per cent of sales royalty. Given Guzman y Gomez franchisees earn abnormally high returns on investment, Guzman y Gomez changed that franchise royalty to eight per cent of sales up to three million dollars per store and 15 per cent above that. All new franchise arrangements are struck on the new terms and old franchise arrangements, when they come up for renewal, will move to the new platform. Assuming Guzman y Gomez didn't open another restaurant ever again and existing stores traded without any further improvement, the shift to the new contract terms would see the EBITDA multiple falls from 32 to approximately 28 times. Meanwhile, if the company also opens its targeted 30 stores next year, never opens another store again after 2025, and these stores trade in line with existing stores, the EBITDA multiple falls to 23 times. It is clear from the prospectus, the company plans to open many more stores in coming years. International comparisons Despite Guzman y Gomez's prospectus appearing to play down its international growth opportunities, it may nevertheless be worth comparing the adjusted EBITDA multiple to global peers. A relevant comparison would be Cava (NYSE:CAVA), which IPO'd in the U.S. in June 2023, also at U.S.$22 per share, funnily enough. Upon listing, Cava shares surged 89 per cent to U.S.$42 amid that clearly welcomed long-term sustainable growth stories, especially category-defining brands. Cava has about 200 stores and trades at 82 times EBITDA. Meanwhile, Chipotle (NYSE:CMG), which is obviously the behemoth in the space, and arguably mature, with 6,000 stores, trades at 34 times. With an already proven store concept, a significant store rollout opportunity ahead, and a proven management team to execute that store rollout, some investors are clearly arguing the multiple is reasonable. And with existing shareholders (including your author) escrowed until August 2025, the supply of shares may be tight. Investing in the rapid rollout of a successful store concept has been one of the easiest and most repeatable ways to make money in the Australian stock market. The listing of Guzman y Gomez in June this year will help determine if that strategy remains relevant. Author: Roger Montgomery Funds operated by this manager: Montgomery (Private) Fund, Montgomery Small Companies Fund, The Montgomery Fund |

11 Jul 2024 - EMD outlook: election fever
|
EMD outlook: election fever abrdn June 2024 We look forward to the numerous elections that have the potential to shape the asset class and what it could mean for investors.There is rarely a dull moment in emerging market debt (EMD), and the first six months of 2024 have been no different. While the opening half of the year hasn't produced the blockbuster returns of 2023, there have been plenty of talking points. Most notably around elections and debt restructurings. Bond outlook pieces often mention developed market monetary policy as a driver of returns, and rightly so. For emerging markets (EMs) in 2024, however, a different theme has emerged- elections. To date, voters have gone to the polls in Bangladesh, Taiwan, El Salvador, Pakistan, Senegal, India, Mexico, Turkey and South Africa. We don't have time to run through the individual country outcomes but there are a few that warrant a closer look. Let's turn our attention to Pakistan. In January, a civilian government came to power, pledging fiscal consolidation and promising to build foreign exchange (FX) reserves. Sound familiar? That's because it is. Pakistan is now looking to enter a record 24th International Monetary Fund (IMF) programme. The question remains: will the outcome be different this time? The early signs are promising. Ongoing disinflation has allowed the central bank to loosen monetary policy. The balance of payments recently turned positive. But let's not get carried away. This story is still unfolding, and we'll keep a close eye on developments over the coming months. In Mexico, the election of Claudia Sheinbaum, a protégé of the current president (AMLO), is expected to maintain the political status quo. Sheinbaum will need to focus on reducing the deficit from 6% of gross domestic product to a manageable level. The fiscal deficit blew out in the run-up to the election, as AMLO increased unfunded social security payments - among other social transfers - in a bid to shore up support. It certainly did the trick. Sheinbaum will also have to reckon with Pemex, the state-owned energy company groaning under heavy debt and declining crude production. AMLO's decision to include Pemex's amortisation payments in the national budget for the first time also increased the deficit. It's hard to see how Sheinbaum will address these issues in the near future. Democracy alive and wellLiberal democracy has come under pressure over the last few years. It was therefore encouraging to see the world's largest democracy, India, go to the polls in a general election that was generally seen as free and fair. Such is the scale of proceedings that voting took place over six weeks. President Modi has walked away wounded but victorious. His BJP party remains the largest in congress and coalition partners are unlikely to block his planned economic initiatives. Finally, in South Africa, the loss of the ANC's majority for the first time since the dawn of democracy shocked the party. For the moment, things are likely to remain the same. Yet, looking ahead, there's an increased chance of the government collapsing, leading to either parliament choosing a new president or calling for new elections. Stay tuned. What does this mean for investors?Why are we focusing on country-specific events? Because it's in idiosyncratic stories where we see the most compelling investment opportunities. This plays to our strength in EMD: fundamental bottom-up research to generate alpha. At an index level, spreads across bond markets, including EMD, are tight compared with historic levels. Meanwhile, investment-grade spreads have been unattractive for several quarters. We remain underweight here. Over a year ago, we identified value in the distressed and CCC segments. The near completion of several debt restructurings has validated this view, leading to outperformance. Recently, investors accepted Zambia's debt restructuring deal, crafted by official creditors, the IMF and the private sector. These deals should lead to renewed inflows into Zambia and bodes well for Ghana and Sri Lanka, which are negotiating their own deals. While we haven't seen credit-rating upgrades for CCC-rated issuers - where the most significant spread changes have occurred - further narrowing of spreads is likely should such upgrades occur. What's the outlook?And so to the US Federal Reserve. Its decision to delay rate cuts has notably affected EM local bond markets, which are particularly sensitive to shifts in interest rate cut expectations. At the end of May, the EM Index was down -2.7% year-to-date. Despite the current challenges, rate cuts in EMs are coming. Monetary policy remains tight, growth is lagging long-term averages, and base effects mean inflation should continue to fall. Despite the macro backdrop, local bond markets continue to price-in tight monetary policy. We're holding positions and adding selectively in anticipation of the market delivering elevated returns in the coming months. After lagging EMs in 2023, EM Corporate Debt has outperformed in the first half of the year. Fundamentals remain in good shape, reflected in the low default rate year-to-date. At the end of April, the rate stood at just 0.7%, well-below the historical average. Most defaults in this asset class are coming from China's high-yield property sector. Like the sovereign market, spreads have been tightening recently, reaching near-historic lows. Despite this, the high absolute yield of over 7% remains appealing. For now, there seems to be little that could halt the momentum of the spread rally. Finally, a quick word on frontier local markets. What's changing? The answer is: a lot - and for the better. Policymakers are building external buffers, inflows into the local market are contributing to the rebuilding of FX reserves, and financing from commercial and official sources is on the rise. Meanwhile, fiscal consolidation and tightening monetary policy are helping to establish policy anchors. Finally, high nominal yields and attractive carry in countries like Pakistan, Nigeria, Kenya, and Egypt mean that these markets are garnering investor attention and are worth considering for investment. Author: Leo Morawiecki |
|
Funds operated by this manager: Aberdeen Standard Actively Hedged International Equities Fund, Aberdeen Standard Asian Opportunities Fund, Aberdeen Standard Australian Small Companies Fund, Aberdeen Standard Emerging Opportunities Fund, Aberdeen Standard Ex-20 Australian Equities Fund (Class A), Aberdeen Standard Focused Sustainable Australian Equity Fund, Aberdeen Standard Fully Hedged International Equities Fund, Aberdeen Standard Global Absolute Return Strategies Fund, Aberdeen Standard Global Corporate Bond Fund, Aberdeen Standard International Equity Fund, Aberdeen Standard Multi Asset Real Return Fund, Aberdeen Standard Multi-Asset Income Fund |

10 Jul 2024 - BHP's emissions reduction pathway
|
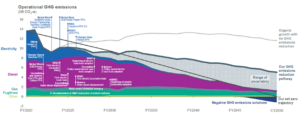
BHP's emissions reduction pathway Tyndall Asset Management June 2024 BHP Group Limited (BHP), a global mining giant, has reaffirmed its commitment to sustainability through an in-depth decarbonisation strategy, which was showcased during an investor presentation on 26 June 2024. The company is making significant strides toward achieving its ambitious medium- and long-term decarbonisation goals, focusing on substantial reductions in greenhouse gas (GHG) emissions across its operations and value chain. This insight delves into BHP's progress, key initiatives, and future plans for decarbonisation. Operational Emissions Reduction: Progress and GoalsBHP is on track to meet its target of reducing scope 1 and 2 emissions by 30% by FY2030, compared to FY2020 levels. By FY2023, the company had already achieved a 32% reduction, predominantly through investments in long term renewable energy power purchase agreements, underscoring its commitment to a sustainable future. To maintain this level of performance as the company - and its emissions - continues to grow is a substantial investment of approximately US$4 billion in decarbonisation initiatives up to FY2030. Key Initiatives:
Figure 1: BHP's operational decarbonisation trajectory |

9 Jul 2024 - Why invest in global equities
|
Why invest in global equities Magellan Asset Management June 2024 |
|
Australian investors often prefer to invest in Australian shares due to their familiarity with local companies. For generations, many have held shares in iconic Australian firms like BHP Billiton, Woolworths, and Westpac Banking, or their predecessors. While many Australians invest locally, they are spending with global companies, regularly choosing to consume products and services from global mega-brands. In our connected lives, we awake to an alarm from our Apple iPhone, sip our morning at-home coffee from Nestlé and tap Visa or Mastercard as we board the train or jump in an Uber. Australians heavily rely on global technology brands such as Microsoft Windows, Netflix, Spotify, Apple iPhone, Alphabet for Google internet searches and Meta Facebook and Instagram for social networking. Our pantries and bathrooms are filled with many of Nestlé's 2000 brands, especially some of its 31 mega-brands (Nespresso, Milo, Kit-Kat, Nescafe, Purina, Nature's Bounty Vitamins) as well as Lóreal's broad array of beauty products (Aesop, Garnier, Redken, Lancome). A stop at McDonalds is a feature of many Australian road trips. We use credit cards and mobile Wallets for almost all payments, via international financial services providers like American Express, MasterCard, Visa and Apple Pay and increasingly shop online using platforms like Amazon. Our medicines are developed by pharmaceutical companies based abroad such as in Switzerland or the US, and our surgeries are undertaken using precision equipment by multinational companies. Despite the familiarity and extensive usage of these international brands and products, many Australians have been less confident to own shares in them. Exploring the potential of investing in international shares could offer two significant benefits: Broadening Investment Opportunities Diversifying Risk Four key attributes that may contribute to achieving these two outcomes with international investing: 1. Look globally for the world's best companies. We consider that many of the world's best companies are found overseas - where 98% of stocks, by market capitalisation, are located. Alphabet (Google's parent company), Apple, Meta (Facebook, Instagram and 2. More industries to choose from. Investing in international equities can offer access to emerging industries poorly represented on the ASX. For example, for those seeking exposure to the prospects of artificial intelligence, 3D-printing, Cloud or cybersecurity, 3. Reduce local exposure. A portfolio that holds only Australian assets such as property, term deposits and Australian stocks is vulnerable to fluctuations in the Australian economy. The lack of diversification may expose investors to higher levels 4. Spreading currency risk. Investing in different markets may help diversify currency risk. Investing in international equities offers exposure to foreign currencies as the global stocks are bought in the local currency of their listing, which may include Investing in global equities offers Australian investors the opportunity to tap into the familiarity they already have with global mega-brands and access broader investment opportunities. By venturing into the global market, investors gain access to a wider array of industries and sectors underrepresented or absent on the Australian stock exchange. Investing in global equities can provide exposure to some of the world's best companies, diversification, and the potential for long-term growth. |
|
Funds operated by this manager: Magellan Global Fund (Hedged), Magellan Global Fund (Open Class Units) ASX:MGOC, Magellan High Conviction Fund, Magellan Infrastructure Fund, Magellan Infrastructure Fund (Unhedged), MFG Core Infrastructure Fund, Magellan Core ESG Fund Important Information: This material has been delivered to you by Magellan Asset Management Limited ABN 31 120 593 946 AFS Licence No. 304 301 ('Magellan') and has been prepared for general information purposes only and must not be construed as investment advice or as an investment recommendation. This material does not take into account your investment objectives, financial situation or particular needs. This material does not constitute an offer or inducement to engage in an investment activity nor does it form part of any offer documentation, offer or invitation to purchase, sell or subscribe for interests in any type of investment product or service. You should obtain and consider the relevant Product Disclosure Statement ('PDS') and Target Market Determination ('TMD') and consider obtaining professional investment advice tailored to your specific circumstances before making a decision about whether to acquire, or continue to hold, the relevant financial product. A copy of the relevant PDS and TMD relating to a Magellan financial product may be obtained by calling +61 2 9235 4888 or by visiting www.magellangroup.com.au. Past performance is not necessarily indicative of future results and no person guarantees the future performance of any financial product or service, the amount or timing of any return from it, that asset allocations will be met, that it will be able to implement its investment strategy or that its investment objectives will be achieved. This material may contain 'forward-looking statements'. Actual events or results or the actual performance of a Magellan financial product or service may differ materially from those reflected or contemplated in such forward-looking statements. This material may include data, research and other information from third party sources. Magellan makes no guarantee that such information is accurate, complete or timely and does not provide any warranties regarding results obtained from its use. This information is subject to change at any time and no person has any responsibility to update any of the information provided in this material. Statements contained in this material that are not historical facts are based on current expectations, estimates, projections, opinions and beliefs of Magellan. Such statements involve known and unknown risks, uncertainties and other factors, and undue reliance should not be placed thereon. No representation or warranty is made with respect to the accuracy or completeness of any of the information contained in this material. Magellan will not be responsible or liable for any losses arising from your use or reliance upon any part of the information contained in this material. Any third party trademarks contained herein are the property of their respective owners and Magellan claims no ownership in, nor any affiliation with, such trademarks. Any third party trademarks that appear in this material are used for information purposes and only to identify the company names or brands of their respective owners. No affiliation, sponsorship or endorsement should be inferred from the use of these trademarks. This material and the information contained within it may not be reproduced, or disclosed, in whole or in part, without the prior written consent of Magellan. |

8 Jul 2024 - Down-trading Megatrend
|
Down-trading Megatrend Insync Fund Managers June 2024
Funds operated by this manager: Insync Global Capital Aware Fund, Insync Global Quality Equity Fund Disclaimer |

5 Jul 2024 - Sustainable buildings: Beyond solar panels and water tanks
|
Sustainable buildings: Beyond solar panels and water tanks Janus Henderson Investors May 2024 According to the World Green Building Council, buildings and construction are currently responsible for 39% of global energy related carbon emissions: 28% from energy required for heating, cooling and electricity, and the remaining 11% from embodied carbon i.e., materials and construction. As Australia seeks to build more houses to address the current shortage, in addition to ongoing activity in commercial infrastructure, more needs to be done to help the construction industry reach net zero. Energy related carbon emissions are the easiest to tackle with many energy efficient initiatives and the use of renewables for electricity generation available. However, the biggest headwind facing this sector is embodied carbon. The availability and scalability of low-carbon materials remains a challenge as the industry is in a nascent stage. Supply is limited and the cost is high compared with traditional raw materials. As the industry works through the 'hard to abate' sectors, such as cement and steel, there are some ways to make buildings more sustainable now. These include the use of:
What can investors do to help?The Janus Henderson Australian Fixed Interest team has identified 'sustainable buildings' as one of its 'People and Planet' themes and buys 'use of proceeds' green bonds, sustainability bonds and bonds of issuers where capital is directed to improving energy efficiency in homes and creating more sustainable buildings. To improve our country's infrastructure and make our buildings more sustainable, collaborative efforts from a variety of stakeholders will be required. While state governments are likely to do some of the heavy lifting through increasing industry standards at the time of initial build and through their own housing projects, industry can also play a part. Regardless of which parties are involved, these projects require funding. Investors can play a role by putting their capital towards such projects through investing in funds that invest in this sector. In addition to investing in these bonds, Janus Henderson's Australian Fixed Interest team has a role to play through our active engagement. By having conversations with issuers and offering them support to come to market, we seek to increase the supply of public debt that has proceeds directly linked to creating more sustainable buildings. We also discuss climate targets with issuers in engagement meetings we conduct. State GovernmentsOn 1 October 2023, New South Wales (NSW) was the first state to introduce the 'Sustainable Buildings SEPP' which aims to reduce water usage and greenhouse gas (GHG) emissions across NSW. This new regulation, applicable during the construction of buildings, applies to both commercial and residential buildings (excluding three climate zones and apartment buildings up to five storeys). The new standards require: Commercial Buildings:
Residential Builds:
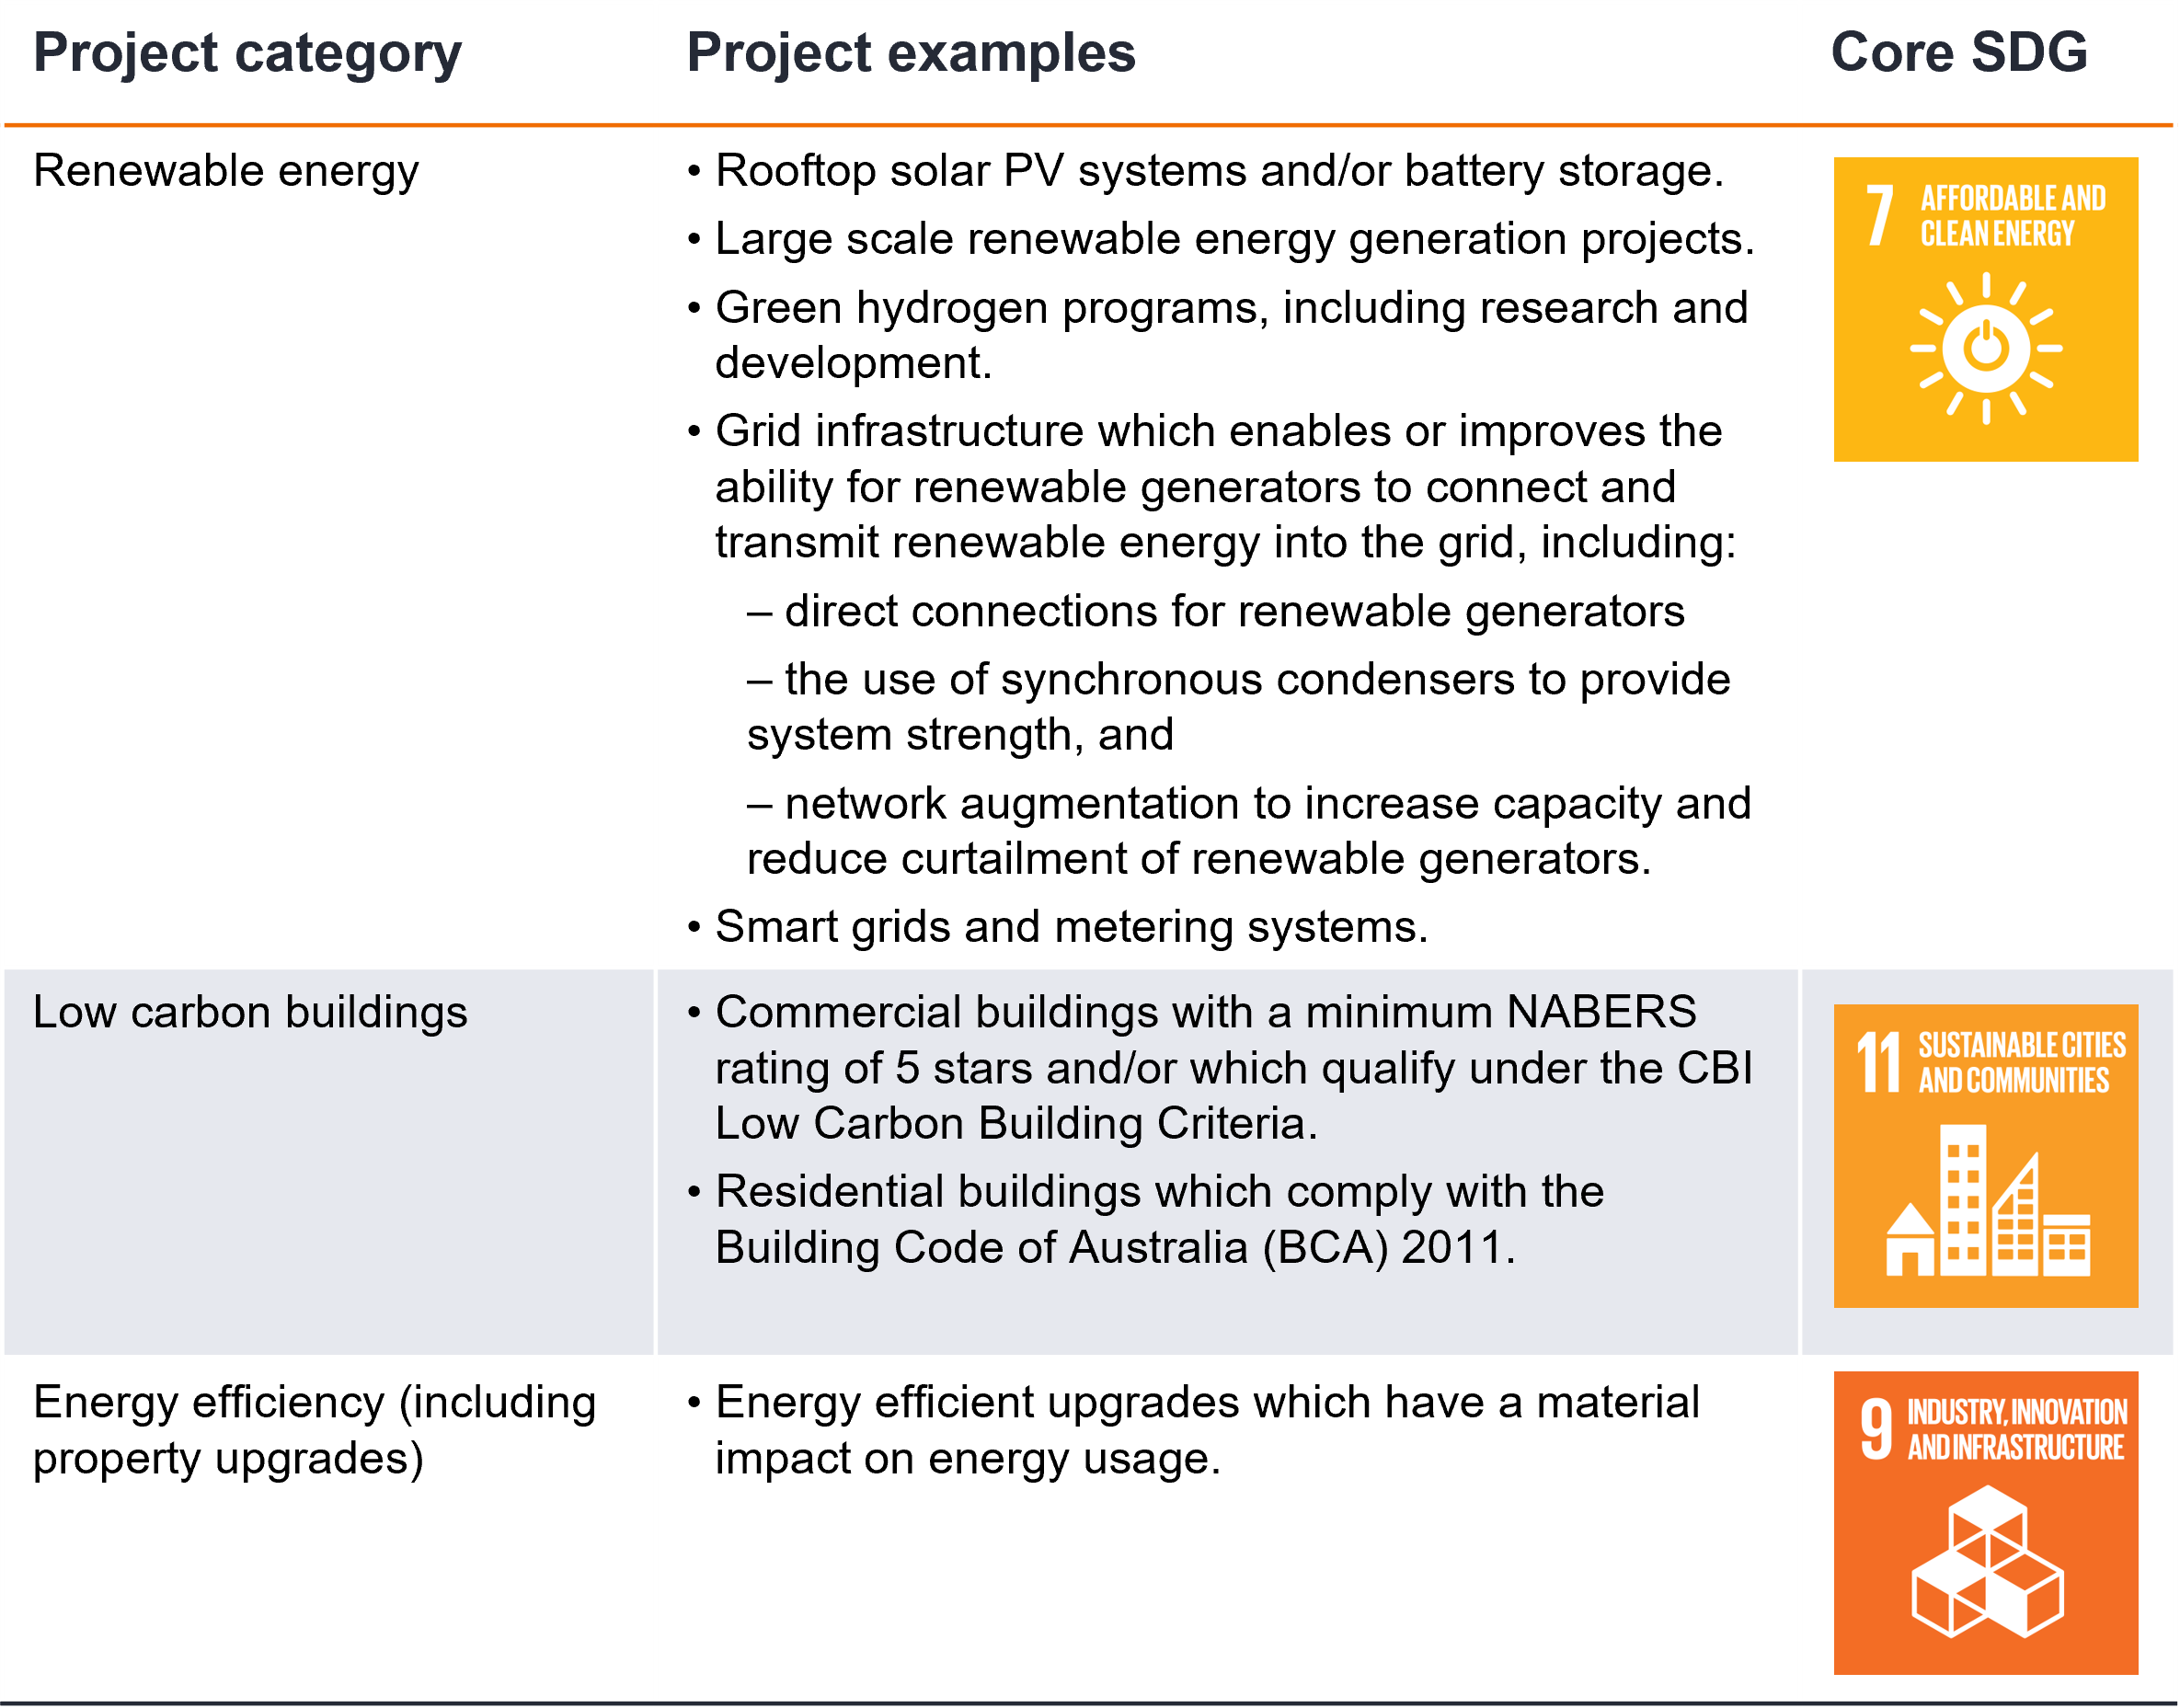
While it is likely that other states will enhance regulatory requirements on new builds, this is not something investors can direct capital towards. However, through the states sustainability frameworks, there is often capital being used for improving energy efficiency in homes. Of note is Treasury Corporation of Victoria's sustainability bonds which has an asset pool with a large weighting towards 'Victoria's Big Housing Build'. Over half of the pool is dedicated to the building of 12,000 new 7-star energy rated social houses. In addition, the Victorian government issues grants towards solar homes, which includes grants for panels, solar hot water, batteries, and household energy efficiency upgrades. The following projects are identified in the Victorian and NSW sustainability frameworks, from which their sustainability bonds are issued. Victoria sustainability framework
NSW sustainability framework
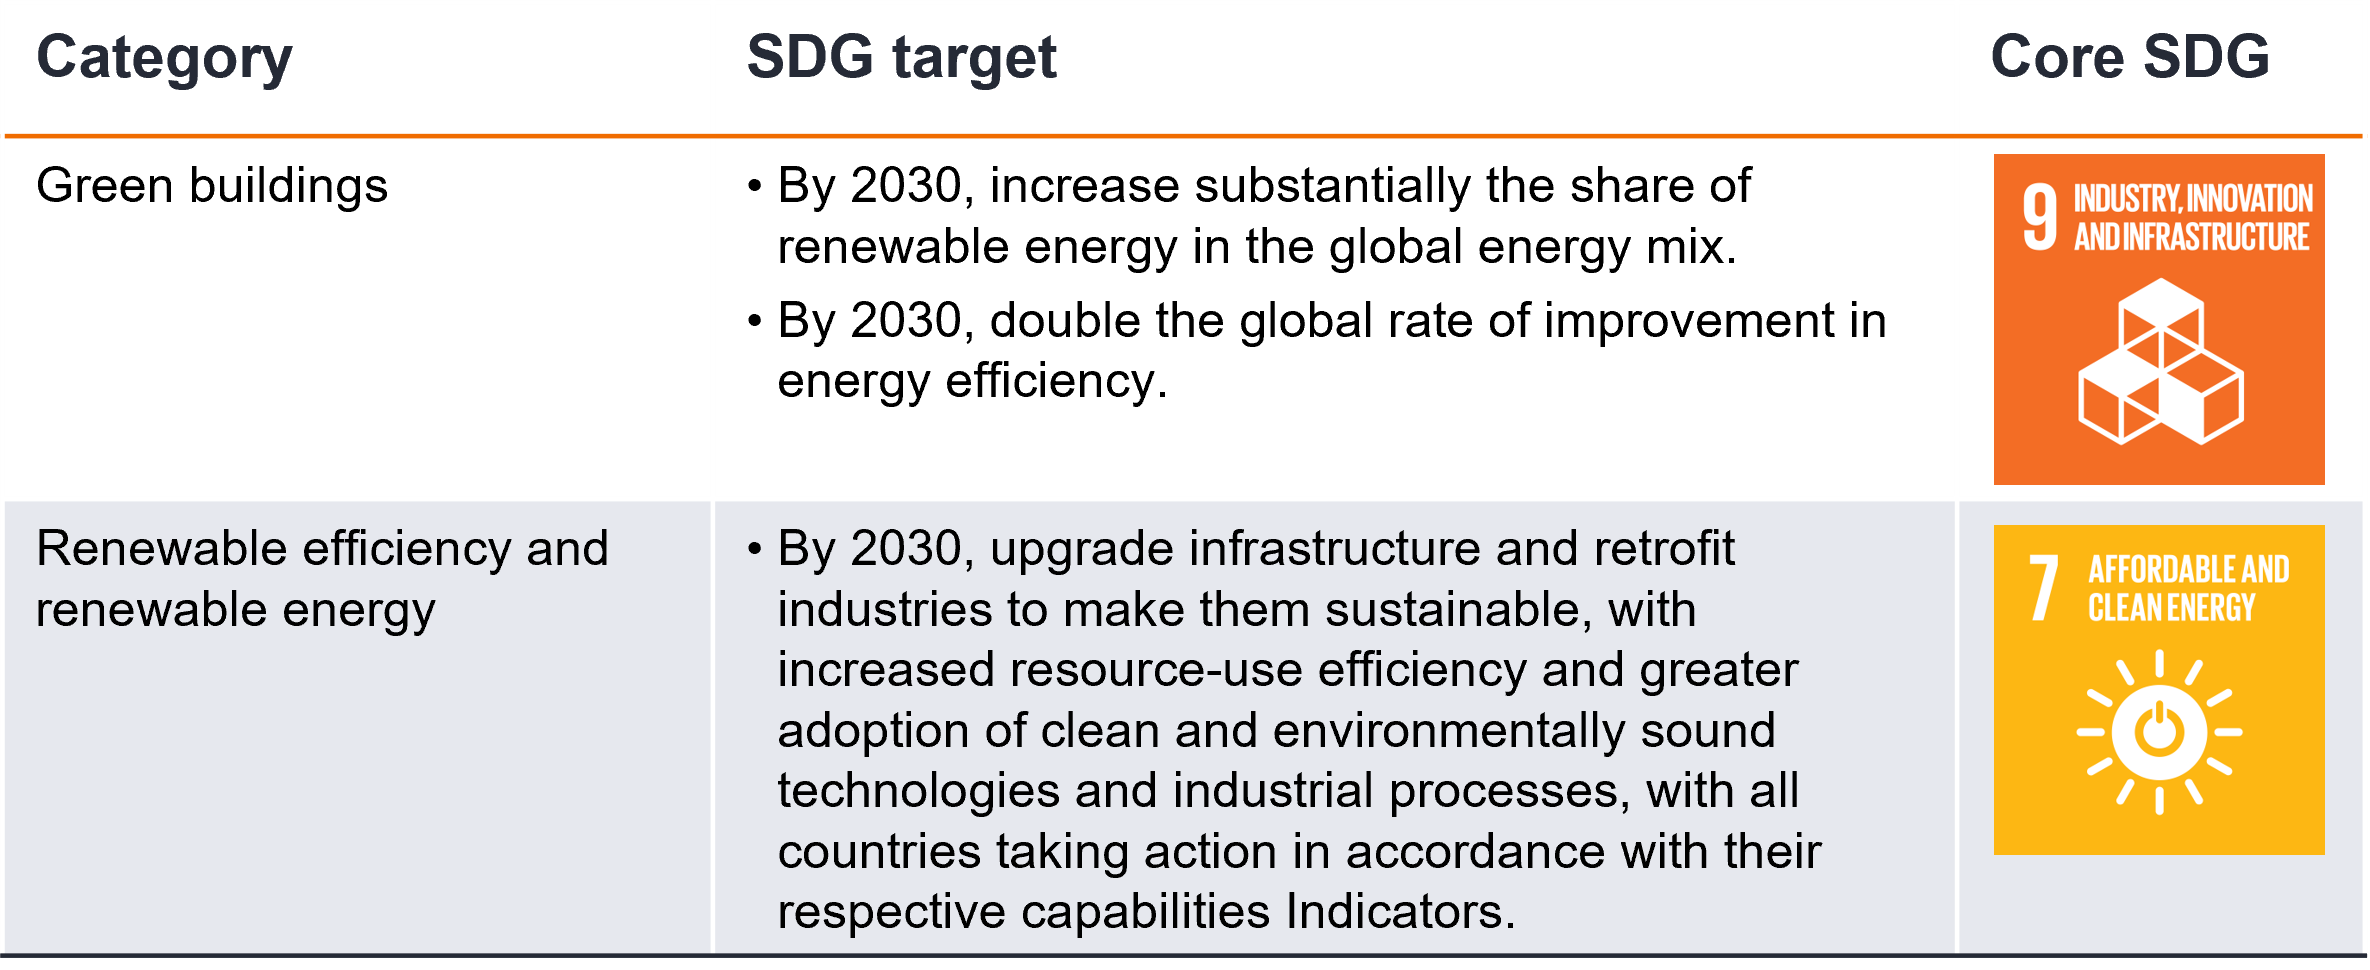
UniversitiesSome of the universities across our country are leading the way on sustainability. La Trobe University and University of Tasmania are two such examples, both of which have issued green bonds which we hold in our Sustainable Credit Fund and across other strategies. In terms of our targeted theme 'Sustainable buildings' they are participating in the following ways: La Trobe University plan to use 100% renewables by 2029, with 30% of their requirements being self-generated through the installation of solar panels on their roofs, and the building of a solar farm adjacent to their Bundoora campus. They are focused on reducing their carbon footprint through energy efficient building upgrades and a minimum 5-star green rating for all new builds. With new buildings they use cross laminated timber (CLT) which reduces embodied carbon compared to traditional methods. The benefits of CLT are that it is renewable, so throughout its growth it is capturing carbon. During the construction process it requires less water, energy and fossil fuels, resulting in a lower carbon profile. The timber is fabricated to a specific size so there is less waste when creating the material and given the pre-fabricated nature of the project it allows for quick build times, again reducing energy for the build. At end-of-life, CLT allows for simpler demolition with less construction waste and more opportunities for reuse/recycling of the materials. La Trobe have also committed to replant multiple trees for every one tree that is removed during the clearing for a new building. University of Tasmania is moving its Sandy Bay campus into the Hobart CBD. Already certified carbon neutral since 2016, the $550m project (which runs through to 2030) presents a significant opportunity to further contribute to decarbonisation. The university aims to reduce the upfront embodied carbon in its building program through the utilisation and adoption of low carbon construction practices and materials (including low carbon cement /concrete, CLT, recycled materials etc). The capital raised from their green bonds is being used to finance campus buildings, targeting a 20% or better reduction in upfront carbon emissions, relative to industry standard. As to the achievability of this target, the university's building projects in the north of the island, had achieved emissions reductions in the low 30%'s. Wider adoption of such innovative practices will be a game-changer for the broader Australian construction industry, and a significant positive as it relates to achievement of longer-term economy-wide emissions reduction commitments. Real estate investment trustsReal estate investment trusts (REITs) are large owners and builders of real estate, and therefore are key players in building, upgrading and maintaining sustainable buildings. Development and management property group Mirvac pride themselves on their sustainability credentials. Their climate targets include zero waste to landfill and net positive carbon (Scope 1-3) and water by 2030. Mirvac states they are committed to using sustainable and low-carbon materials in new developments. They are actively engaged in selecting low-carbon and sustainable materials for their construction projects such as recycled content, responsibly sourced timber, and low-carbon concrete alternatives, and promoting the use of recycled and renewable materials. Mirvac also incorporates sustainable design principles into projects to minimise embodied carbon. This includes optimising building layouts to maximise energy efficiency, using passive design strategies, and integrating renewable energy technologies to reduce reliance on carbon-intensive energy sources. While we like this issuer's overall sustainability framework, accessing 'use of proceeds' bonds that direct capital to specific green projects is more challenging. As it stands, they only have non-green bonds in Australian currency, with the lone green bond on issuance being in Hong Kong Dollars. While arguably a laggard to Mirvac, but still exhibiting strong ESG credentials, Vicinity Centres also aims to be net zero by 2030 (achieving a 41% reduction since 2016). They have recently invested $73m to deliver Australia's largest solar installation program across their shopping centres, and in FY21 managed to recycle 51% of their total generated waste. Investors can access direct investment in the sustainable buildings theme through Vicinity Centre's green bond which was issued in May 2022. The proceeds of this bond were used to finance projects and assets in line with their Sustainability Finance framework (and qualify as eligible under ICMA's Green Bond Principles). This includes financing or refinancing buildings with a minimum 5-star NABERS energy rating or above, of which they have three eligible assets including one which holds the highest rating possible (6 stars). The Banks' green and sustainable bondsMany of the banks (including the 4 majors and smaller banks such as Bank Australia, Bendigo Bank, and RACQ) are now offering, at a discount, 'green mortgages and loans' for customers. The proceeds of the loan are to be used to buy and install eligible small-scale renewables such as solar panels, battery packs and electric vehicle charging stations at the property. To fund these loans and mortgages they usually become a part of the assets pool in the bank's green bond and/or sustainable bond program. Commonwealth Bank of Australia for one has also offered up 'green' term deposits for institutional investors. ConclusionProgress towards building and upgrading more sustainable buildings can be helped along by investors willing to allocate capital to this space through:
Author: Liz Harrison, Fixed Interest Strategist - ESG |
|
Funds operated by this manager: Janus Henderson Australian Fixed Interest Fund, Janus Henderson Australian Fixed Interest Fund - Institutional, Janus Henderson Cash Fund - Institutional, Janus Henderson Conservative Fixed Interest Fund, Janus Henderson Conservative Fixed Interest Fund - Institutional, Janus Henderson Diversified Credit Fund, Janus Henderson Global Equity Income Fund, Janus Henderson Global Multi-Strategy Fund, Janus Henderson Global Natural Resources Fund, Janus Henderson Tactical Income Fund
This information is issued by Janus Henderson Investors (Australia) Institutional Funds Management Limited (AFSL 444266, ABN 16 165 119 531). The information herein shall not in any way constitute advice or an invitation to invest. It is solely for information purposes and subject to change without notice. This information does not purport to be a comprehensive statement or description of any markets or securities referred to within. Any references to individual securities do not constitute a securities recommendation. Past performance is not indicative of future performance. The value of an investment and the income from it can fall as well as rise and you may not get back the amount originally invested. Whilst Janus Henderson Investors (Australia) Institutional Funds Management Limited believe that the information is correct at the date of this document, no warranty or representation is given to this effect and no responsibility can be accepted by Janus Henderson Investors (Australia) Institutional Funds Management Limited to any end users for any action taken on the basis of this information. All opinions and estimates in this information are subject to change without notice and are the views of the author at the time of publication. Janus Henderson Investors (Australia) Institutional Funds Management Limited is not under any obligation to update this information to the extent that it is or becomes out of date or incorrect.
|

