NEWS

13 Feb 2023 - 10k Words
|
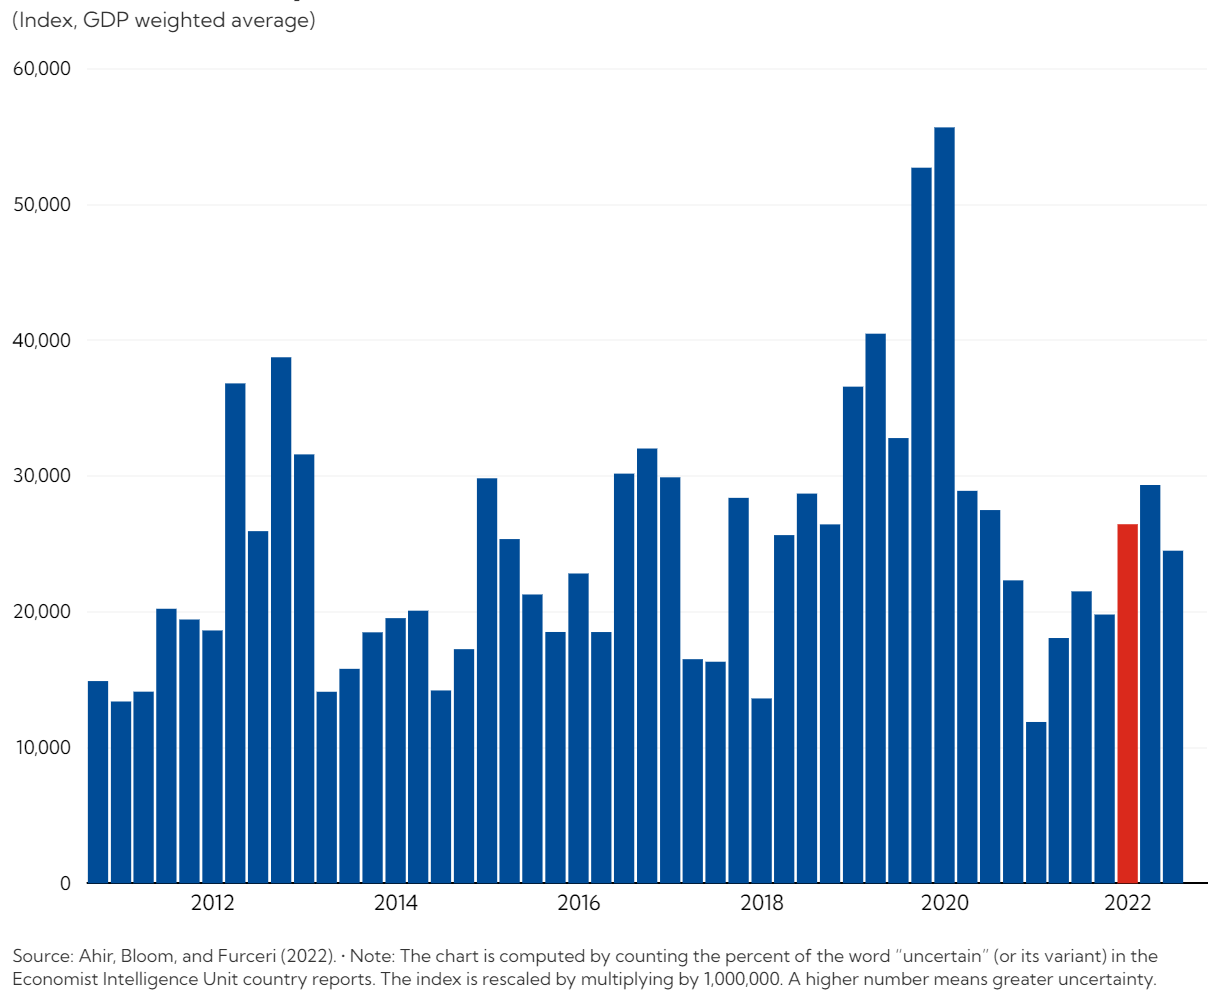
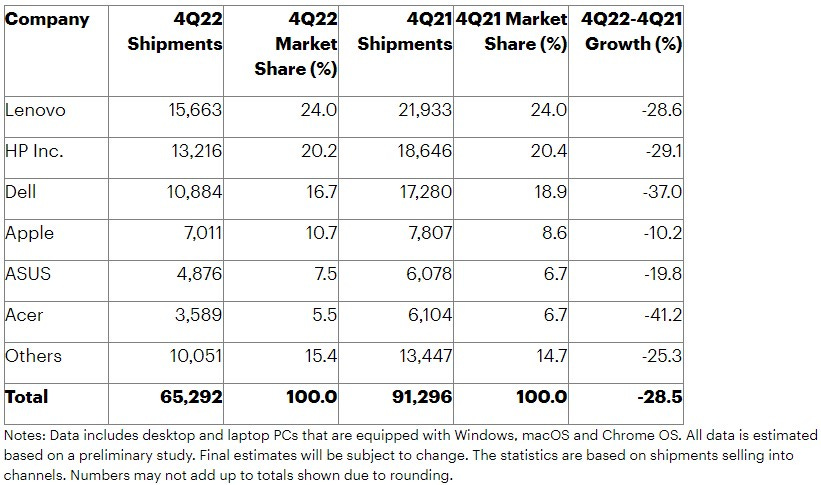
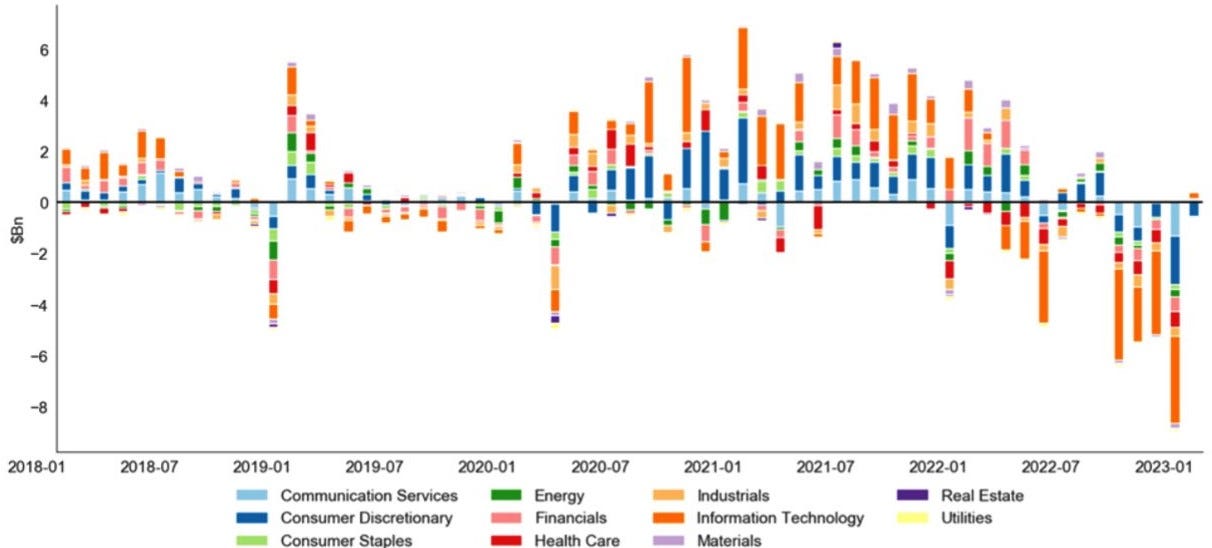
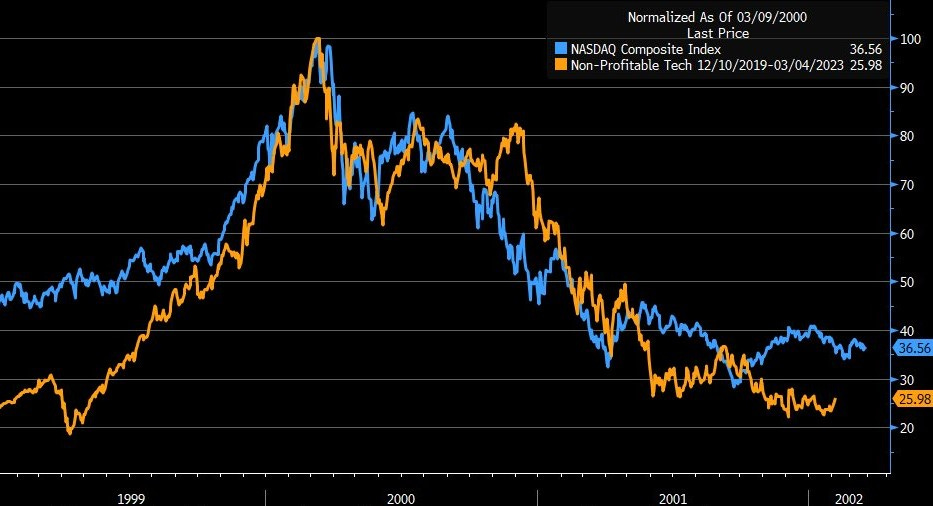
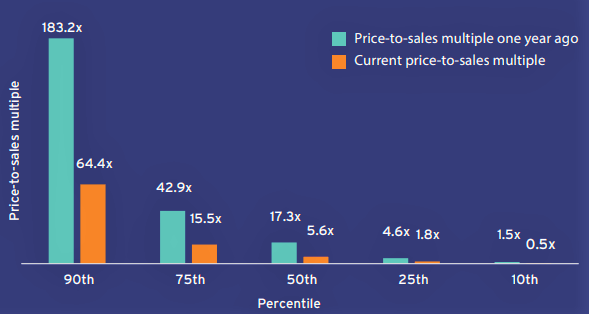
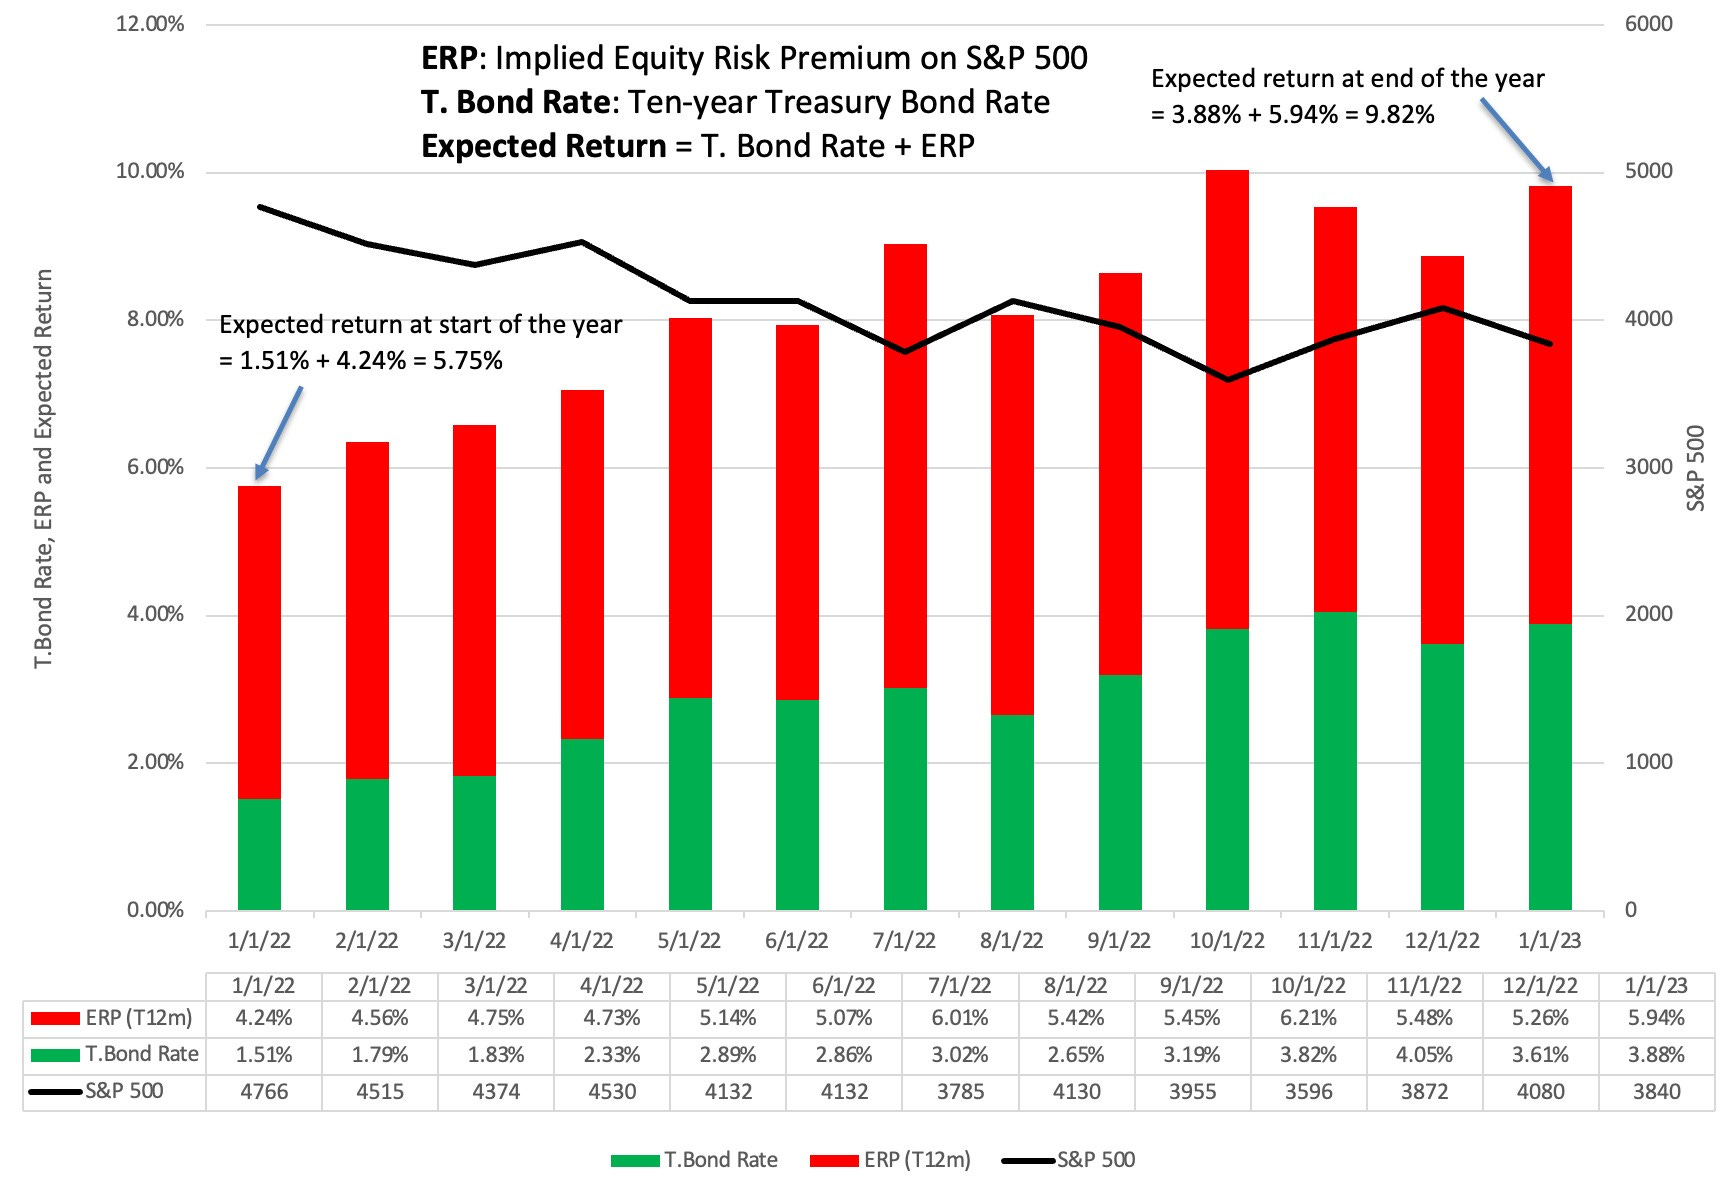
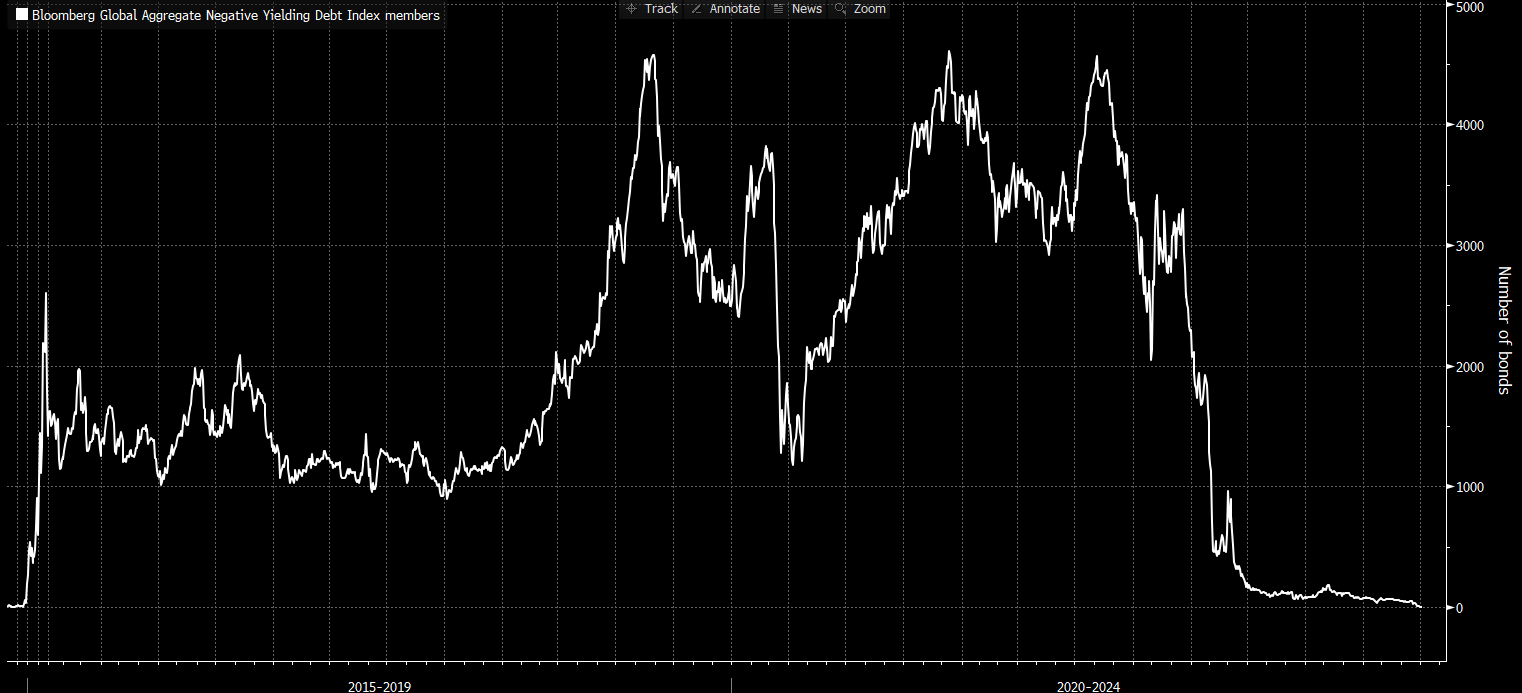
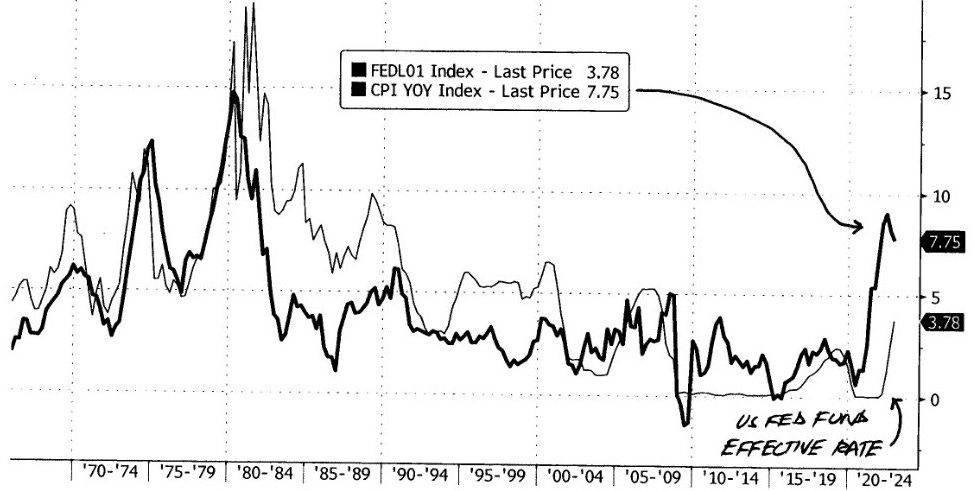
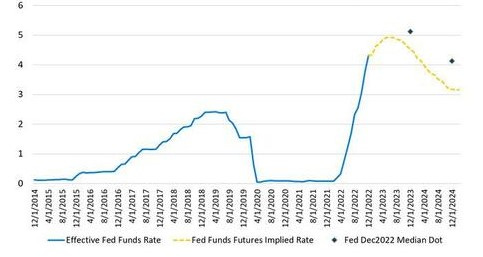
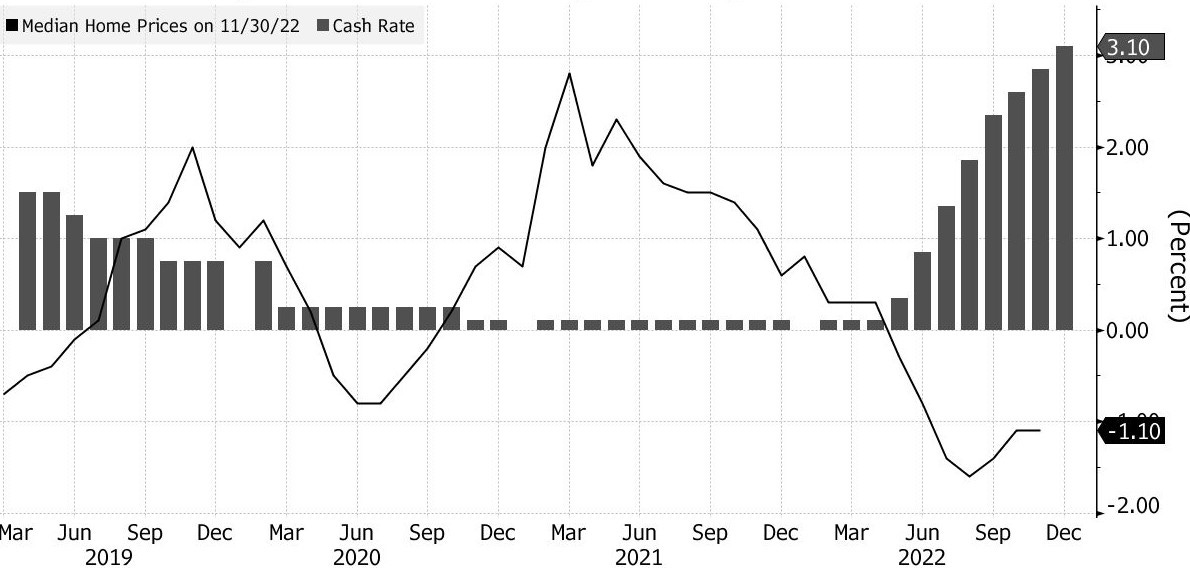
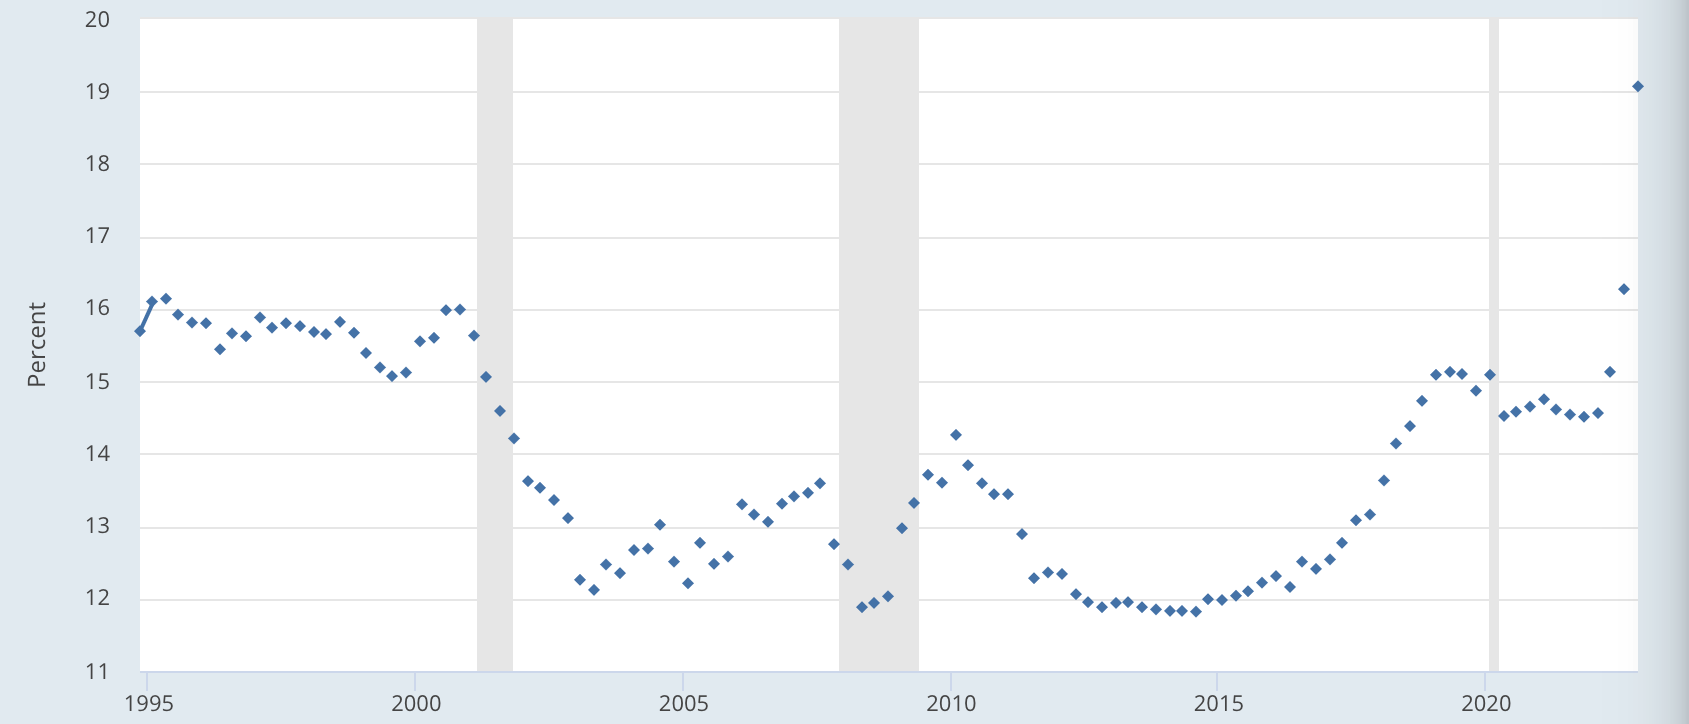
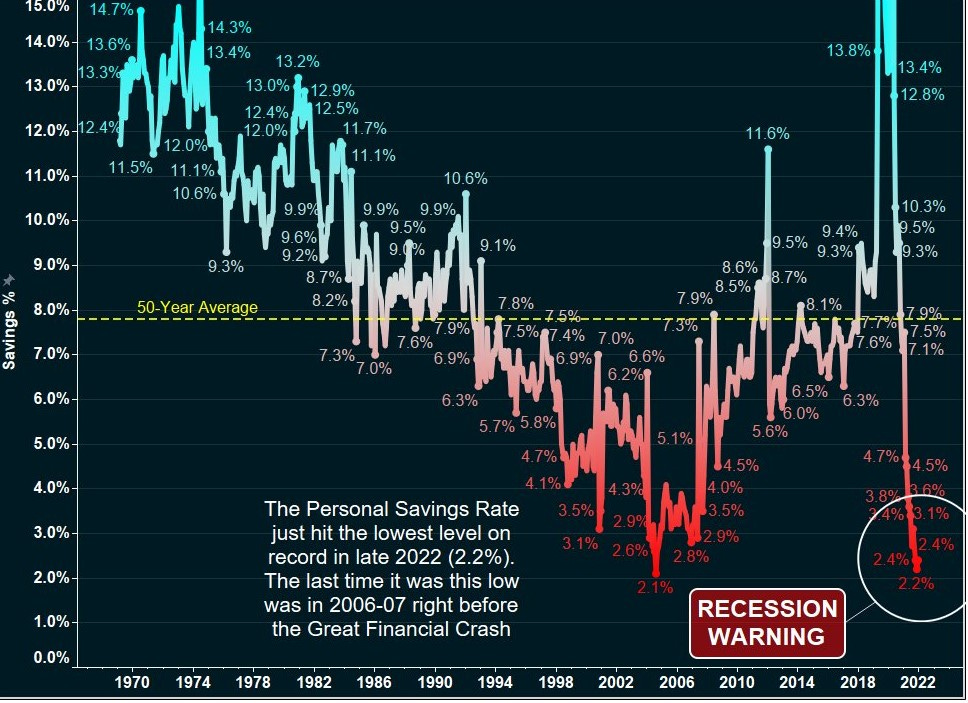
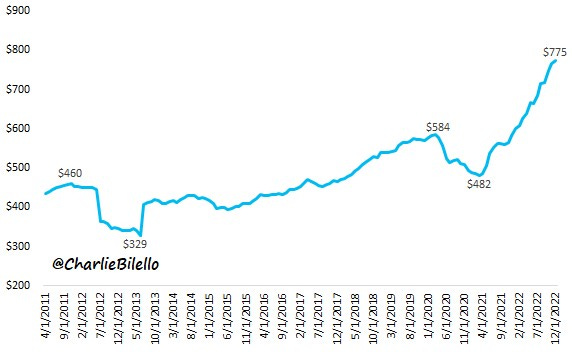
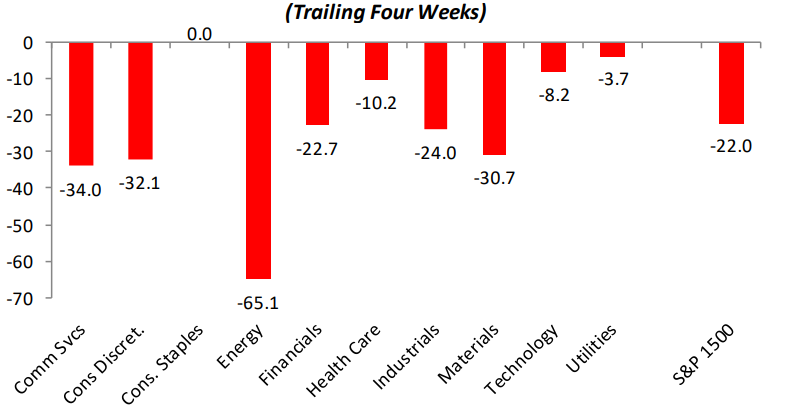
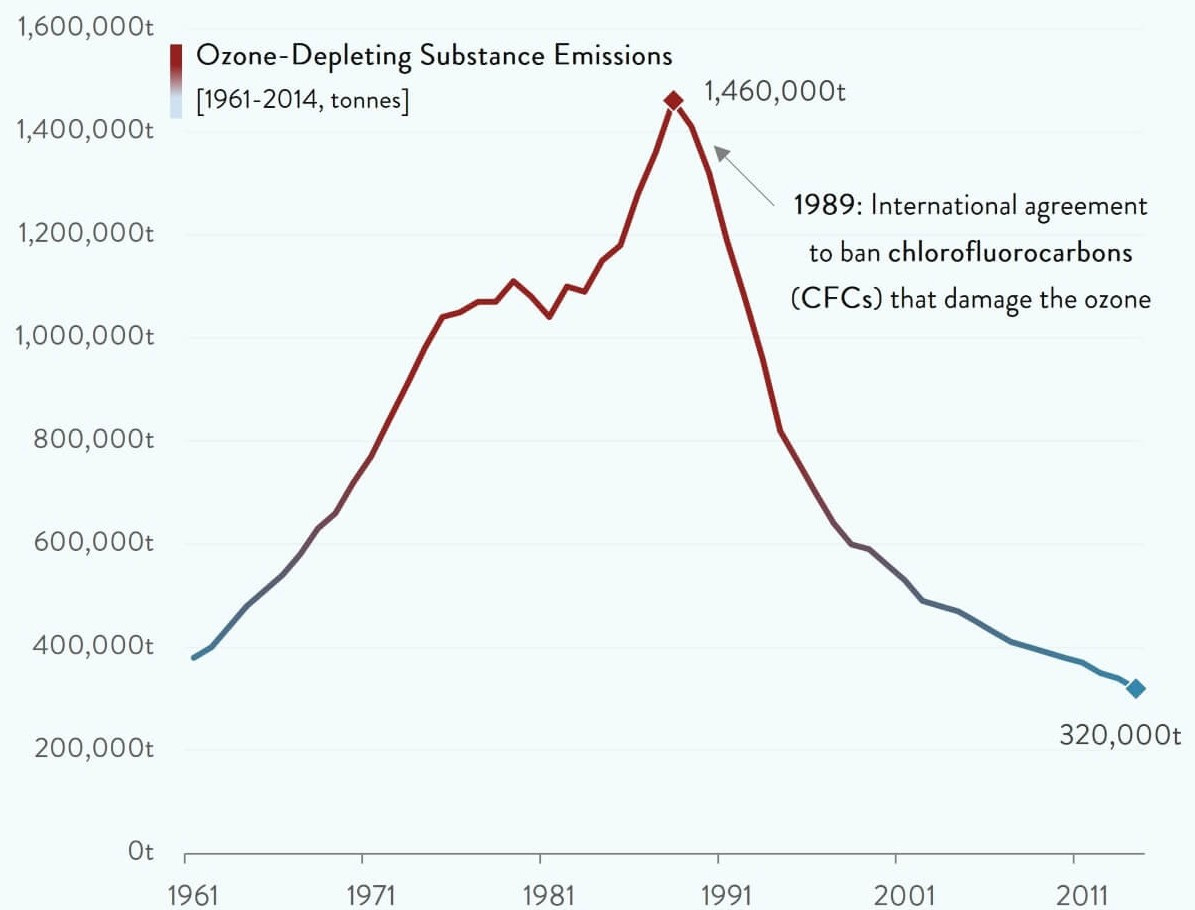
10k Words Equitable Investors January 2023 If there was a year in investment markets where swearing was justifiable, 2022 would be a great candidate. The FT shows us swearing reached new heights on company conference calls. Maybe swearing in 2023 will find a new peak as the feeling of greater uncertainty remains - just look at the IMF's plot. Gartner's estimate of a 28.5% year-on-year decline in global PC sales may cause a few to swear, at least privately. Net flows into tech, as charted by JP Morgan, were hammered right through to the end of 2022. Of course it was the unprofitable segment of tech that Charles Schwab's @LizAnnSonders shows taking the most heat. We can also see that pain in the price/sales multiple contractions highlighted by The Macro Compass' @MacroAlf. There can be no doubt the cost of capital has jumped - Professor Damodaran's expected equity return estimate has increased >4% while Bloomberg's negative yield bond chart lost its last member. Two different schools of thought fight it out over what the Fed needs to do to curb inflation - CLSA shows that when US inflation has spiked above 5%, the Fed had to lift rates to "within spitting distance" of the inflation peak; but DoubleLine is backing the bond market's lower implied rates over the Fed's expectations. Economist @C_Barraud picked up on the decline in Australian house prices as borrowing costs surge. Credit card rates are surging too, as per FRED data, and re: venture consulting sounded the alarm on personal savings in the US diving. The cost of debt is also a growing problem for governments, @CharlieBilello highlights. Looking forward to reporting season, Bespoke sees market expectations in the US have been pulled back across almost all sectors. FactSet's aggregate of S&P 500 earnings estimates shows a 3.9% decline is now the consensus for the December quarter - but the actual earnings growth rate has exceeded the estimated earnings growth rate at the end of the quarter in 38 of the past 40 quarters. Finally, some good news - chart brought to our attention the progressive healing of the ozone layer. Bull market in swearing - frequency of swearing on conference calls Source: AlphaSense, Financial Times
World Uncertainty Index - Ukraine invasion spike in red Source: IMF Global PC shipments in December quarter of CY2022 Source: Gartner Thematic net flows split (excluding ETFs) Source: JP Morgan, @wallstjesus Performance of non-profitable tech stocks (US) Source: Charles Schwab's @LizAnnSonders, Bloomberg Price-to-sales for VC-backed IPOs (US) Source: Pitchbook, Morningstar, @macroalf US Equity Risk Premium Source: Aswath Damodaran The last of the negative yielders Source: Bloomberg When US inflation has spiked above 5%, Fed Funds Effective Rate has had to follow Source: CLSA via @nomad_cap Fed Funds Rate - Market Expectations v Fed Projections
Source: DoubleLine
Australian home prices slide as borrowing costs surge
Source: CoreLogic, RBA, @C_Barraud
US credit card interest rates surge Source: FRED, Blockworks US personal savings rate hit the lowest level on record in late 2022 Source: re:venture consulting Interest expense on US public debt outstanding Source: @CharlieBilello
US S&P 1500 EPS revisions by sector - the sptread between positive and negative
S&P 500 quarterly earnings growth - estimates and actuals Source: FactSet The ozone layer is healing Source: Hegglin et al, Chartr
January Edition Funds operated by this manager: Equitable Investors Dragonfly Fund Disclaimer Nothing in this blog constitutes investment advice - or advice in any other field. Neither the information, commentary or any opinion contained in this blog constitutes a solicitation or offer by Equitable Investors Pty Ltd (Equitable Investors) or its affiliates to buy or sell any securities or other financial instruments. Nor shall any such security be offered or sold to any person in any jurisdiction in which such offer, solicitation, purchase, or sale would be unlawful under the securities laws of such jurisdiction. The content of this blog should not be relied upon in making investment decisions. Any decisions based on information contained on this blog are the sole responsibility of the visitor. In exchange for using this blog, the visitor agree to indemnify Equitable Investors and hold Equitable Investors, its officers, directors, employees, affiliates, agents, licensors and suppliers harmless against any and all claims, losses, liability, costs and expenses (including but not limited to legal fees) arising from your use of this blog, from your violation of these Terms or from any decisions that the visitor makes based on such information. This blog is for information purposes only and is not intended to be relied upon as a forecast, research or investment advice. The information on this blog does not constitute a recommendation, offer or solicitation to buy or sell any securities or to adopt any investment strategy. Although this material is based upon information that Equitable Investors considers reliable and endeavours to keep current, Equitable Investors does not assure that this material is accurate, current or complete, and it should not be relied upon as such. Any opinions expressed on this blog may change as subsequent conditions vary. Equitable Investors does not warrant, either expressly or implied, the accuracy or completeness of the information, text, graphics, links or other items contained on this blog and does not warrant that the functions contained in this blog will be uninterrupted or error-free, that defects will be corrected, or that the blog will be free of viruses or other harmful components. Equitable Investors expressly disclaims all liability for errors and omissions in the materials on this blog and for the use or interpretation by others of information contained on the blog |
 Source: Bespoke Investment Group
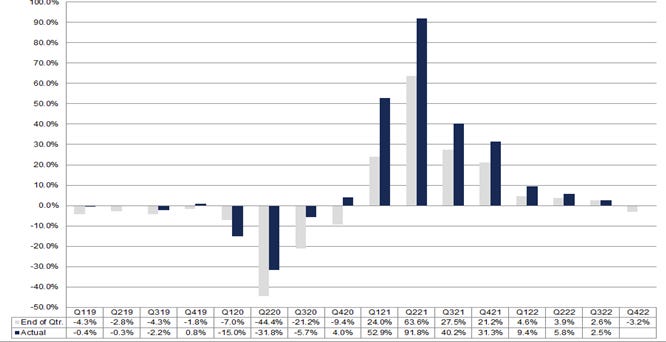

10 Feb 2023 - Hedge Clippings |10 February 2023
|
|
|
|
Hedge Clippings | 10 February 2023 As expected, on Tuesday the RBA did what everyone expected, and what they had to, raising rates by 0.25% in the sharpest and fastest series of increases in recent (and probably longer) memory. Even though expected by 100% of market economists, investors didn't take too kindly to it, with the ASX falling almost half a percent on the day, and after a brief rally on Wednesday, continuing to fall since. It wasn't what the RBA did that upset the market, but what RBA Governor Philip Lowe said - particularly, as we always point out - in the last paragraph (and in this case the last sentence) or so of their statement: "The board remains resolute in its determination to return inflation to target and will do what is necessary to achieve this." That's RBA speak for "expect more rates rises to come," so unless things on the inflation front change direction quickly, 3.85% seems a forgone conclusion, possibly by May or June, and with every chance of that tripping the 4% mark in the second half of the year. Amid all the forecasts of widespread mortgage stress and damage to household budgets, the hard and nasty truth is that's what the RBA is aiming at - or at least to force consumers to rein in spending - to try to quell inflation. Unfortunately, it's not a level playing field in mortgage land, and to quote Bill Gates, "Life's not fair. Get used to it". Of course, Bill can afford to say that, but the RBA has a problem with the un-level field when using mortgage rates - as only one third of households have a mortgage - to tame inflation. The other two thirds are less, or not impacted, so they're probably still spending, even if their morning flat white is now costing them over $4 a pop. But there's more to the un-level field: Amongst the one third of households with mortgages, there are those who are more stressed than others - either by virtue of being on lower incomes, having only recently taken out a mortgage thanks to the RBA's "no rate rise until 2024" prediction, those about to come off a low fixed rate onto a higher variable one, or those with smaller savings to dip into to buffer to rise. Assuming (this is a guess) 20% of all mortgages are in the above categories, that's less than 7% of the overall population. At 50%, it rises to just over 15% of the total. This may sound as if we're being callous or uncaring. Far from it. The point is that the RBA needs to change the spending habits of the majority, not just the minority, a point they acknowledge (along with the lagging effect of higher rates) in the penultimate paragraph of their February Statement on Monetary Policy. So while they may be mindful of the uneven pain they're causing on the un-level playing field of life, "The Board's priority is to return inflation to target." And that's not going to happen at least until Santa's been around again (if we have a recession) or possibly after he's been back twice (if there's a soft landing). So, as Bill said, "get used to it". Over to markets and fund performance: As everyone knows, last year's outbreak of inflation was a shock to everyone, including the RBA, as was Ukraine, (except to Putin). The market tanked for the first nine months of the year and has since recovered strongly, such that the 12 month performance of the ASX200 Total Return to the end of January was +12.21%, significantly better than the S&P500 equivalent of -8.22% for an out-performance of over 20%. AFM's Peer Group Comparison tables show a similar, although more variable pattern, such that over both three and six months to the end of January, ALL Peer Groups, with one exception (Alternatives, which includes Crypto funds) were in positive territory. The top performing Peer Group over 12 months was the Equity Long Large Cap group, which returned just over 8% on average, with 25% of those out-performing the ASX200 TR and the top performer, the Lazard Select Australian Fund returning 32%. |
|
|
News & Insights Market Commentary | Glenmore Asset Management Cycle is not a dirty word | Airlie Funds Management January 2023 Performance News 4D Global Infrastructure Fund (Unhedged) Bennelong Australian Equities Fund L1 Capital Long Short Fund (Monthly Class) |
|
|
If you'd like to receive Hedge Clippings direct to your inbox each Friday
|

10 Feb 2023 - Performance Report: ASCF High Yield Fund
[Current Manager Report if available]

10 Feb 2023 - Performance Report: 4D Global Infrastructure Fund (Unhedged)
[Current Manager Report if available]

10 Feb 2023 - Review: The Price of Time (The Real Story of Interest) by Edward Chancellor
|
Review: The Price of Time (The Real Story of Interest) by Edward Chancellor Channel Capital January 2023 For professional investors and advisers only Edward Chancellor was already the author of two books in my top ten investment books list; Devil Take the Hindmost: A History of Financial Speculation and Capital Returns (the latter is a compendium of investment letters written by Marathon Asset Management and edited by Chancellor) and I would now add a third to that list. The Price of Time: The Real Story of Interest is an extraordinary book which illustrates the problems created by setting interest rates too low and by the rapid expansion of credit through the use of historical examples ranging from John Law's Mississippi Scheme to the Wall Street Crash and Japanese bubble of the nineteen eighties. Interest rates are the anchor for the valuation of asset prices and once they reach zero, any valuation can usually be justified, and bubbles occur. These bubbles have ALWAYS burst with enormous economic costs but that is only part of the damage wrought by low interest rates. As Chancellor notes today's ultra-low interest rates have contributed "to many of our woes, whether the collapse of productivity growth, unaffordable housing, rising inequality, the loss of market competition or financial fragility. Ultra-low rates also seemed to play some role in the resurgence of populism". As much as mainstream media would like you to believe that all of the UK's economic woes can be pinned on Liz Truss's mini budget, Chancellor explains that these issues have been years in the making and can be mostly traced back to the faulty economic thinking of the central banks. This book should be required reading for anyone involved in financial policy making from politicians to treasury officials and to central bankers. If I thought they would read it, I would willingly buy a copy for Andrew Bailey and the rest of the Monetary Policy Committee but I suspect they have little interest in reading anything which conflicts with the current economic orthodoxy no matter how wrong it has been. Author: Ian Lance, Fund Manager |
|
Funds operated by this manager: CC Redwheel Global Emerging Markets Fund, CC Redwheel China Equity FundKey information: No investment strategy or risk management technique can guarantee returns or eliminate risks in any market environment. Past performance is not a guide to future results. The prices of investments and income from them may fall as well as rise and an investor's investment is subject to potential loss, in whole or in part. Forecasts and estimates are based upon subjective assumptions about circumstances and events that may not yet have taken place and may never do so. The statements and opinions expressed in this article are those of the author as of the date of publication, and do not necessarily represent the view of Redwheel. This article does not constitute investment advice and the information shown is for illustrative purposes only. |

9 Feb 2023 - Emerging Markets: December quarter shows positive signs after a challenging 2022
|
Emerging Markets: December quarter shows positive signs after a challenging 2022 Pendal January 2023 |
|
IT was a difficult year for emerging equity markets in 2022, but the December quarter was more positive despite ongoing growth and inflation pressures in key economies. Last year Russia's invasion of Ukraine drove prices of key commodities sharply higher in an environment where inflation was already high and the outlook for interest rates was difficult. This was combined with ongoing economic weakness in China. The MSCI EM Index returned -20.1% in USD terms. Here is a recap of the main EM themes in 2022 and what we learned in the closing months of the year. RussiaIn Russia, the equity market in Moscow closed in February 2022 and did not re-open in a meaningful sense. With foreigners banned from selling, capital controls imposed and tight financial sanctions on the country, it became impossible for foreign investors to recover money from Russian equities. The impact of wide economic and trade sanctions mean the fundamental value of Russian equities is highly uncertain. GDRs and ADRs of Russian stocks have been suspended. MSCI deleted the Russia index from MSCI EM in March with a zero valuation. Growth countriesDespite rising global interest rates and bond yields, growth surprised to the upside in several traditionally high-beta, current account economies. Brazil, Indonesia, India and Mexico were among the better-performing major emerging markets in 2022. MSCI country index returns were +14.2% in Brazil, + 3.6% in Indonesia, -2% in Mexico and Brazil and Mexico benefited from strong exports, while central bank currency support allowed domestic demand growth in India and Indonesia. Meanwhile, higher energy prices, a sharp slowdown in global technology spending and a worse outlook for global growth meant that Korea and Taiwan both underperformed. MSCI country indices returned -29.4% and -29.8% respectively (in USD terms). ChinaDespite improving credit and monetary aggregates data, the Chinese economy remained weak in 2022 as policymakers prepared to stimulate. The key causes of the weakness were the ongoing policy-driven slowdown in the real estate sector and the impact of Covid lockdowns. In the final quarter of the year - facing street protests and mounting evidence of the negative economic effect of lockdowns - Chinese authorities began a controlled re-opening of the economy. MSCI China returned -21.9% in USD terms in 2022, but Chinese markets finished the year with a rising index and a sense of optimism Positive signs in December quarterThe fourth quarter of 2022 was more positive for emerging and global equity markets, despite ongoing growth and inflation pressures in key economies. October was difficult, but a shift to a more growth-friendly set of policies in China - and a sense that the outlook for US monetary policy is more positive - led to a stronger finish to the year. In the quarter MSCI EM Index returned +9.7% in USD terms. China's economy remained weak despite increasingly aggressive credit and monetary stimulus. But markets focused on the more positive change in policymaker intentions. MSCI China returned +13.5% in the quarter (USD terms). The outlook for US monetary policy also improved in the quarter. Although we saw interest rate hikes by the Federal Reserve, US CPI continued to trend lower in October and November. In early November the US ten-year bond yield moved below policy interest rates. This proved supportive for some emerging markets that had previously been held back by capital outflows. Which countries are well placedIn the December quarter we saw strong MSCI index USD returns in Colombia (+19.7%), South Africa (+18.3%) and Peru (+17.4%). Previous winners, especially those with high commodity exposure, generally underperformed in the quarter with softer commodity prices through the middle of the period and reallocation of investment flows towards China. MSCI Brazil returned + 2.4% and MSCI Indonesia -3.6% (both USD terms). The weaker oil price hit the Arab Gulf markets harder with MSCI Saudi Arabia returning -7.6%. UAE and Qatar also had negative returns. Author: James Syme, Paul Wimborne, and Ada Chan, co-managers of Pendal's Global Emerging Markets Opportunities Fund |
|
Funds operated by this manager: Pendal Focus Australian Share Fund, Pendal Global Select Fund - Class R, Pendal Horizon Sustainable Australian Share Fund, Pendal MicroCap Opportunities Fund, Pendal Sustainable Australian Fixed Interest Fund - Class R, Regnan Global Equity Impact Solutions Fund - Class R, Regnan Credit Impact Trust Fund |
|
This information has been prepared by Pendal Fund Services Limited (PFSL) ABN 13 161 249 332, AFSL No 431426 and is current as at December 8, 2021. PFSL is the responsible entity and issuer of units in the Pendal Multi-Asset Target Return Fund (Fund) ARSN: 623 987 968. A product disclosure statement (PDS) is available for the Fund and can be obtained by calling 1300 346 821 or visiting www.pendalgroup.com. The Target Market Determination (TMD) for the Fund is available at www.pendalgroup.com/ddo. You should obtain and consider the PDS and the TMD before deciding whether to acquire, continue to hold or dispose of units in the Fund. An investment in the Fund or any of the funds referred to in this web page is subject to investment risk, including possible delays in repayment of withdrawal proceeds and loss of income and principal invested. This information is for general purposes only, should not be considered as a comprehensive statement on any matter and should not be relied upon as such. It has been prepared without taking into account any recipient's personal objectives, financial situation or needs. Because of this, recipients should, before acting on this information, consider its appropriateness having regard to their individual objectives, financial situation and needs. This information is not to be regarded as a securities recommendation. The information may contain material provided by third parties, is given in good faith and has been derived from sources believed to be accurate as at its issue date. While such material is published with necessary permission, and while all reasonable care has been taken to ensure that the information is complete and correct, to the maximum extent permitted by law neither PFSL nor any company in the Pendal group accepts any responsibility or liability for the accuracy or completeness of this information. Performance figures are calculated in accordance with the Financial Services Council (FSC) standards. Performance data (post-fee) assumes reinvestment of distributions and is calculated using exit prices, net of management costs. Performance data (pre-fee) is calculated by adding back management costs to the post-fee performance. Past performance is not a reliable indicator of future performance. Any projections are predictive only and should not be relied upon when making an investment decision or recommendation. Whilst we have used every effort to ensure that the assumptions on which the projections are based are reasonable, the projections may be based on incorrect assumptions or may not take into account known or unknown risks and uncertainties. The actual results may differ materially from these projections. For more information, please call Customer Relations on 1300 346 821 8am to 6pm (Sydney time) or visit our website www.pendalgroup.com |

8 Feb 2023 - Glenmore Asset Management - Market Commentary
|
Market Commentary - December Glenmore Asset Management January 2023 Global equity markets were weaker in December. In the US, the S&P 500 fell -5.9%, the Nasdaq declined -8.7%, whilst the FTSE 100 (UK) outperformed (given its lower tech and growth exposure), falling just -1.6%. The driver of the declines was persistent inflation and hawkish commentary from central banks, which disappointed investors hoping for an end to the interest rate rises that have been the key headwind for equities in 2022. The ASX All Ordinaries accumulation index fell -3.3% in December. Whilst all sectors produced negative returns, mining was again the best performer boosted by expectations that the re-opening of China's economy will lift demand for commodities. Consumer discretionary, IT and REIT's all underperformed. In bond markets, the key US 10-year bond rate rose +10 basis points to close at 3.83%, whilst in Australia, the 10-year bond rate rose more materially, up +52bp to close at 4.05%. The A$/US$ was flat at US$0.68. Review of global stock market indices in 2022 The table below shows how some of the relevant equity indices performed in 2022. Some of the key takeaways:
Looking forward to 2023, our view is that having underperformed materially in 2022, small/mid cap stocks on the ASX in particular, are poised to provide some excellent opportunities given historically this part of the ASX has been a very profitable segment, due to small/mid-caps typically having superior earnings growth prospects vs large caps. In terms of the growth and technology sectors, we believe that whilst much of the sell off of highly priced stocks has likely played out, given our preference for established business generating profits and cashflow, we remain cautious on this part of the market. Funds operated by this manager: |

7 Feb 2023 - Tips on Managing your own Super
|
Tips on Managing your own Super Marcus Today January 2023 |
|
I had a question about Portfolio Management from a Member. I sent him this. It might interest you. Two processes run side-by-side:
STOCK PICKING AND TIMING Stock picking and timing involves a few basic tenets that you might adopt. They include (and apologies for the simplicity):
MANAGING MARKET RISK As you probably know by now, I believe you can time the market and everyone who says you can't is an inexperienced amateur that has heard too many Buffett quotes or is a financial professional that has an interest in you doing nothing (because they don't have to make decisions but still get your fee). You can manage market risk by raising and lowering your cash weighting. One of the great advantages of managing your own money as an individual without oversight is that you can go to 100% cash. Something the big funds could never do. This allows you to protect capital in a bear market, whereas most of the major funds have no choice, they have a mandate which forces them to hold the market through thick and thin. They will play with a small cash weighting (5-15%?), but it is immaterial come a big market sell-off. They will never get out of the market in a bear market. You can. How much cash you hold is a daily debate, and there are no rules. I simply wake up every morning and make a decision. I rarely get scared by the market but will rapidly run up cash levels if I think its going wrong. And reverse it again when the squall is over. When it comes to running up the cash, I may sell a few stocks outright (the ones that are not performing) but will essentially take the top off every stock rather than stock pick. The main issue is to run up the cash and not get cute about which stocks to do it with. When it comes to this decision - read the Strategy section - it's what it's all about! Author: Marcus Padley, Founder of Marcus Today |
|
Funds operated by this manager: Marcus Today Equity Income SMA, Marcus Today Growth SMA
|

6 Feb 2023 - New Funds on Fundmonitors.com
|
New Funds on FundMonitors.com |
|
Below are some of the funds we've recently added to our database. Follow the links to view each fund's profile, where you'll have access to their offer documents, monthly reports, historical returns, performance analytics, rankings, research, platform availability, and news & insights. |
|
|
|||||||||||||||||||
| Harbour T. Rowe Price Global Equity Fund | |||||||||||||||||||
|
|||||||||||||||||||
 |
|||||||||||||||||||
| Cordis Global Medical Technology Fund | |||||||||||||||||||
|
|||||||||||||||||||
| View Profile | |||||||||||||||||||
 |
|||||||||||||||||||
|
Rixon Income Fund |
|||||||||||||||||||
|
|||||||||||||||||||
| View Profile | |||||||||||||||||||
|
Want to see more funds? |
|||||||||||||||||||
|
Subscribe for full access to these funds and over 700 others |


6 Feb 2023 - Cycle is not a dirty word
|
Cycle is not a dirty word Airlie Funds Management January 2023 |
|
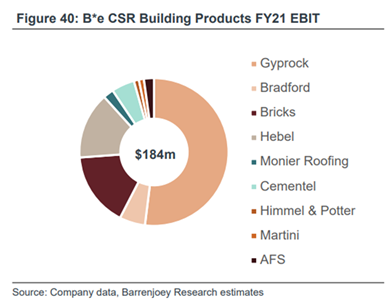
January 2023 In a perfect world, every stock we own would be net cash, generate high returns, be run by a world-class management team, and cheap. In practice, the presence of the first three criteria usually means that the investment falls over at the last criterion. Just like we don't tend to stumble across $500k houses in Point Piper with Sydney Harbour views, the stock market is rational: it usually bids the best businesses up to the highest price. This means we usually have to compromise on something. The one thing we never compromise on is the balance sheet - a business must have the appropriate financial structure for its business model or else we equity investors may find out exactly where we rank in the capital stack! Assuming the balance sheet is appropriate, we rely on our judgement as investors to juggle the trade-offs between business quality, management quality and valuation. One hunting ground where we tend to find businesses with attractive valuations is when everyone is very worried about "the cycle". For example, with a consensus view that a recession looks likely in the US, Europe and potentially Australia, we are seeing opportunities in businesses that are leveraged to the building cycle. The first thing to figure out when sifting through these ideas is whether the business sells a commodity. In investing it pays to have an open mind: cyclical businesses that sell commodity products can be great investments; one need look no further than BHP to find such an example. However, we have a few requirements. Firstly, we want to see a pristine, (preferably net cash) balance sheet. Returns are outside the company's control - typically dictated by the level of demand for a commodity and hence the price. Financial leverage combined with operating leverage can mean lights out. Second, we look for evidence of good industry structure. This means as few players as possible. Very few things are "pure" commodities. Often there are hidden barriers to entry - start-up costs, distribution networks or captured supply chains - that keep industries rational and cosy. This seems particularly prevalent in Australia. The tyranny of distance, both from global supply chains and having a small population spread across a large country, means a fixed profit pool that often doesn't support a third or fourth entrant. Two or three rational market players can see everyone making OK returns on their capital. Finally, we want a compelling valuation. If there's no intangible franchise value in a business, if it just makes bog-average products, you don't want to pay a high price for it. Luckily, the tendency for investors to tie themselves in knots trying to forecast where we are in a cycle tends to throw off frequent opportunities to buy cyclical businesses at good prices. Unluckily, those opportunities usually only come around when the cycle looks particularly on the nose. As such, we find you have to be brave and also be prepared to be early (potentially very early!), and willing to add to a position if it continues to fall as the cycle deteriorates. The risk in investing in cyclical commodity businesses is that, as Howard Marks says, to be too far ahead of your time is indistinguishable from being wrong. It is for this reason that we rarely make these initial investments our largest positions, preferring a smaller position size that we can add to should the leading indicators deteriorate further. One business we feel ticks these boxes is CSR , a recent addition to the portfolio. The company manufactures and distributes plasterboard, aerated concrete, bricks, fibre cement, insulation and other products under a range of different brands. CSR also has a 25% effective interest in the Tomago aluminium smelter in Newcastle. We are under no illusions as to the underlying quality of this business. With perhaps the exception of aerated concrete, where CSR has exclusive rights to the Hebel brand, the bulk of what CSR makes, and sells are commodity products. Returns will be cyclical, dominated by the level of residential building activity in Australia. Our thesis in owning CSR is that (a) the value of the surplus property underpins the bulk of the valuation, such that we aren't paying a very high residual price for the building products business, and (b) this building products business is probably a shade higher quality than it has been historically; mid-cycle margins and returns for CSR's building products should be higher this decade than the prior decade due to improving industry structure. Throwing in a rock-solid balance sheet ($142m net cash) makes the investment proposition stack up for us, albeit this is not without risks. Our valuation is based on our assessment of mid-cycle EBIT; however, we will be wrong on this assessment if industry rationality breaks down as demand falls (that is, if we see evidence of price-cutting to chase market share). Building products business: average quality but industry structure has improvedFrom an earnings perspective, the three most important businesses in CSR's Building Products portfolio are plasterboard (Gyprock), Bricks and Hebel (aerated concrete), making up a combined c75% of EBIT.
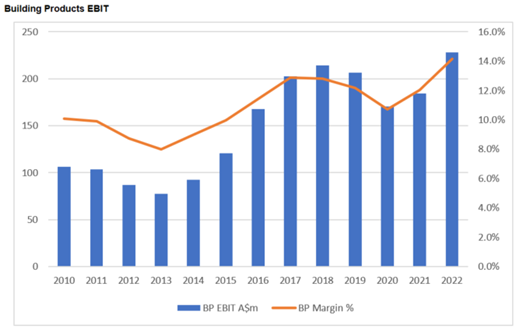
CSR has a dominant market share position in each of the plasterboard, brick and aerated concrete markets as a function of recent industry consolidation (Gyprock, PGH Bricks) and product exclusivity (Hebel). As per the below chart, EBIT margins are highly cyclical: in a great year (like FY23F) CSR is on track to make a 14% EBIT margin; in a bad year (2013) it made only 8% EBIT margins. We believe a return to these lows is unlikely for reasons we step through below. As such, we forecast trough EBIT margins of 10% rather than a historic 8%, and mid-cycle EBIT margins of 12% rather than a historic 10%.
Plasterboard is the most important business, accounting for over 50% of the building products' EBIT. East-coast plasterboard is a three-player market, with CSR and Knauf enjoying c35-40% market share each, and ETEX 20%-30%. Boral used to be the main player against which CSR competed; however, Knauf recently effectively bought Boral out of its local assets in 2021. Boral historically had a reputation as the competitor you didn't want in any market, as it leant heavily on price to chase market share during downturns. This weighs on returns for all players. We view the exit of Boral from plasterboard as a net positive for industry rationality. While plasterboard is undoubtedly a cyclical business, our discussion with industry participants suggests plasterboard is at the lower end of cyclicality - the plasterboard cost base is fairly variable as you can pull shifts off when demand declines, protecting EBIT margins. We believe EBIT margins vary by only a few percentage points through the cycle. The main driver of our assumption that CSR is unlikely to retest its prior EBIT margin lows is the improved industry structure in bricks. The Australian bricks market has gone from a three-player market to two after CSR bought Boral out of their joint venture in late 2016. A bricks business has a huge fixed-cost base; a brick kiln runs 24/7, so it's hard to pull costs out in a downturn. Conversations with industry participants suggested CSR's bricks business was breakeven at best during the prior housing downturn of 2010-2013. Management is also proactively managing the asset base to recycle unrequired brick sites into the property portfolio for alternative uses. For example, CSR were able to close a brick manufacturing site at Darra in Queensland and push the capacity through an upgrade at their NSW site in Oxley, freeing up the Darra land to be redeveloped and sold. We estimate Darra could generate over $100m in EBIT for the business over several years via the sale of subdivided land. This network optimisation reduces the risk that high-fixed-cost brick plants will swing to EBIT or cash loss-making at the bottom of the cycle. These improvements in industry structure lead us to an estimate of mid-cycle EBIT for building products of c$200m. (Note the building products business is on track for >$250m EBIT this year.) Deducting the full corporate costs of c$25m from this division gives mid-cycle group EBIT of $175m ex-aluminium. Property underpins 65% of market capitalisationCSR's property division looks to maximise financial returns of surplus former manufacturing sites and industrial land. The bulk of the value of this division was a 'gift from the gods': in what was surely one of the most sizeable value transfers in recent Australian corporate history, CSR was able to acquire Boral's 40% interest in its brick JV for $126m in 2016. Extraordinarily, this included 12 manufacturing operations and mothballed sites, including the aforementioned Darra site, as well as 140ha of developable land at Badgerys Creek in Western Sydney. This is valuable land, located on the southern boundary of the future Western Sydney Airport. CSR recently sold a small parcel of this land at $4.5m/ha, implying the remaining site could be worth >$600m. Cheers, Boral! This episode is another reminder of why we put a huge emphasis on the quality of a management team. It's not always around the value creation they can achieve, but also avoiding the significant value destruction that can occur if a business is poorly run. CSR have had their total "as is" property book independently valued at $1.5bn ($1.1bn for 450ha of Western Sydney property, and $400m for additional freehold properties), which compares to a market capitalisation of $2.3bn. While this value will be realised over the long term via redevelopment and sale of surplus land, this implies a residual value for the business of c$800m, which is cheap when set against our estimate of mid-cycle EBIT of $175m (4.5x EBIT). We note peer Fletcher Building currently trades on just under 8x arguably peak-cycle EBIT. This also ignores any earnings from aluminium. To us, CSR is not a particularly high-quality business, and the cycle is clearly unsupportive from here. However, we believe there has been an improvement in the quality of the business as a result of favourable industry consolidation, and see compelling value in the combination of OK assets, solid property underpinning, and a net cash balance sheet that provides optionality through a downturn. Author: Emma Fisher, Portfolio Manager Funds operated by this manager: Important Information: Units in the fund(s) referred to herein are issued by Magellan Asset Management Limited (ABN 31 120 593 946, AFS Licence No. 304 301) trading as Airlie Funds Management ('Airlie') and has been prepared for general information purposes only and must not be construed as investment advice or as an investment recommendation. This material does not take into account your investment objectives, financial situation or particular needs. This material does not constitute an offer or inducement to engage in an investment activity nor does it form part of any offer documentation, offer or invitation to purchase, sell or subscribe for interests in any type of investment product or service. You should obtain and consider the relevant Product Disclosure Statement ('PDS') and Target Market Determination ('TMD') and consider obtaining professional investment advice tailored to your specific circumstances before making a decision to acquire, or continue to hold, the relevant financial product. A copy of the relevant PDS and TMD relating to an Airlie financial product or service may be obtained by calling +61 2 9235 4760 or by visiting www.airliefundsmanagement.com.au. Past performance is not necessarily indicative of future results and no person guarantees the future performance of any financial product or service, the amount or timing of any return from it, that asset allocations will be met, that it will be able to implement its investment strategy or that its investment objectives will be achieved. This material may contain 'forward-looking statements'. Actual events or results or the actual performance of an Airlie financial product or service may differ materially from those reflected or contemplated in such forward-looking statements. This material may include data, research and other information from third party sources. Airlie makes no guarantee that such information is accurate, complete or timely and does not provide any warranties regarding results obtained from its use. This information is subject to change at any time and no person has any responsibility to update any of the information provided in this material. Statements contained in this material that are not historical facts are based on current expectations, estimates, projections, opinions and beliefs of Airlie. Such statements involve known and unknown risks, uncertainties and other factors, and undue reliance should not be placed thereon. Any third party trademarks contained herein are the property of their respective owners and Airlie claims no ownership in, nor any affiliation with, such trademarks. Any third party trademarks that appear in this material are used for information purposes and only to identify the company names or brands of their respective owners. No affiliation, sponsorship or endorsement should be inferred from the use of these trademarks.. This material and the information contained within it may not be reproduced, or disclosed, in whole or in part, without the prior written consent of Airlie. |