NEWS

18 Mar 2022 - Why epoch-defining AI is today's most important investment theme
|
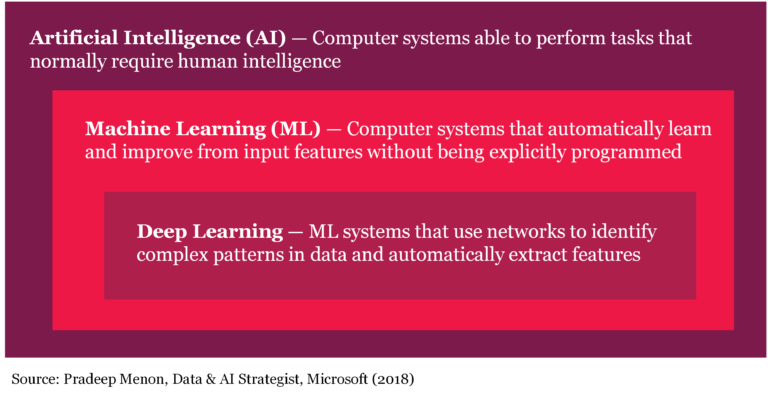
Why epoch-defining AI is today's most important investment theme (and the safest way to profit) Summary of Whitepaper Montaka Global Investments March 2022 Most investors are aware that artificial intelligence, or AI, is an important transformation. But many still underestimate the sheer world and life-changing power of this revolution and its investment potential. AI will recast and refashion every aspect of life: how we consume, how we work, how we monitor industrial machines, how we deliver healthcare, how wars are won, and how we solve climate change. Not only is software eating the world, but it is becoming a lot smarter at an accelerating rate and will continue to do so. Why? Because of AI - and more specifically, machine learning (ML), the most common and practically applicable subset of AI today.
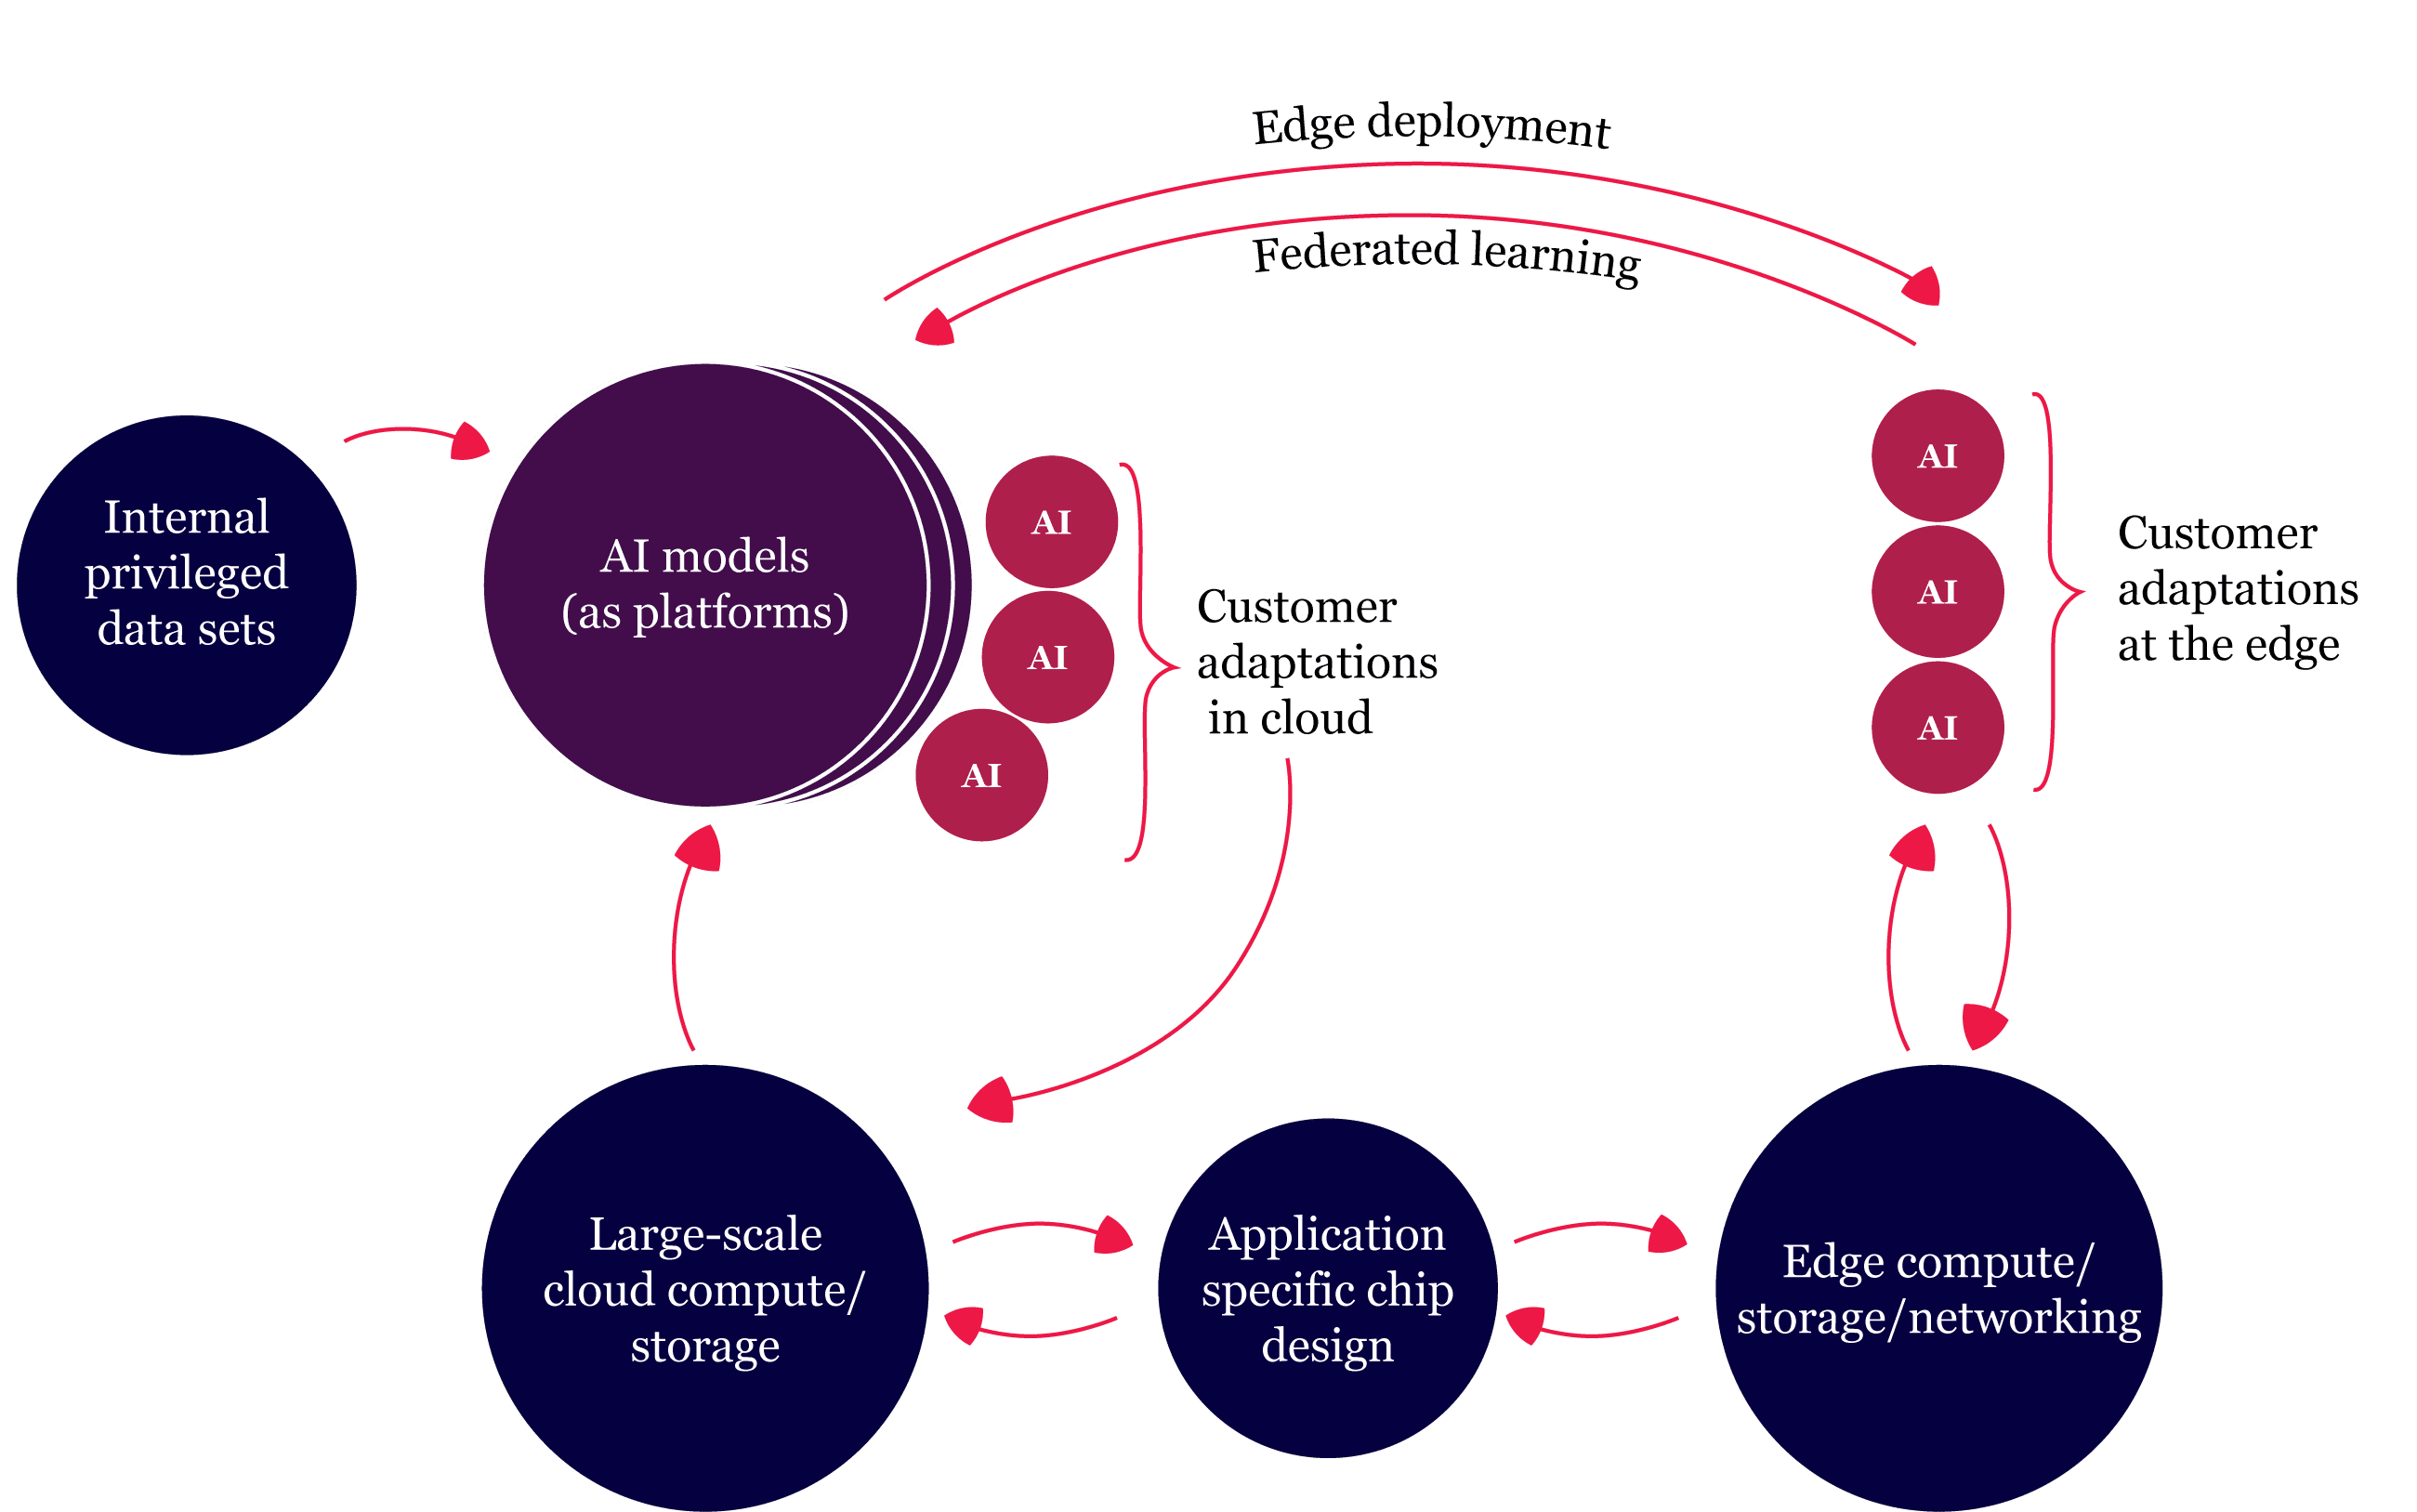
There are myriad ways investors can profit from this AI transformation, but Montaka believes the world's leading cloud computing providers, or 'hyperscalers', particularly Amazon, Microsoft and Alphabet (owner of Google) are one of the safest and surest ways to win. Many investors perceive these mega-tech businesses as 'well-understood', 'mature' and sometimes even 'boring'. We disagree. We believe AI will spark a new phase of hypergrowth for these companies that will take investors by surprise and trigger a big re-rating of their shares. The hyperscalers are uniquely positioned to create an 'AI fly-wheel'
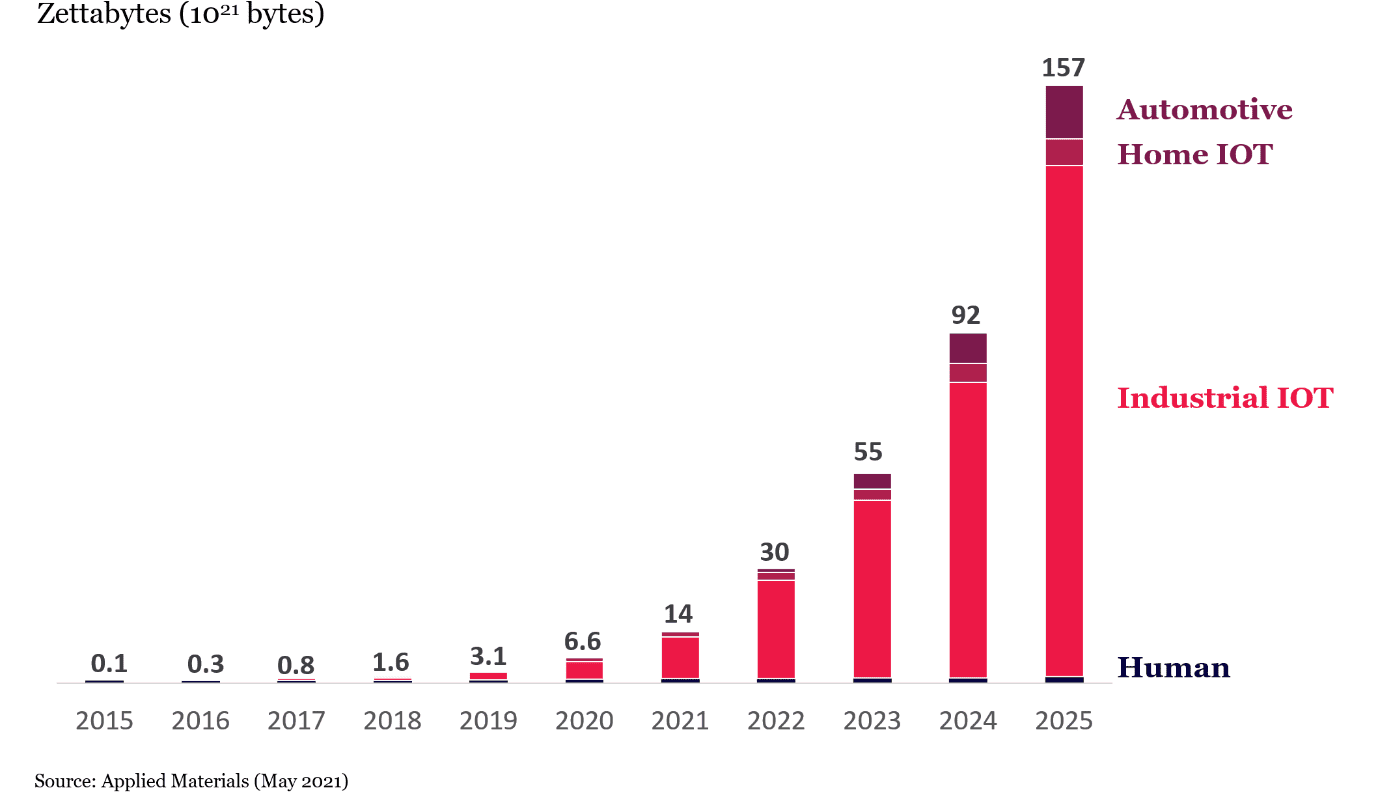
The world's hyperscalers are investing heavily in low code/no code interfaces (including, for example, drag and drop interfaces and natural-language-to-code translators) to democratise the development of AI-based enterprise applications so they are used by more and more employees of the cloud providers' customers. The second driver of massive demand for compute and storage services delivered by hyperscalers is that AI is increasingly being incorporated into every software application in every device. This includes IoT for which we are about to see an explosion in smart devices, deployed at the 'edge', built to be used across all aspects of life. Data Generation - By category
3. ML drives surging demand for compute and storage The effect of incorporating ML into applications is a significant increase in compute and storage intensity, which will benefit hyperscalers. The more successful an AI application is at continually extracting additional relevant data to virtuously improve the accuracy of the embedded ML models, the vastly more compute and storage that is required. 4. Hyperscalers set to dominate 'ASICs' - the new wave of chips powering AI Another reason that hyperscalers are positioned to win from AI is that they are at the cutting edge of developing new chips - Application Specific Integrated Circuits (ASICs) - that will dominate in coming years. Successful innovation on chip energy efficiency is an imperative for the long-term proliferation of AI. Given the enormous economic incentives at play, there is a high probability the hyperscalers will lead this innovation. Not only will this have a positive direct impact on the world's physical environment, but the enabling of increasingly powerful AI will likely, itself, resolve many of the challenges the world needs to overcome to mitigate climate change risks. 6. Hyperscalers will benefit from growing barriers-to-entry that makes them long-term winners from AI Today's hyperscalers have a significant lead over competitors and it is highly likely this lead will only extend over time. The 'barriers to entry' in the space are already very high - and rapidly growing higher, all but eliminating the realistic prospects of a major new competitor materialising.
Montaka believes AI will drive much, much more demand for compute and storage - both in the cloud and at the edge - than many are expecting today. Furthermore, this growth is largely assured, the long-term winners are already known today with a high degree of certainty, and we believe the current stock prices of these businesses are failing to adequately reflect what Montaka's sees on the horizon. It appears highly plausible that hyperscaler revenue expectations are far too low in the context of the scale of the AI-based opportunity that lies ahead. If so, then Amazon, Microsoft and Alphabet - as well as Alibaba and Tencent - will likely surprise investors substantially to the upside over the coming years. Investors should also remember that the enormous R&D being incurred by the hyperscalers, while expensed fully each period to satisfy accounting rules, represents an economic investment in future earnings power. Through this lens, hyperscaler earnings power today is 'artificially' understated - and valuation multiples, therefore, overstated. Funds operated by this manager: Montaka Global Fund, Montaka Global Long Only Fund DISCLAIMER |

17 Mar 2022 - Performance Report: Equitable Investors Dragonfly Fund
| Report Date | |
| Manager | |
| Fund Name | |
| Strategy | |
| Latest Return Date | |
| Latest Return | |
| Latest 6 Months | |
| Latest 12 Months | |
| Latest 24 Months (pa) | |
| Annualised Since Inception | |
| Inception Date | |
| FUM (millions) | |
| Fund Overview | The Fund is an open ended, unlisted unit trust investing predominantly in ASX listed companies. Hybrid, debt & unlisted investments are also considered. The Fund is focused on investing in growing or strategic businesses and generating returns that, to the extent possible, are less dependent on the direction of the broader sharemarket. The Fund may at times change its cash weighting or utilise exchange traded products to manage market risk. Investments will primarily be made in micro-to-mid cap companies listed on the ASX. Larger listed businesses will also be considered for investment but are not expected to meet the manager's investment criteria as regularly as smaller peers. |
| Manager Comments | The Equitable Investors Dragonfly Fund has a track record of 4 years and 6 months and therefore comparison over all market conditions and against its peers is limited. Since inception in September 2017, the fund has returned +0.31% per annum, a difference of -8.58% relative to the index which has returned +8.89% on an annualised basis over the same period. The Manager has delivered these returns with 7.91% more volatility than the index, contributing to a Sharpe ratio which has fallen below 1 four times over the past four years and which currently sits at 0.09 since inception. The fund has provided positive monthly returns 57% of the time in rising markets and 29% of the time during periods of market decline, contributing to an up-capture ratio since inception of 61% and a down-capture ratio of 109%. |
| More Information |

17 Mar 2022 - Performance Report: Insync Global Capital Aware Fund
| Report Date | |
| Manager | |
| Fund Name | |
| Strategy | |
| Latest Return Date | |
| Latest Return | |
| Latest 6 Months | |
| Latest 12 Months | |
| Latest 24 Months (pa) | |
| Annualised Since Inception | |
| Inception Date | |
| FUM (millions) | |
| Fund Overview | Insync invests in a concentrated portfolio of high quality companies that possess long 'runways' of future growth benefitting from Megatrends. Megatrends are multiyear structural and disruptive changes that transform the way we live our daily lives and result from a convergence of different underlying trends including innovation, politics, demographics, social attitudes and lifestyles. They provide important tailwinds to individual stocks and sectors, that reside within them. Insync believe this delivers exponential earnings growth ahead of market expectations. The fund uses Put Options to help buffer the depth and duration that sharp, severe negative market impacts would otherwide have on the value of the fund during these events. Insync screens the universe of 40,000 listed global companies to just 150 that it views as superior. This includes profitability, balance sheet performance, shareholder focus and valuations. 20-40 companies are then chosen for the portfolio. These reflect the best outcomes from further analysis using a proprietary DCF valuation, implied growth modelling, and free cash flow yield; alongside management, competitor, and industry scrutiny. The Fund may hold some cash (maximum of 5%), derivatives, currency contracts for hedging purposes, and American and/or Global Depository Receipts. It is however, for all intents and purposes, a 'long-only' fund, remaining fully invested irrespective of market cycles. |
| Manager Comments | The Insync Global Capital Aware Fund has a track record of 12 years and 5 months and has underperformed the Global Equity Index since inception in October 2009, providing investors with an annualised return of 11.2% compared with the index's return of 11.37% over the same period. On a calendar year basis, the fund has experienced a negative annual return on 2 occasions in the 12 years and 5 months since its inception. Over the past 12 months, the fund's largest drawdown was -15.61% vs the index's -7.46%, and since inception in October 2009 the fund's largest drawdown was -15.61% vs the index's maximum drawdown over the same period of -13.59%. The fund's maximum drawdown began in January 2022 and has lasted 1 month, reaching its lowest point during February 2022. During this period, the index's maximum drawdown was -7.46%. The Manager has delivered these returns with 0.71% more volatility than the index, contributing to a Sharpe ratio which has fallen below 1 three times over the past five years and which currently sits at 0.83 since inception. The fund has provided positive monthly returns 81% of the time in rising markets and 23% of the time during periods of market decline, contributing to an up-capture ratio since inception of 59% and a down-capture ratio of 76%. |
| More Information |

17 Mar 2022 - Australian Equities - At The Crossroads?
|
Australian Equities - At The Crossroads? Airlie Funds Management 08 March 2022 |
|
After varying lengths of ever-lower interest rates, RBA asset-buying and benign inflation - all three are reversing course, resulting in increasingly volatile equity markets in 2022. Airlie Portfolio Manager, Matt Williams and Equities Analyst, Will Granger explore what this means for Australian equities. The pair analyse the latest February earnings season and provide insight into the Airlie Australian Share Fund (AASF) portfolio. Timestamps: Funds operated by this manager: Airlie Australian Share Fund |

17 Mar 2022 - Geopolitical volatility and stagflation fears

16 Mar 2022 - Performance Report: Paragon Australian Long Short Fund
| Report Date | |
| Manager | |
| Fund Name | |
| Strategy | |
| Latest Return Date | |
| Latest Return | |
| Latest 6 Months | |
| Latest 12 Months | |
| Latest 24 Months (pa) | |
| Annualised Since Inception | |
| Inception Date | |
| FUM (millions) | |
| Fund Overview | Paragon's unique investment style, comprising thematic led idea generation followed with an in depth research effort, results in a concentrated portfolio of high conviction stocks. Conviction in bottom up analysis drives the investment case and ultimate position sizing: * Both quantitative analysis - probability weighted high/low/base case valuations - and qualitative analysis - company meetings, assessing management, the business model, balance sheet strength and likely direction of returns - collectively form Paragon's overall view for each investment case. * Paragon will then allocate weighting to each investment opportunity based on a risk/reward profile, capped to defined investment parameters by market cap, which are continually monitored as part of Paragon's overall risk management framework. The objective of the Paragon Fund is to produce absolute returns in excess of 10% p.a. over a 3-5 year time horizon with a low correlation to the Australian equities market. |
| Manager Comments | On a calendar year basis, the fund has only experienced a negative annual return once in the 9 years since its inception. Over the past 12 months, the fund's largest drawdown was -27.05% vs the index's -6.35%, and since inception in March 2013 the fund's largest drawdown was -45.11% vs the index's maximum drawdown over the same period of -26.75%. The fund's maximum drawdown began in January 2018 and lasted 2 years and 7 months, reaching its lowest point during March 2020. The fund had completely recovered its losses by August 2020. The Manager has delivered these returns with 11.37% more volatility than the index, contributing to a Sharpe ratio which has fallen below 1 five times over the past five years and which currently sits at 0.49 since inception. The fund has provided positive monthly returns 68% of the time in rising markets and 46% of the time during periods of market decline, contributing to an up-capture ratio since inception of 90% and a down-capture ratio of 82%. |
| More Information |

16 Mar 2022 - Performance Report: Cyan C3G Fund
| Report Date | |
| Manager | |
| Fund Name | |
| Strategy | |
| Latest Return Date | |
| Latest Return | |
| Latest 6 Months | |
| Latest 12 Months | |
| Latest 24 Months (pa) | |
| Annualised Since Inception | |
| Inception Date | |
| FUM (millions) | |
| Fund Overview | Cyan C3G Fund is based on the investment philosophy which can be defined as a comprehensive, clear and considered process focused on delivering growth. These are identified through stringent filter criteria and a rigorous research process. The Manager uses a proprietary stock filter in order to eliminate a large proportion of investments due to both internal characteristics (such as gearing levels or cash flow) and external characteristics (such as exposure to commodity prices or customer concentration). Typically, the Fund looks for businesses that are one or more of: a) under researched, b) fundamentally undervalued, c) have a catalyst for re-rating. The Manager seeks to achieve this investment outcome by actively managing a portfolio of Australian listed securities. When the opportunity to invest in suitable securities cannot be found, the manager may reduce the level of equities exposure and accumulate a defensive cash position. Whilst it is the company's intention, there is no guarantee that any distributions or returns will be declared, or that if declared, the amount of any returns will remain constant or increase over time. The Fund does not invest in derivatives and does not use debt to leverage the Fund's performance. However, companies in which the Fund invests may be leveraged. |
| Manager Comments | The Cyan C3G Fund has a track record of 7 years and 7 months and has outperformed the ASX Small Ordinaries Total Return Index since inception in August 2014, providing investors with an annualised return of 12.29% compared with the index's return of 7.99% over the same period. On a calendar year basis, the fund has only experienced a negative annual return once in the 7 years and 7 months since its inception. Over the past 12 months, the fund's largest drawdown was -18.68% vs the index's -9.15%, and since inception in August 2014 the fund's largest drawdown was -36.45% vs the index's maximum drawdown over the same period of -29.12%. The fund's maximum drawdown began in October 2019 and lasted 1 year and 4 months, reaching its lowest point during March 2020. The fund had completely recovered its losses by February 2021. The Manager has delivered these returns with 0.26% more volatility than the index, contributing to a Sharpe ratio which has fallen below 1 five times over the past five years and which currently sits at 0.71 since inception. The fund has provided positive monthly returns 85% of the time in rising markets and 39% of the time during periods of market decline, contributing to an up-capture ratio since inception of 67% and a down-capture ratio of 64%. |
| More Information |

16 Mar 2022 - Performance Report: Bennelong Long Short Equity Fund
| Report Date | |
| Manager | |
| Fund Name | |
| Strategy | |
| Latest Return Date | |
| Latest Return | |
| Latest 6 Months | |
| Latest 12 Months | |
| Latest 24 Months (pa) | |
| Annualised Since Inception | |
| Inception Date | |
| FUM (millions) | |
| Fund Overview | In a typical environment the Fund will hold around 70 stocks comprising 35 pairs. Each pair contains one long and one short position each of which will have been thoroughly researched and are selected from the same market sector. Whilst in an ideal environment each stock's position will make a positive return, it is the relative performance of the pair that is important. As a result the Fund can make positive returns when each stock moves in the same direction provided the long position outperforms the short one in relative terms. However, if neither side of the trade is profitable, strict controls are required to ensure losses are limited. The Fund uses no derivatives and has no currency exposure. The Fund has no hard stop loss limits, instead relying on the small average position size per stock (1.5%) and per pair (3%) to limit exposure. Where practical pairs are always held within the same sector to limit cross sector risk, and positions can be held for months or years. The Bennelong Market Neutral Fund, with same strategy and liquidity is available for retail investors as a Listed Investment Company (LIC) on the ASX. |
| Manager Comments | The Bennelong Long Short Equity Fund has a track record of 20 years and 1 month and has outperformed the ASX 200 Total Return Index since inception in February 2002, providing investors with an annualised return of 13.11% compared with the index's return of 8.1% over the same period. Over the past 12 months, the fund's largest drawdown was -20.36% vs the index's -6.35%, and since inception in February 2002 the fund's largest drawdown was -27.86% vs the index's maximum drawdown over the same period of -47.19%. The fund's maximum drawdown began in September 2020 and has lasted 1 year and 5 months, reaching its lowest point during February 2022. During this period, the index's maximum drawdown was -15.05%. The Manager has delivered these returns with 0.09% less volatility than the index, contributing to a Sharpe ratio which has fallen below 1 five times over the past five years and which currently sits at 0.76 since inception. The fund has provided positive monthly returns 64% of the time in rising markets and 62% of the time during periods of market decline, contributing to an up-capture ratio since inception of 5% and a down-capture ratio of -128%. |
| More Information |

16 Mar 2022 - 3 stocks to benefit from energy increases
|
3 stocks to benefit from energy increases Datt Capital 03 March 2022 Russia's invasion of Ukraine and the subsequent sanctions against it enforced by the Western world have enormously affected energy and broader commodity markets. The important Asian LNG benchmark, the JKM index, is currently trading ~US$35/MMBtu; significantly higher than in recent months. Whitehaven Coal (ASX:WHC) Written By Emanuel Datt Funds operated by this manager: |
|
Disclaimer: This article does not take into account your investment objectives, particular needs or financial situation; and should not be construed as advice in any way. The author holds no exposure to the stock discussed |

15 Mar 2022 - Performance Report: Bennelong Twenty20 Australian Equities Fund
| Report Date | |
| Manager | |
| Fund Name | |
| Strategy | |
| Latest Return Date | |
| Latest Return | |
| Latest 6 Months | |
| Latest 12 Months | |
| Latest 24 Months (pa) | |
| Annualised Since Inception | |
| Inception Date | |
| FUM (millions) | |
| Fund Overview | |
| Manager Comments | The Bennelong Twenty20 Australian Equities Fund has a track record of 12 years and 4 months and has outperformed the ASX 200 Total Return Index since inception in November 2009, providing investors with an annualised return of 10.64% compared with the index's return of 7.91% over the same period. Over the past 12 months, the fund's largest drawdown was -10.54% vs the index's -6.35%, and since inception in November 2009 the fund's largest drawdown was -26.09% vs the index's maximum drawdown over the same period of -26.75%. The fund's maximum drawdown began in February 2020 and lasted 9 months, reaching its lowest point during March 2020. The fund had completely recovered its losses by November 2020. The Manager has delivered these returns with 0.55% more volatility than the index, contributing to a Sharpe ratio which has fallen below 1 five times over the past five years and which currently sits at 0.65 since inception. The fund has provided positive monthly returns 95% of the time in rising markets and 7% of the time during periods of market decline, contributing to an up-capture ratio since inception of 120% and a down-capture ratio of 97%. |
| More Information |


