
NEWS

1 May 2023 - Performance Report: Insync Global Quality Equity Fund
[Current Manager Report if available]

1 May 2023 - 10k Words | April 2023
|
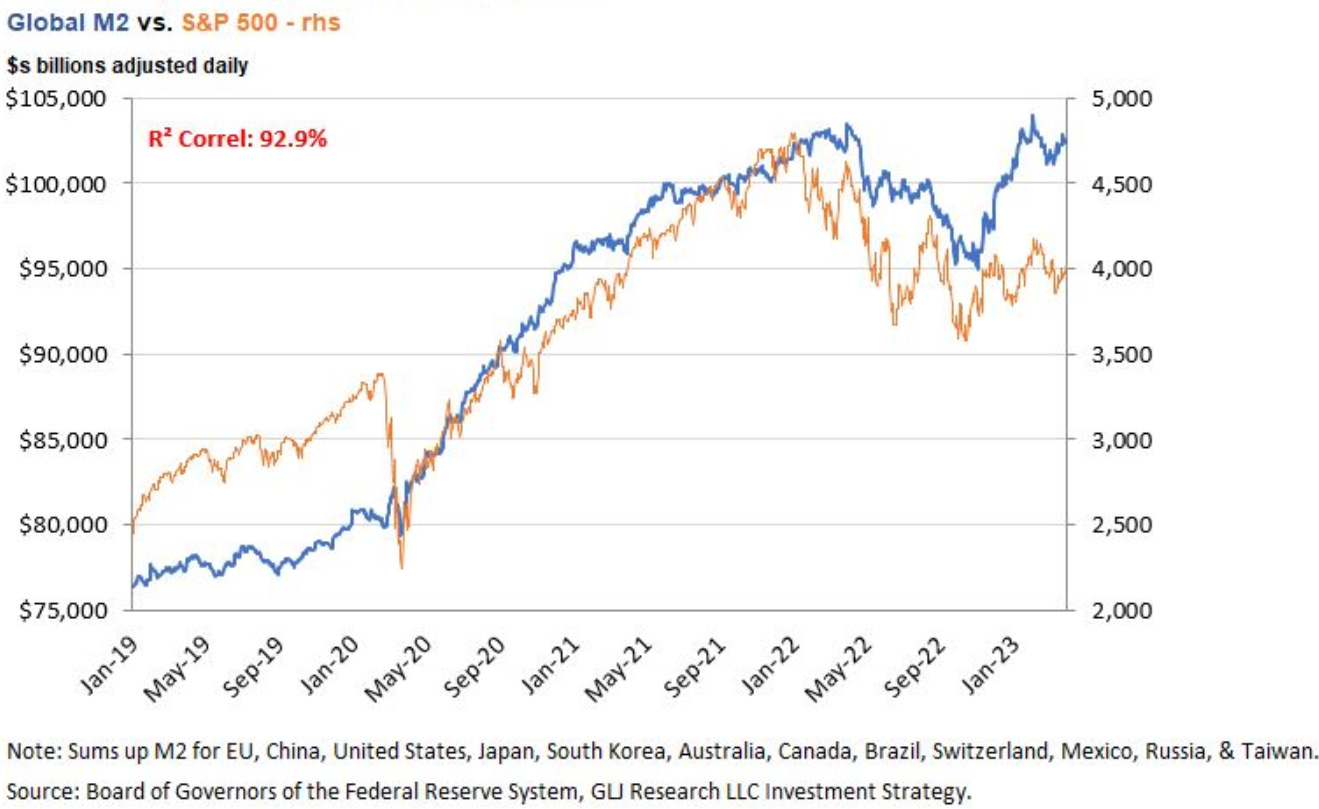
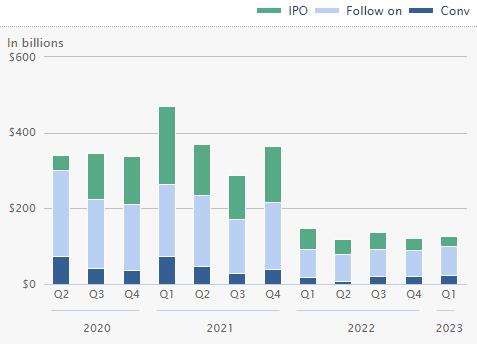
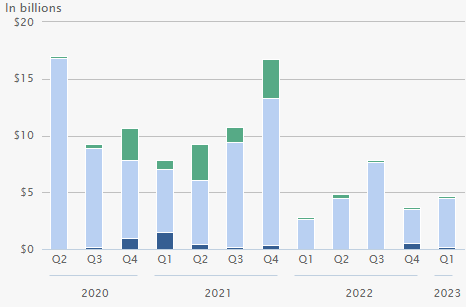
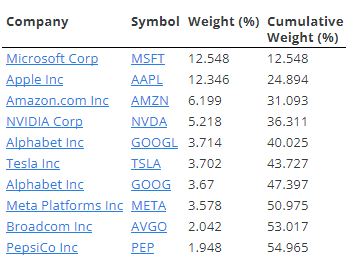
10k Words Equitable Investors April 2023 Funds continue to flow into equities despite recent volatility and recession fears, with Barclays noting fund flows lag performance. Performance is highly correlated with money supply, notes GLJ Research, and central bank liquidity may actually have been increasing lately according to Citi Research. The "Buy the Dip" mantra helps, as Bloomberg charts this strategy's recent success. Despite equity markets holding up, capital raising remains suppressed relative to dealogic's 2020 and 2021 figures. WSJ highlighted aerospace and defence technology as an area where there does appear to be strong capital flows. US banks, however, have seen deposit outflows, as charted here by Reuters. Margins have blown out on ASX-listed debt and hybrids, as per Bell Potter charts, which are largely issued by banks and financials. Bond market volatility is at historically high levels as seen from Bespoke and FT charts. Back in equities, the concentration of major indices stands out and Equitable Investors has pulled together top ten stats. The S&P 500 would have been down in March without "big tech", eToro highlights. US households supporting flows to equities despite recession risk 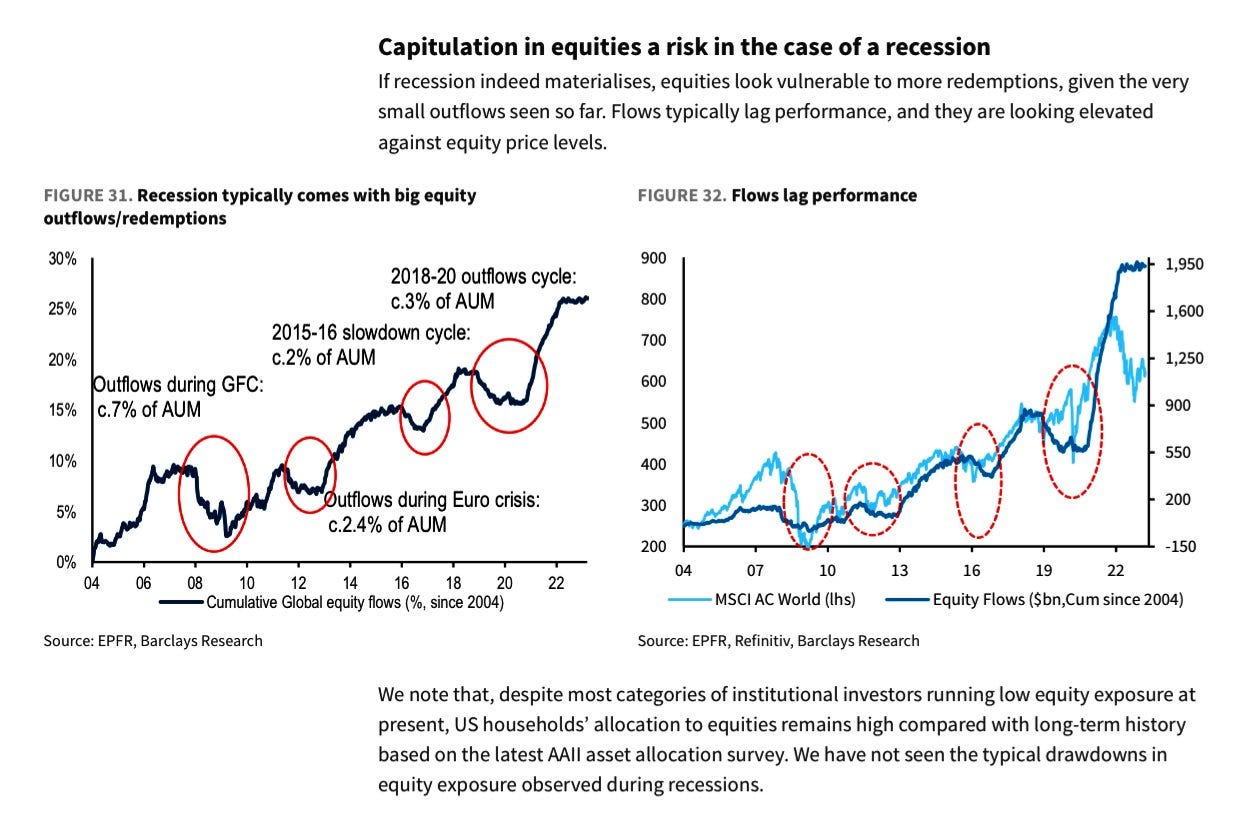
Source: Barclays Research Money Supply (M2) has high correlation with S&P 500
Source: GLJ Research Global central bank liquidity has been increasing according to Citi Research 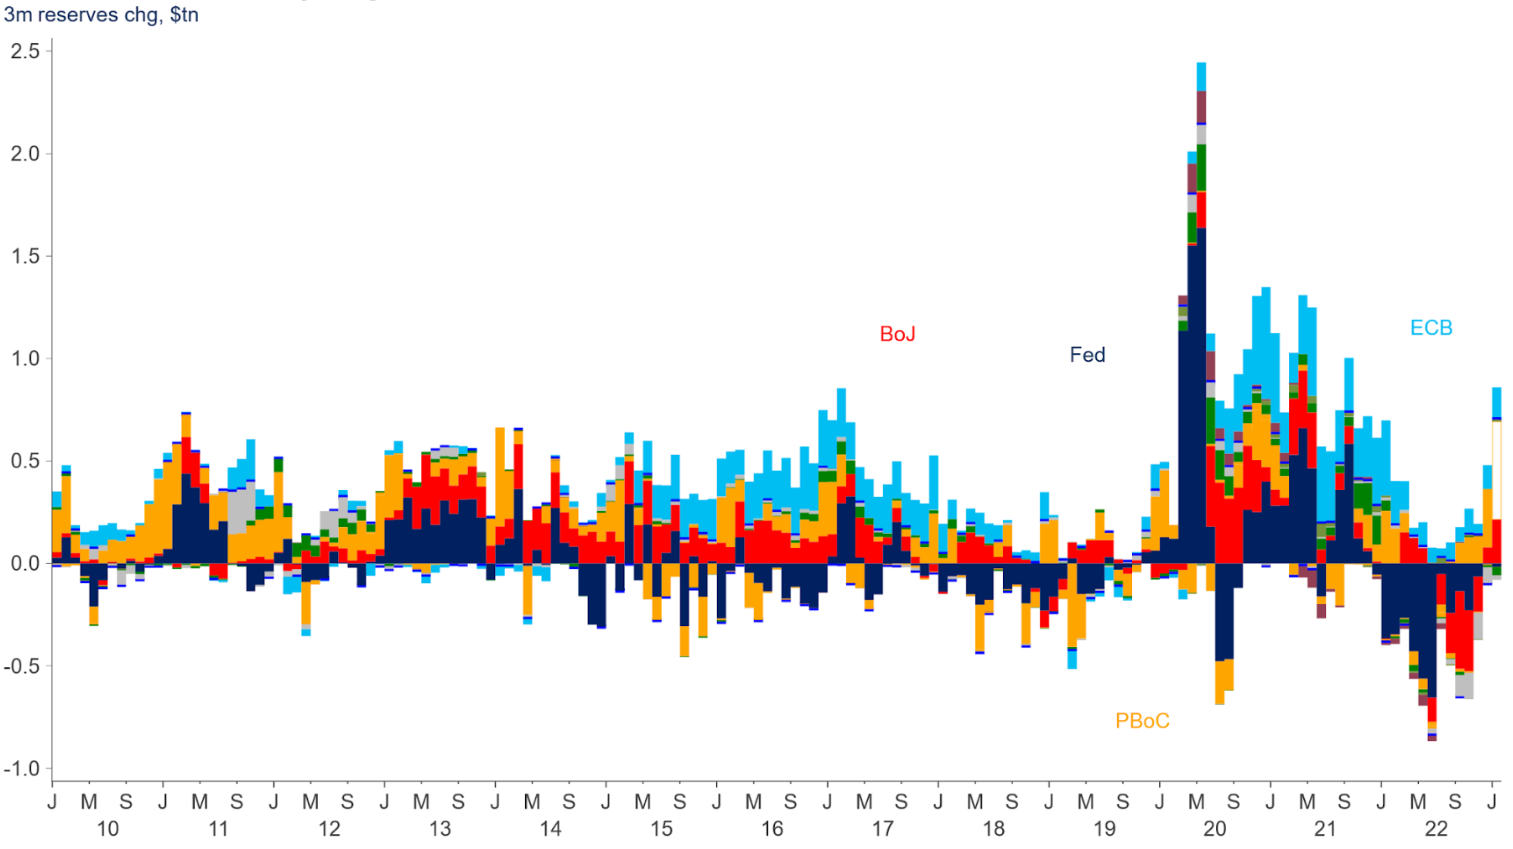
Source: Citi Research, Bloomberg 2023 shaping up as the second best year for dip-buying strategy 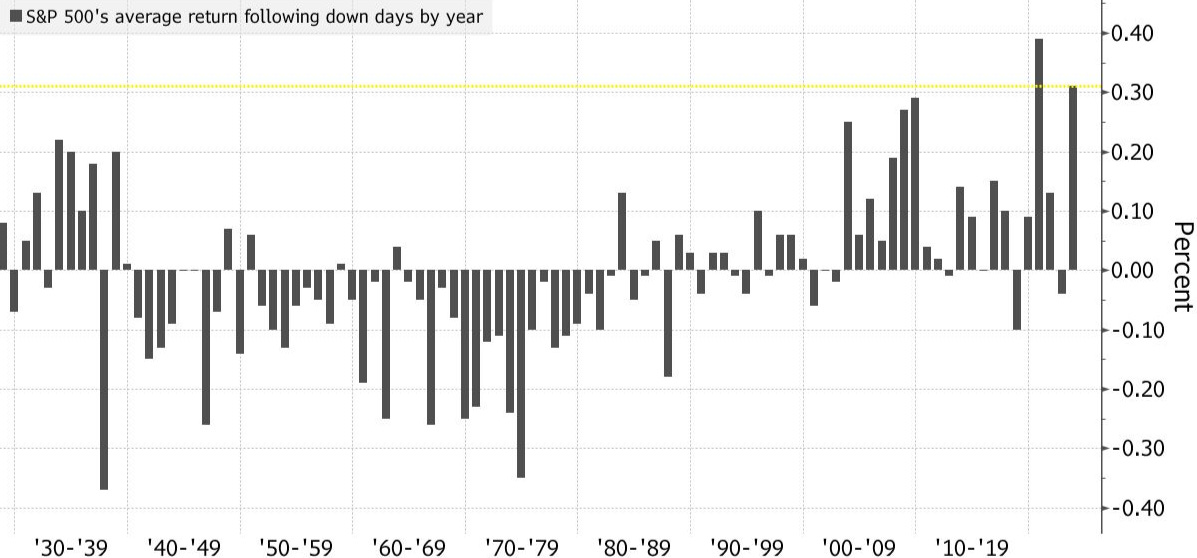
Source: Bloomberg Global equity capital raisings by quarter ($US)
Source: WSJ, dealogic Australasia equity capital raisings by quarter ($US)
Source: WSJ, dealogic US VC deal activity in aerospace and defence technology 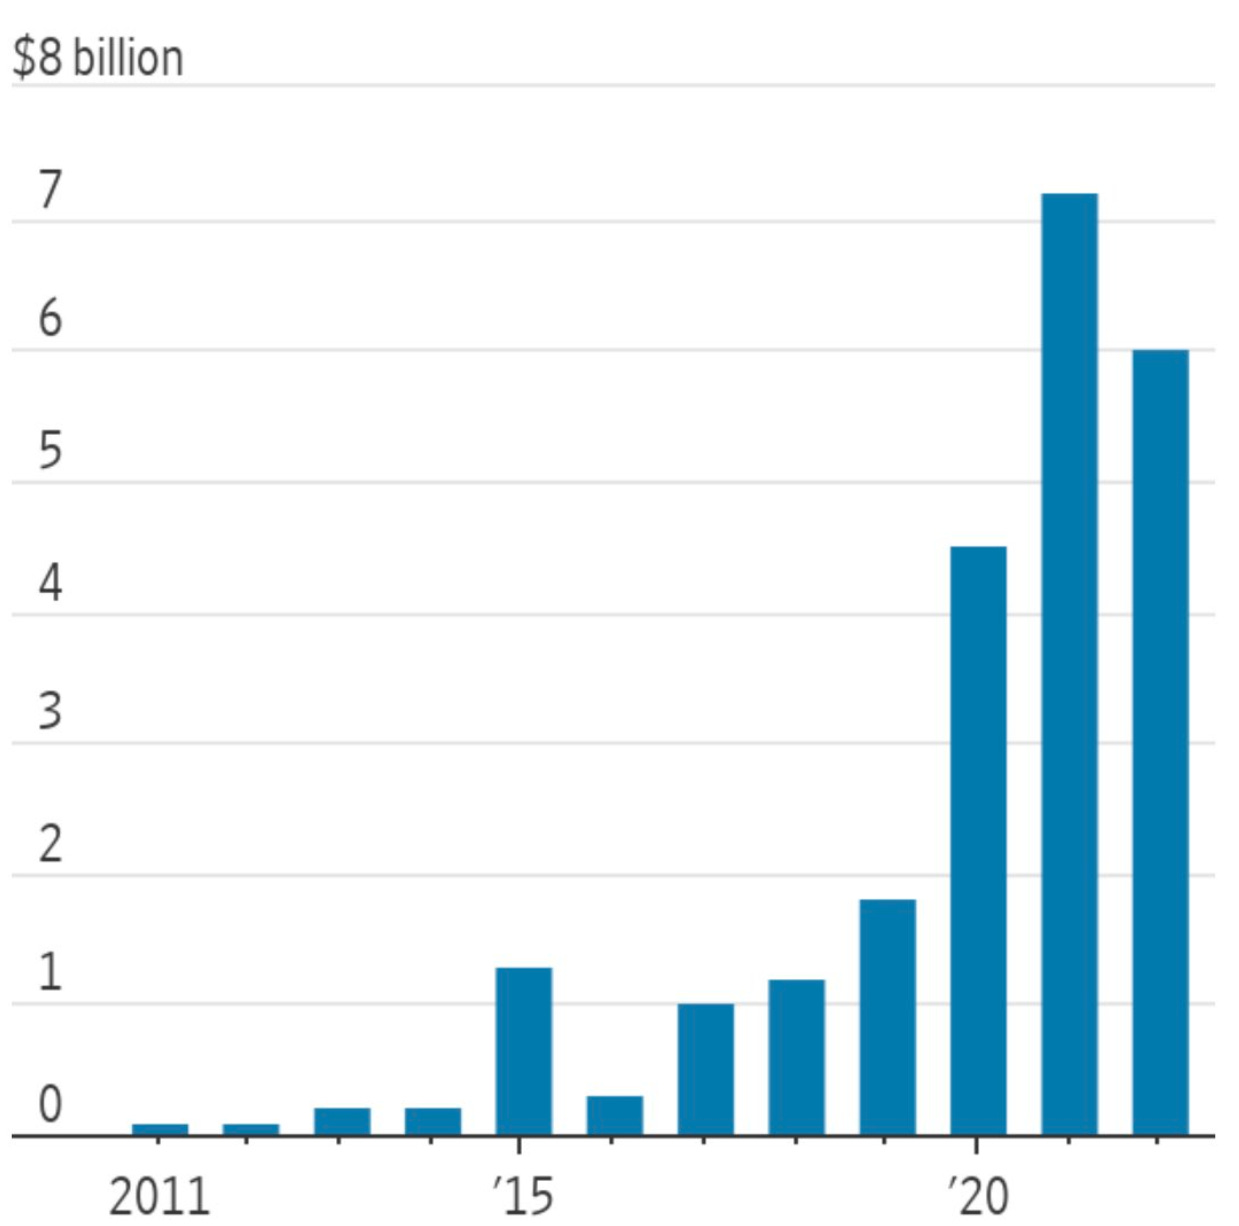
Source: WSJ, PitchBook US bank deposits 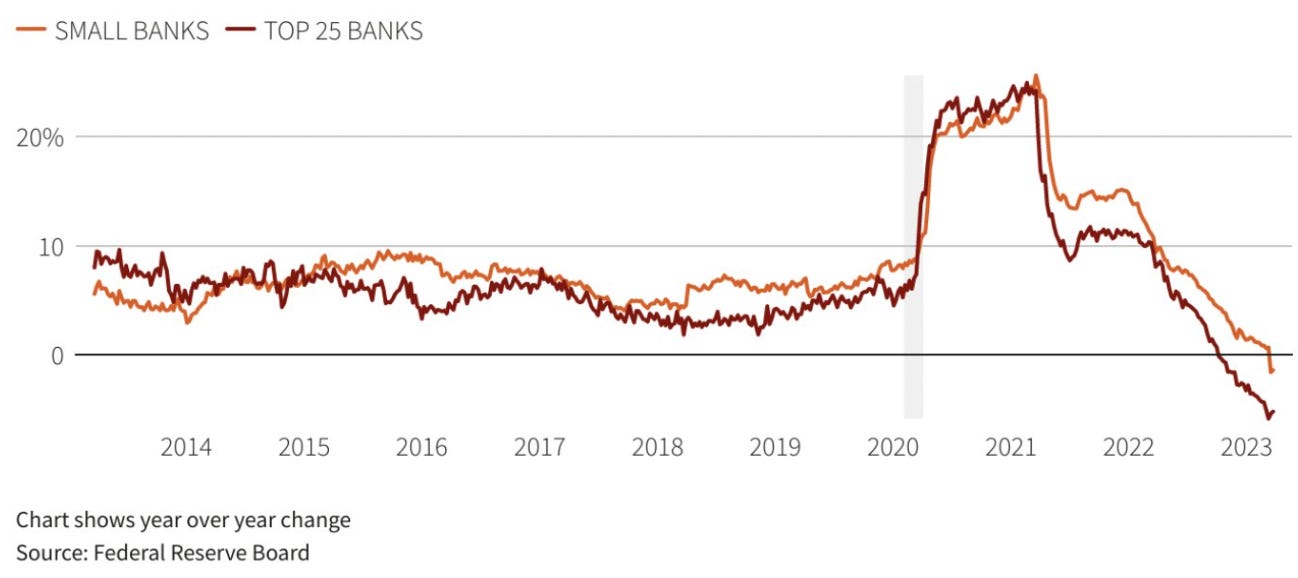
Source: Reuters Trading Margins on ASX Listed Debt and Hybrid Sectors (27 Mar) 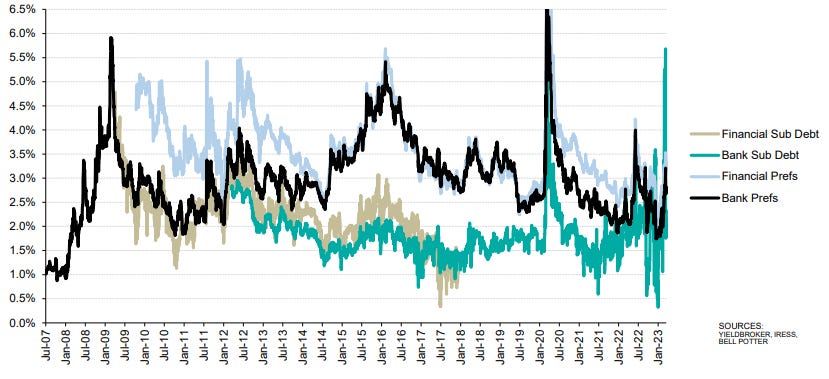
Source: Bell Potter Research US Two-Year Bond Yield - Four Week Average Daily Move 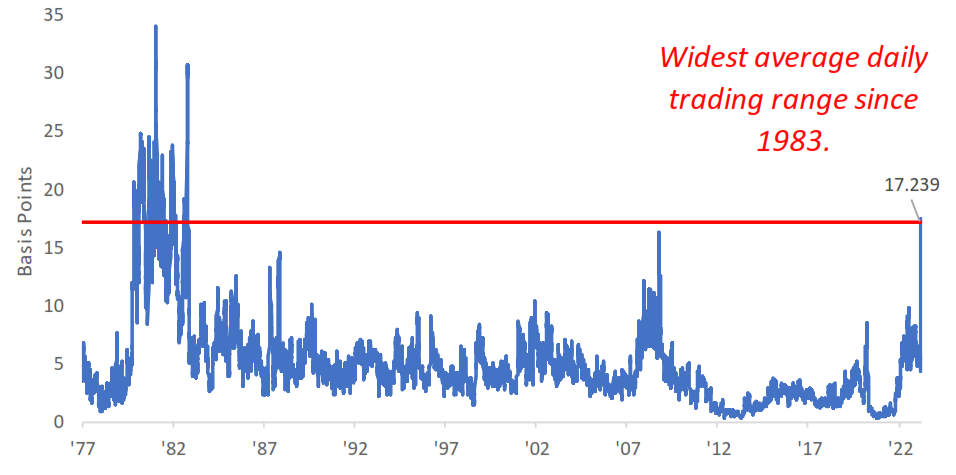
Source: Bespoke Investment Group ICE BofAML MOVE Index (US bond market implied volatility) 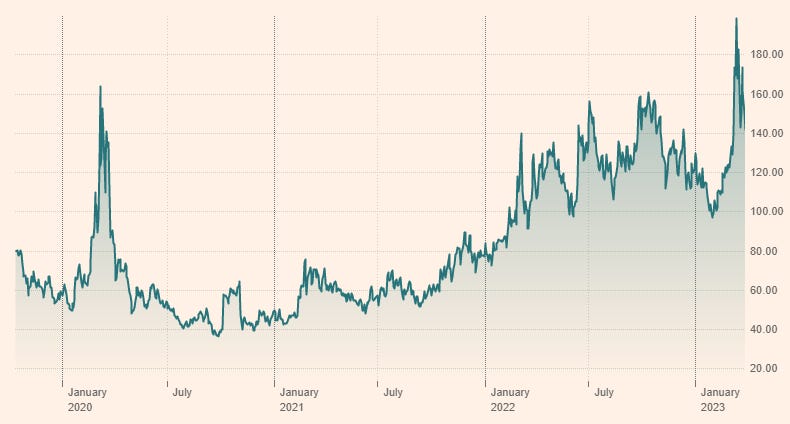
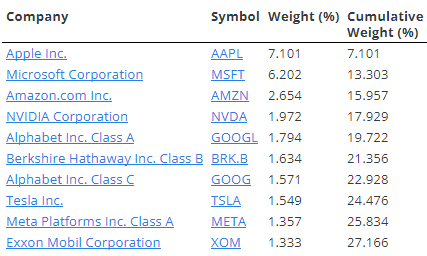
Source: FT, Refinitiv Top 10 Nasdaq 100 components = 55% weighting Source: Equitable Investors, SlickCharts Top 10 S&P 500 components = 27% weighting
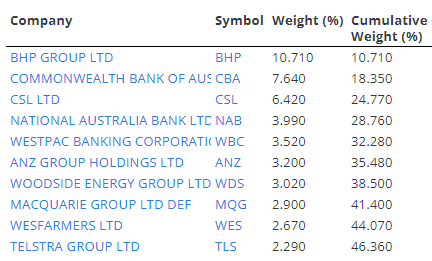
Source: Equitable Investors, SlickCharts Top 10 iShares Core S&P/ASX 200 ETF components = 46% weighting
Source: Equitable Investors, Iress S&P 500 performance without "big tech" 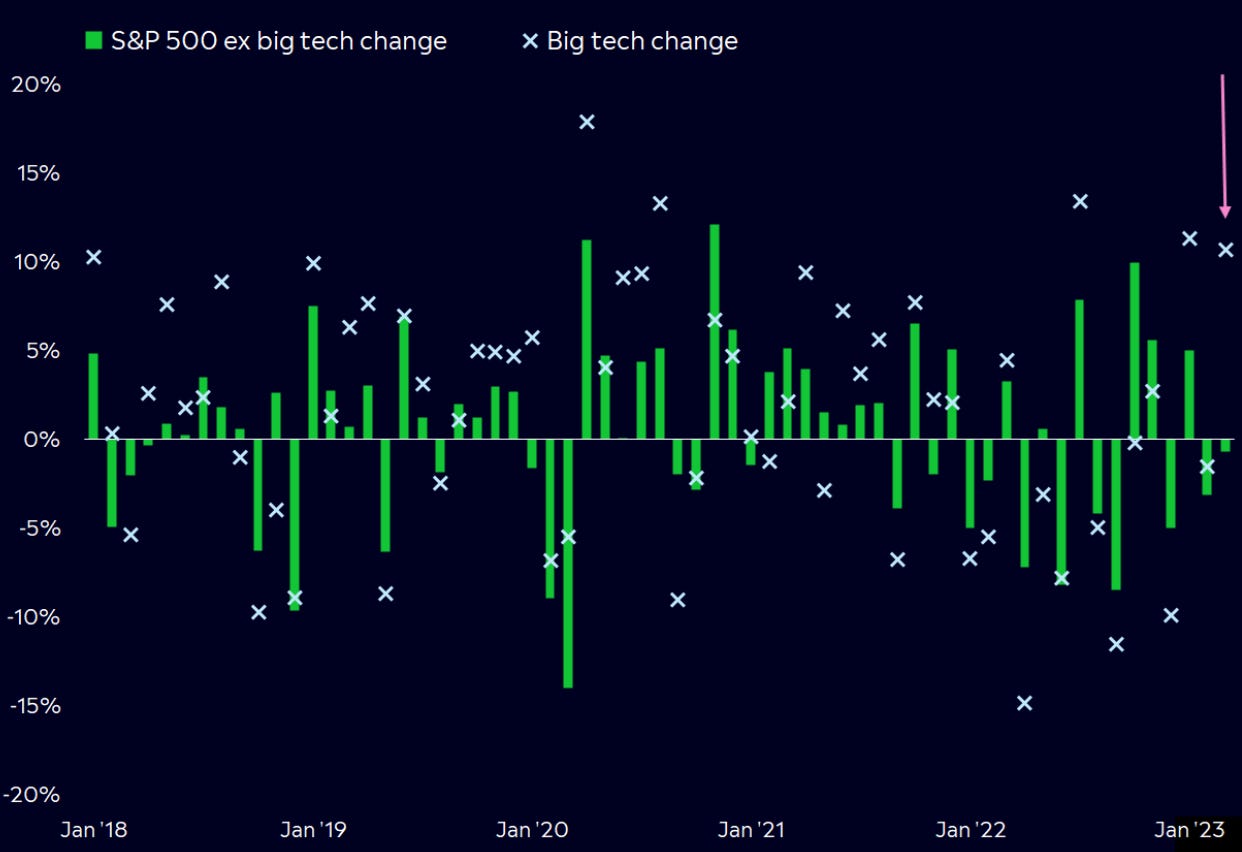
Source: eToro, Bloomberg April Edition Funds operated by this manager: Equitable Investors Dragonfly Fund Disclaimer Nothing in this blog constitutes investment advice - or advice in any other field. Neither the information, commentary or any opinion contained in this blog constitutes a solicitation or offer by Equitable Investors Pty Ltd (Equitable Investors) or its affiliates to buy or sell any securities or other financial instruments. Nor shall any such security be offered or sold to any person in any jurisdiction in which such offer, solicitation, purchase, or sale would be unlawful under the securities laws of such jurisdiction. The content of this blog should not be relied upon in making investment decisions. Any decisions based on information contained on this blog are the sole responsibility of the visitor. In exchange for using this blog, the visitor agree to indemnify Equitable Investors and hold Equitable Investors, its officers, directors, employees, affiliates, agents, licensors and suppliers harmless against any and all claims, losses, liability, costs and expenses (including but not limited to legal fees) arising from your use of this blog, from your violation of these Terms or from any decisions that the visitor makes based on such information. This blog is for information purposes only and is not intended to be relied upon as a forecast, research or investment advice. The information on this blog does not constitute a recommendation, offer or solicitation to buy or sell any securities or to adopt any investment strategy. Although this material is based upon information that Equitable Investors considers reliable and endeavours to keep current, Equitable Investors does not assure that this material is accurate, current or complete, and it should not be relied upon as such. Any opinions expressed on this blog may change as subsequent conditions vary. Equitable Investors does not warrant, either expressly or implied, the accuracy or completeness of the information, text, graphics, links or other items contained on this blog and does not warrant that the functions contained in this blog will be uninterrupted or error-free, that defects will be corrected, or that the blog will be free of viruses or other harmful components. Equitable Investors expressly disclaims all liability for errors and omissions in the materials on this blog and for the use or interpretation by others of information contained on the blog |

28 Apr 2023 - Hedge Clippings | 28 April 2023
|
|
|
|
Hedge Clippings | 28 April 2023 |
|
|
Economic Cross Winds Following last week's release of the Review of the Reserve Bank, which targeted the RBA's culture, management and performance, the focus now returns to next week's board meeting, and the potential for an extension of the policy pause announced in March. Supporters of this view - by no means unanimous - were encouraged by this week's inflation figure which saw annual inflation to the end of March fall to 7.0%, down from December's 30 year peak of 7.8%. Others saw it differently, particularly those who pointed out that inflation at 7% is still at least 4% above the top of the RBA's target range of 2-3%, and are wary of the inflationary effects of wages policy, plus any inflationary impact from the Government's first budget, due on Tuesday week. Thereafter it is going to be more difficult for Chalmers to blame Scomo (a.k.a. Minister for Everything) and Josh Frydenburg for Australia's inflationary and economic woes, when the root cause of the current situation was global or external. Our call is for a continuation of the pause, even if only for a month until the budget is out of the way and the picture is clearer. However, barring a recession, expectations are for inflation to remain elevated for longer than the RBA expects, so it is likely to be well into 2024 or beyond before Australia's inflation rate starts with a "2", by which time, if Jim Chalmers has anything to do with it, Philip Lowe will be long gone. Turning to the US, there is also a Fed meeting scheduled for next week, with the Federal Reserve chairman Jerome Powell facing further economic cross winds as core inflation picked up in the March quarter, while growth was just 1.1%, well under the median forecast of 1.9%. Higher inflation, coupled with lower growth, is not a positive formula, particularly while the Fed is also grappling with falling confidence in the banking system as San Francisco based First Republic Bank suffered withdrawals of 40% of its deposits in the first three months of the year. Coming on the back of the collapse of US banks Silicon Valley and Signature, and the Swiss National Bank's emergency liquidity of US $120 billion to support the UBS absorption of Credit Suisse the risk of contagion in the US and the global banking system is heightened. This article from the Economist Intelligence Unit - although a few weeks old - argues that financial contagion is unlikely. However, if consumers or depositors' confidence is shaken by the chance of their loss of capital, this could change very rapidly. |
|
|
News & Insights Australian Secure Capital Fund - Market Update March | Australian Secure Capital Fund Investment Perspectives: Banks, balance sheets and bailouts | Quay Global Investors March 2023 Performance News Bennelong Concentrated Australian Equities Fund Emit Capital Climate Finance Equity Fund Insync Global Quality Equity Fund Insync Global Capital Aware Fund |
|
|
If you'd like to receive Hedge Clippings direct to your inbox each Friday |
28 Apr 2023 - Performance Report: Emit Capital Climate Finance Equity Fund
[Current Manager Report if available]

28 Apr 2023 - Australian Secure Capital Fund - Market Update March
|
Australian Secure Capital Fund - Market Update March Australian Secure Capital Fund April 2023 Property Values as at 31st of March 2023
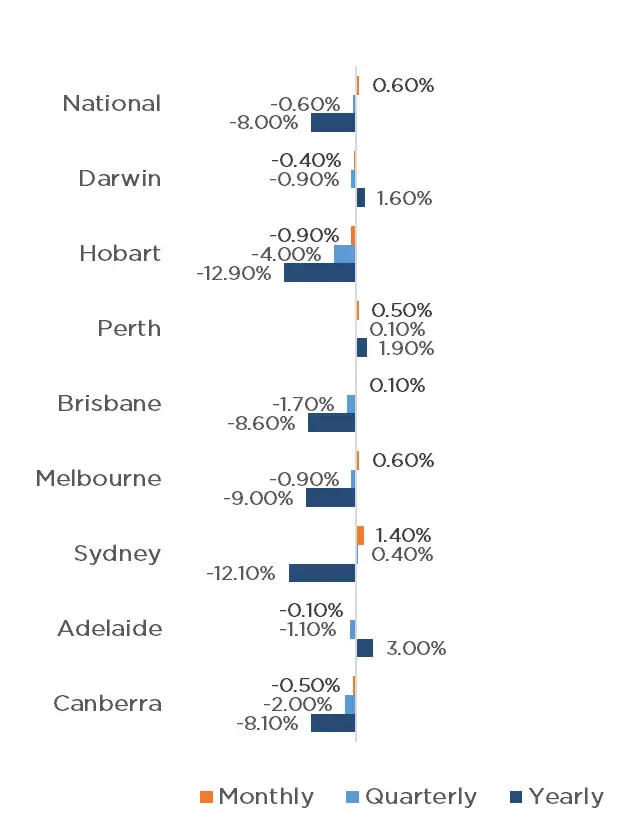
The property market continues to show signs of recovery, with CoreLogic's National Home Value Index posting the first month-on-month increase since April 2022, with values up 0.60% for the month of March. This monthly growth was driven by strong results in Sydney, with values increasing 1.40% for the month. This figure has been impacted heavily by housing values in the most expensive quarter of Sydney's market up 2.00% and unit values also up 1.40%. Results across Melbourne, Perth and Brisbane were also positive, with the capital cities recording growth of 0.60%, 0.50% and 0.10% respectively. Adelaide (-0.10%), Darwin (-0.40%), Canberra (-0.50%) and Tasmania (-0.90%) however all recorded reductions in value. Clearance Rates & Auctions 20th - 26th of February 2023 The week before Easter brought the busiest auction week of 2023 thus far, with 2,685 properties going to auction, up 16.60% on the previous week, however still 16.30% below that of last year (3,209). Melbourne led the way with 1,188 auctions taking place, followed closely by Sydney with 1,019. Brisbane, Adelaide and Canberra which all saw significantly fewer auctions, with 177, 161 and 121 respectively. In addition to strong auction volumes, clearance rates have continued to improve, with Sydney, Adelaide and Melbourne all receiving above 70.00% clearance rates with 73.3% (63.8% last year), 71.6% (79.1% last year) and 71.2% (67% last year) respectively, contributing to a 70.7% weighted average, up from 66.8% last year. Brisbane also recorded a clearance rate of 64.2% (65.9% last year), however results across Canberra and Perth were well down on last years values, with 55.6% (73.3% last year) and 54.5% (64.7% last year) respectively. With the RBA opting to leave the cash rate unchanged in their April meeting after 10 consecutive increases, some relief is now given to existing mortgage holders, whilst also providing some comfort for those looking to enter the market. In line with previous forecasts, we believe buyer demand is likely to continue to increase throughout the year and into 2024. Median Dwelling Values as at 31st of March 2023 Quick Insights Australia faces huge housing shortfall as new home sales slump A dramatic slump in new home sales will exacerbate the national rental and affordability crisis and put further pressure on the ability of new housing supply to meet future demand, the Urban Development Institute has warned in its latest State of the Land report. According to the benchmark report, over the 2022 calendar year, greenfield lot sales almost halved and settled apartment sales fell to their lowest level since the global financial crisis as buyer demand plummeted, all due to higher interest rates, surging construction work, and fears about builder failures. Source: Australian Financial Review Walk-in buyer interrupts auction, takes house sight unseen A four-bedroom house with a pool located in Floreat, Western Australia, sold at auction for $1.7 million. There were a lot of interested parties - 10 registered bidders but only three were active bidders. Right at the tail end of bidding, as things were starting to simmer down, someone walked in and asked if they could quickly register. She'd never seen the home. She walked straight into the backyard and said "I like this house." and within minutes she purchased the property. Source: Australian Financial Review Infrastructure Victoria urges Andrews to scrap stamp duty Stamp duty should be scrapped and replaced with a broad-based land tax according to Infrastructure Victoria In a landmark report it also warned that transport and amenities are struggling to keep pace with suburban sprawl and density needs to increase in existing suburbs. The report calls for the government to fast-track planning approval for more high-quality, three or four-bedroom townhouses and better standards for family-friendly low-rise apartments, to reverse the trend of families continuing to move to bigger blocks in newly created outer suburbs. Source: Australian Financial Review Author: Filippo Sciacca, Director - Investor Relations, Asset Management and Compliance Funds operated by this manager: ASCF High Yield Fund, ASCF Premium Capital Fund, ASCF Select Income Fund |
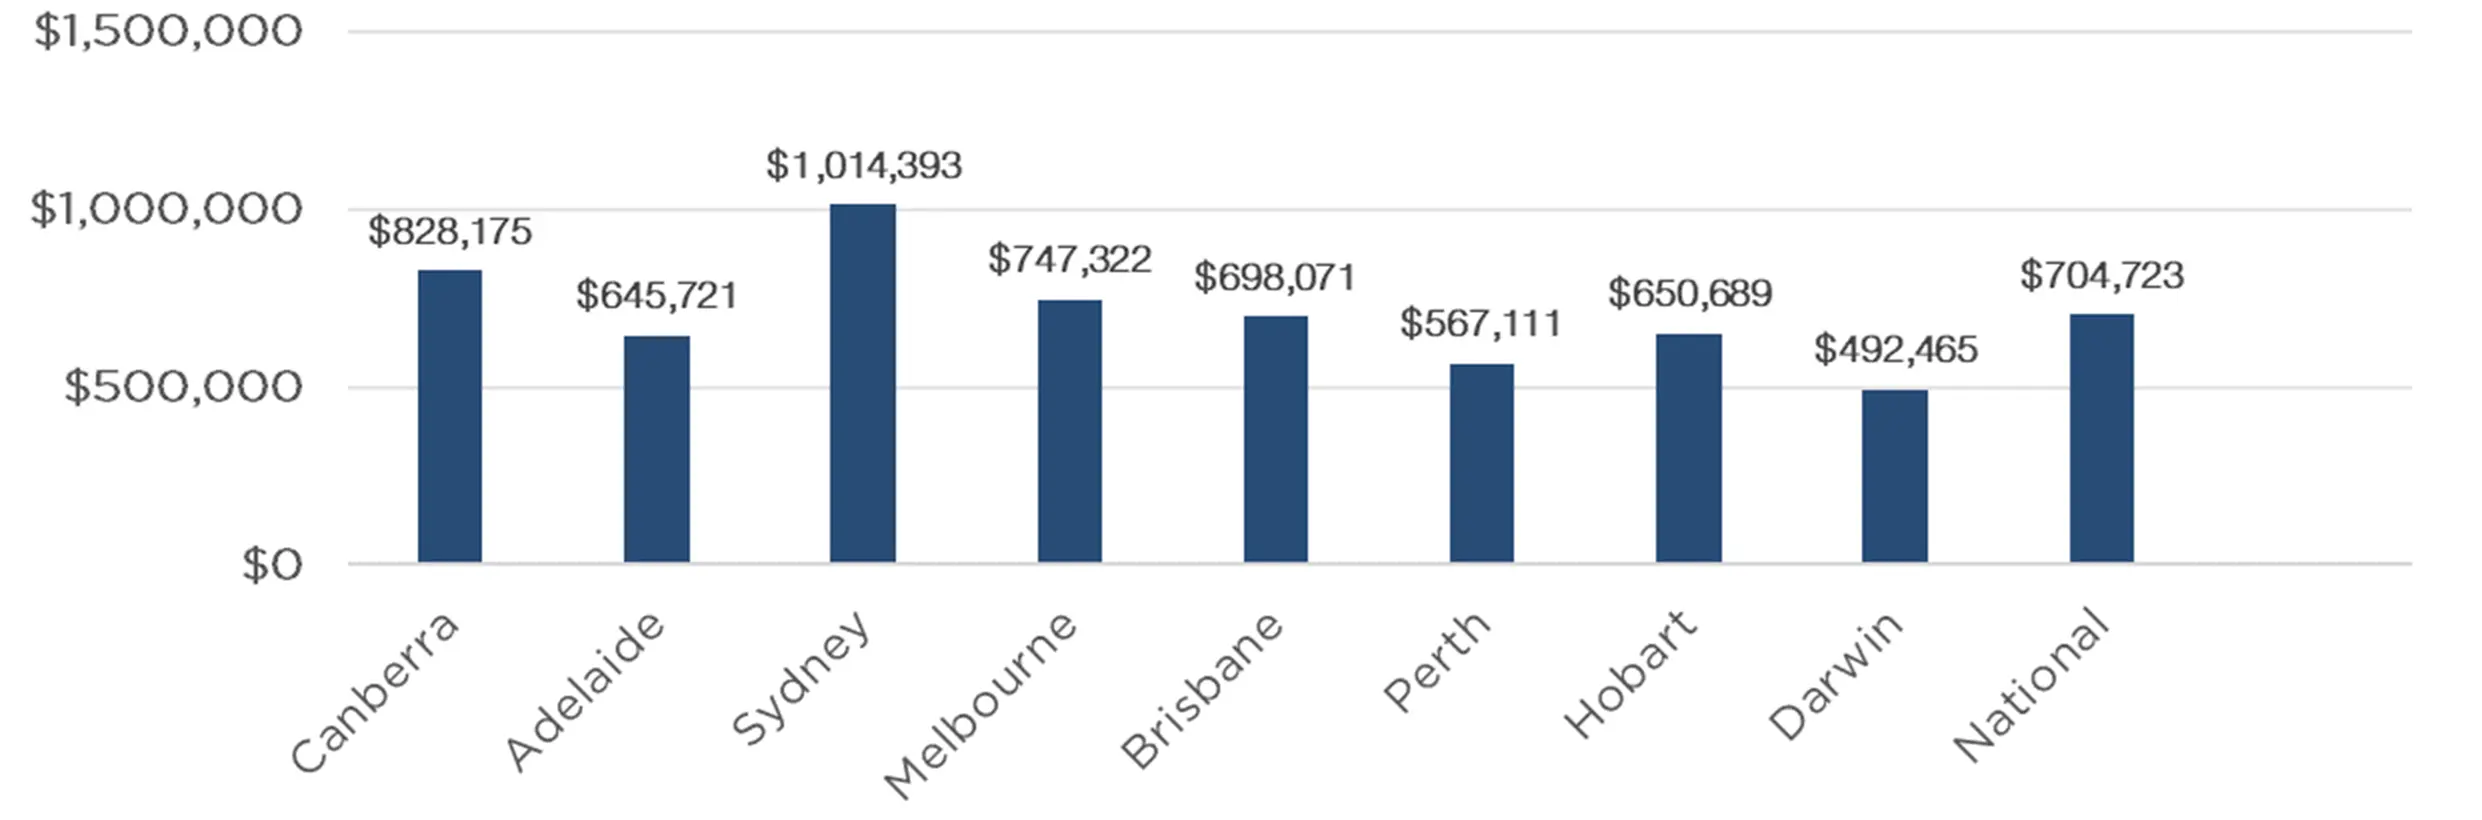 Source: CoreLogic, Report, Article
28 Apr 2023 - Regnan: Investors are still not getting the ESG disclosures they need
|
Regnan: Investors are still not getting the ESG disclosures they need Pendal March 2023 |
|
Companies are increasingly disclosing their exposure to climate risks. But those disclosures often do not give the investors the full picture. Regnan's ALISON EWINGS explains
IT'S been five years since the Task Force on Climate-related Financial Disclosures began trialling voluntary, consistent climate-related financial risk disclosures for use by companies. While take-up has been good, investors still need to see a lot of improvement in ESG-related disclosures, says Alison Ewings, who engages with ASX-listed companies for sustainable leader Regnan. About 80 per cent of big global companies now disclosed in line with at least one of the taskforce's 11 recommendations. But most companies are still taking too narrow a view of climate risks and failing to consider the underlying, system-wide interdependencies and economics risks of climate change that will impact their operations, says Ewings. A Regnan assessment of disclosures shows they are often narrow in scope and place climate transition risks ahead of considering system-wide interdependencies and different potential economic scenarios. Regnan is a leader in sustainable investing and an affiliate of Pendal. Regnan's Head "Look at what's happened in Australia lately -- fire, fire, flood, flood, flood -- everyone who's dependent on the Australian economy has been affected by those things," says Ewings. "But when you look at an individual company you see 'well we're fine'. But you're not fine. You're not an island. You're part of the broader economy. "We think about this as an additional risk that climate change is going to add for every business. "Some businesses are more leveraged to economic activity than others, so they're more exposed, but they're all exposed to some extent. "So instead of saying there's no climate risk, internally we talk about it as there being a background level of risk that is not nil. "This is something that's not being explicitly considered by companies in their TCFD disclosures and we're not sure that it's really being explicitly considered by investors, insurers and banks." Five underlying climate risks for investors Ewings says underlying climate risk can take five main forms. First, general consumer behaviour will likely change as temperatures rise and extreme weather events become more common. This could include changing preferences for food, clothing and holiday destinations, to the need to rebuild after natural disasters or even relocate for more favourable climatic conditions. Second, businesses are all reliant in some way on the underlying infrastructure around them, from roads, telecommunications and power to access to water. Changes to the availability of infrastructure can have profound implications for a business's operations. Third, disruptions in supply chains due to extreme weather, shifting demand or interrupted transportation. Fourth, businesses rely on the resilience of the communities they operate in to maintain their workforce and customer base. Assessing the health of the community should form part of a business's risk assessment. And finally, with extreme weather no longer an infrequent, temporary phenomenon, overall economic growth is likely to be lower. Businesses should reflect this base level reduction in demand in their planning. "The key thing is the interdependency," says Ewings. "Once you get outside of your organisational boundary, that's where things start to fall apart. "For instance, companies do a good job of site-by-site analysis of the impacts of climate change to physical locations. "But it is very rare to see consideration of the infrastructure on which they also rely on like the transport networks that move things to and from those sites. "It's rare to see anything about the resilience of the communities in which their employees work -- it might well be that your factory is fine, but nobody can get there or nobody's feeling like coming to work. "All of these factors should be considered." Author: Alison Ewings, Head of Engagement |
|
Funds operated by this manager: Pendal Focus Australian Share Fund, Pendal Global Select Fund - Class R, Pendal Horizon Sustainable Australian Share Fund, Pendal MicroCap Opportunities Fund, Pendal Sustainable Australian Fixed Interest Fund - Class R, Regnan Global Equity Impact Solutions Fund - Class R, Regnan Credit Impact Trust Fund |
|
This information has been prepared by Pendal Fund Services Limited (PFSL) ABN 13 161 249 332, AFSL No 431426 and is current as at December 8, 2021. PFSL is the responsible entity and issuer of units in the Pendal Multi-Asset Target Return Fund (Fund) ARSN: 623 987 968. A product disclosure statement (PDS) is available for the Fund and can be obtained by calling 1300 346 821 or visiting www.pendalgroup.com. The Target Market Determination (TMD) for the Fund is available at www.pendalgroup.com/ddo. You should obtain and consider the PDS and the TMD before deciding whether to acquire, continue to hold or dispose of units in the Fund. An investment in the Fund or any of the funds referred to in this web page is subject to investment risk, including possible delays in repayment of withdrawal proceeds and loss of income and principal invested. This information is for general purposes only, should not be considered as a comprehensive statement on any matter and should not be relied upon as such. It has been prepared without taking into account any recipient's personal objectives, financial situation or needs. Because of this, recipients should, before acting on this information, consider its appropriateness having regard to their individual objectives, financial situation and needs. This information is not to be regarded as a securities recommendation. The information may contain material provided by third parties, is given in good faith and has been derived from sources believed to be accurate as at its issue date. While such material is published with necessary permission, and while all reasonable care has been taken to ensure that the information is complete and correct, to the maximum extent permitted by law neither PFSL nor any company in the Pendal group accepts any responsibility or liability for the accuracy or completeness of this information. Performance figures are calculated in accordance with the Financial Services Council (FSC) standards. Performance data (post-fee) assumes reinvestment of distributions and is calculated using exit prices, net of management costs. Performance data (pre-fee) is calculated by adding back management costs to the post-fee performance. Past performance is not a reliable indicator of future performance. Any projections are predictive only and should not be relied upon when making an investment decision or recommendation. Whilst we have used every effort to ensure that the assumptions on which the projections are based are reasonable, the projections may be based on incorrect assumptions or may not take into account known or unknown risks and uncertainties. The actual results may differ materially from these projections. For more information, please call Customer Relations on 1300 346 821 8am to 6pm (Sydney time) or visit our website www.pendalgroup.com |
27 Apr 2023 - Performance Report: Insync Global Capital Aware Fund
[Current Manager Report if available]

27 Apr 2023 - Performance Report: Altor AltFi Income Fund
[Current Manager Report if available]

27 Apr 2023 - Investment Perspectives: Banks, balance sheets and bailouts

26 Apr 2023 - Performance Report: Cyan C3G Fund
[Current Manager Report if available]