
NEWS

17 May 2023 - Performance Report: Bennelong Emerging Companies Fund
[Current Manager Report if available]

17 May 2023 - Cashflow matching
|
Cashflow matching abrdn May 2023 In UK, the bulk purchase annuity (BPA) market has seen around £150bn of value transferred from pension schemes to insurers over the last five years. 1 Projections for the next decade suggest further transfers of over £500bn, fuelled in part by higher interest rates improving schemes' funding ratios. Although the backdrop may seem irrelevant in APAC, the capability to efficiently construct cashflow-matching portfolios is of increasing importance to both insurers and pension schemes in the region. In this article, we take a look at how novel portfolio construction techniques offered by asset managers can allow insurers and pension schemes to accurately match their liability cashflows whilst also ensuring their risk appetite and specific fund tolerances are fully considered. HolisticWith a holistic cashflow match framework, it is possible to optimally construct portfolios which offer desirable levels of yield, whilst reflecting all possible specific client specifications and restrictions. This includes clients who want their matching portfolio to meet the requirements for Matching Adjustment (MA) compliance under Singapore RBC 2 currently and the upcoming Hong Kong RBC. An investment manager can also offer pre-trade modelling and optimisation capability As well as portfolio construction, efficient ongoing portfolio management ensures assets also continue to be rebalanced and optimised throughout mandate life cycle. Later in this article we will examine the range of assets and different client specifications that can be embedded into a flexible portfolio construction and management framework. But first, what about risk appetites and tolerances? FlexibleA cashflow matching framework is centred around maximising the correspondence between the asset cashflows and the client's liability cash flow. The latter can be on best estimate basis, or based on guaranteed cash flow, depending on the nature of the mandate requirements. The asset cashflows may also include haircuts reflecting the imperfect FX hedge, necessary for example in matching adjustment mandates. It is through the additional constraints, however, that the portfolio can be tailored to meet client and regulatory requirements. For example, asset managers' tools can include:
Such a framework is flexible enough to meet any requirements or risk appetites. It's also important that asset managers work collaboratively to ensure clients' views and demands are fully reflected in the portfolio construction and on-going fund management tools. The full client life-cycle and all asset classesCashflow-matching managers are able to incorporate the full client life-cycle and a wide range of asset classes ensuring they are particularly well-placed to work with insurers and pension schemes. But what should these clients look out for in terms of manager skills, tools, capabilities and scale? The best teams benefit from a suite of proprietary, on-desk cashflow matching tools and use these to manage sizable matching portfolios in accordance with regulations in different jurisdictions . These tools aid portfolio managers and clients throughout the full lifecycle of such funds: *Initiation of mandates and fund restructuring e.g., a fund uprisking from government bond to credit or switching from credit to higher-rated supranational bonds whilst maintaining the match *Pre-trade modelling to ensure proposed new purchases and switches are suitable from a cashflow matching or on-going matching adjustment compliance point of view. *Portfolio rebalancing/liquidity management to meet cash requirements in and out of the fund. With a fast growing MA market and a limited supply of eligible public securities in local currency, it's a key requirement for MA portfolios to widen the scope of asset classes in order to continue to offer attractive solutions within a competitive market place. As such, in addition to local currency investment grade fixed income securities, best-in-class cashflow matching solutions can include overseas debt, e.g., USD corporate bonds, paired together with cross-currency swaps or repackaged up as a special purpose vehicle. It's a key requirement for Muli-Asset portfolios to widen the scope of asset classes The capability to model private placements, commercial real estate loans, and infrastructure bonds is also crucial. Naturally embedding such securities allows for efficient management of public credit alongside non-public debt within cashflow matched & matching adjustment mandates. Quantitative portfolio designIn short, proprietary quantitative portfolio design can be applied on a wide and diverse investment universe. This design may be tailored to meet clients' needs and constraints. Such a flexible and transparent process also allows for informed discussion between key stakeholders, enabling comparison of the relative merits of a spectrum of matching portfolios with different 'risk-return' profiles. To illustrate this point, we showcase such an 'efficient frontier' of matching adjustment compliant portfolios for a stylised liability profile and a public credit universe in Chart 1 and Chart 2 below. Chart 1 Matching Adjustment 'efficient frontier' constructed from the public credit universe. Typical portfolio issuer/sector /rating constraints. Liabilities c. 12y duration. Close of Business (CoB) 30-Dec-2022. A "Best cashflow match" portfolio with no yield constraint (meets various portfolio limits & MA CF-Match Tests). B Better yielding MA Compliant Portfolio (still meeting all limits & CF-M tests) C Pushing yield at the expense of cashflow match (portfolio only just matching adjustment compliant). Source: abrdn. For illustrative purposes only. Chart 2 Cashflow match plots for the three highlighted portfolios along the MA 'efficient frontier'. Stylised liabilities of c. £1bn PV (present value) and 12-year duration. All portfolios meet the required'Tests'. CoB 30-Dec-2022. Source: abrdn. For illustrative purposes only. The above portfolios also embed insurers' typical issuer, rating and sector limits and demonstrate the benefits of an optimisation exercise, potentially resulting in a 30bps gain in spread whilst retaining an acceptable quality of cashflow matching. A huge opportunity for insurers and pension schemesWith Hong Kong insurers embracing the upcoming Hong Kong RBC and Singapore insurers moving from RBC adoption to RBC optimisation, we are witnessing a trend in APAC similar to what has been ongoing among their European peers. Asset managers with proprietary techniques and insurance asset management capabilities could be well placed to support this journeys that lie ahead. Author: Mark Cathcart, Investment Director, Liability Aware |
|
Funds operated by this manager: Aberdeen Standard Actively Hedged International Equities Fund, Aberdeen Standard Asian Opportunities Fund, Aberdeen Standard Australian Small Companies Fund, Aberdeen Standard Emerging Opportunities Fund, Aberdeen Standard Ex-20 Australian Equities Fund (Class A), Aberdeen Standard Focused Sustainable Australian Equity Fund, Aberdeen Standard Fully Hedged International Equities Fund, Aberdeen Standard Global Absolute Return Strategies Fund, Aberdeen Standard Global Corporate Bond Fund, Aberdeen Standard International Equity Fund, Aberdeen Standard Multi Asset Real Return Fund, Aberdeen Standard Multi-Asset Income Fund 1 Source: Professional Pensions, October 2022 |

16 May 2023 - Performance Report: DS Capital Growth Fund
[Current Manager Report if available]
16 May 2023 - Performance Report: Bennelong Concentrated Australian Equities Fund
[Current Manager Report if available]

16 May 2023 - New Funds on Fundmonitors.com
|
New Funds on FundMonitors.com |
|
Below are some of the funds we've recently added to our database. Follow the links to view each fund's profile, where you'll have access to their offer documents, monthly reports, historical returns, performance analytics, rankings, research, platform availability, and news & insights. |
|
|
|||||||||||||||||||
| Ellerston Overlay Australian Share Fund | |||||||||||||||||||
|
|||||||||||||||||||
|
|
|||||||||||||||||||
 |
|||||||||||||||||||
| Tribeca Vanda Asia Credit Fund - Founders Class | |||||||||||||||||||
|
|||||||||||||||||||
| View Profile | |||||||||||||||||||
 |
|||||||||||||||||||
| Avari Capital Partners - Private Loan Income Fund | |||||||||||||||||||
|
|||||||||||||||||||
| View Profile | |||||||||||||||||||
 |
|||||||||||||||||||
| Victor Smorgon Partners Global Multi-Strategy Fund | |||||||||||||||||||
|
|||||||||||||||||||
| View Profile | |||||||||||||||||||
|
Want to see more funds? |
|||||||||||||||||||
|
Subscribe for full access to these funds and over 700 others |


16 May 2023 - 10k Words | May Edition
|
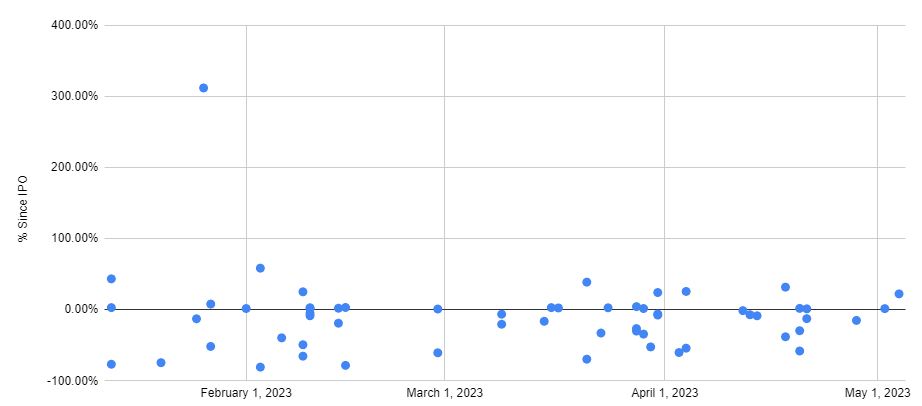
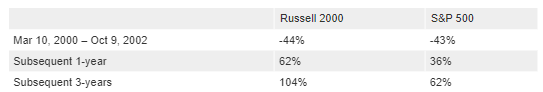
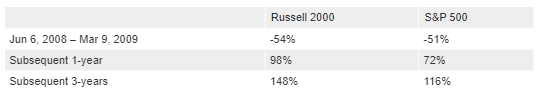
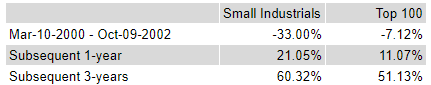
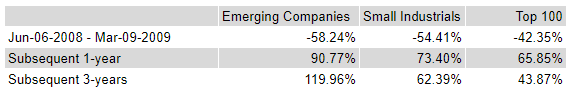
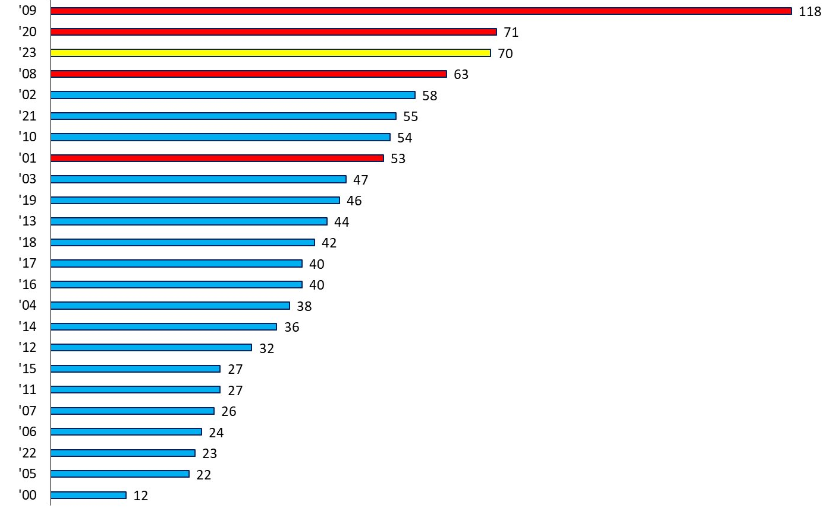
10k Words Equitable Investors May 2023 Miserable IPO returns have been the story even though Kenvue got away with a 22% stag on day one of its US listing last week; a gap has opened between small and large stocks with the "jaws" notable in both price movements and valaution comparisons; in that context it is interesting to see how smaller stocks have outperformed historically coming out of market drawdowns; in Australia the industry survey looks negative but S&P/ASX EPS revisions haven't really been notable; insolvency is on the rise as is US consumer credit card debt; and finally for whoever is advising the state fo Victoria, credit ratings do matter. Distribution of returns from US IPOs by issue date (2023 to date)
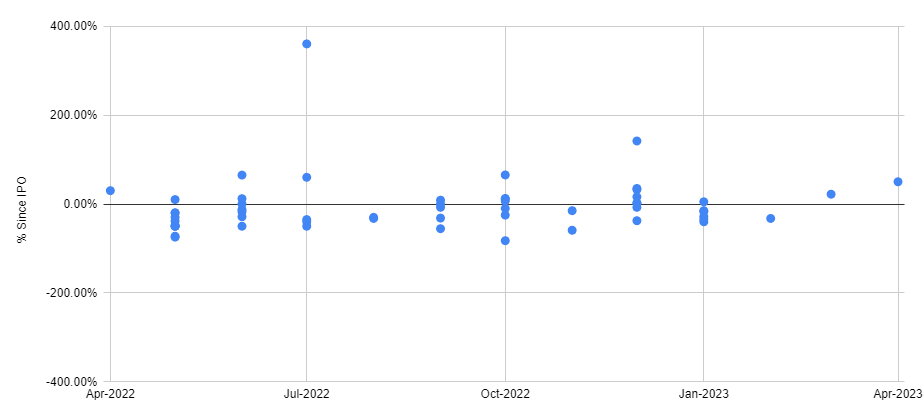
Source: Equitable Investors, StockAnalysis Distribution of returns from ASX IPOs by issue date
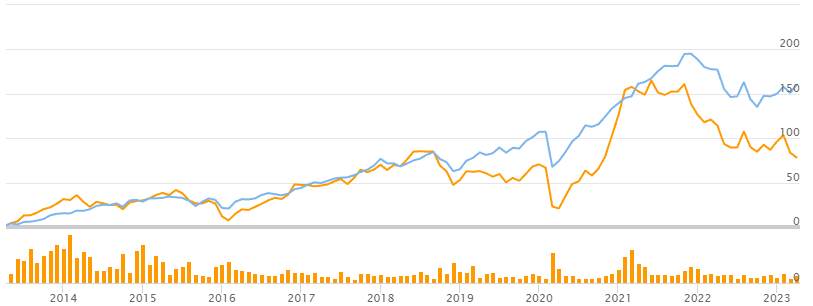
Source: Equitable Investors ASX small caps (SSO - orange) v large caps (STW - blue)
Source: Equitable Investors, TIKR US micro caps (IWC - orange) v large caps (IVV - blue)
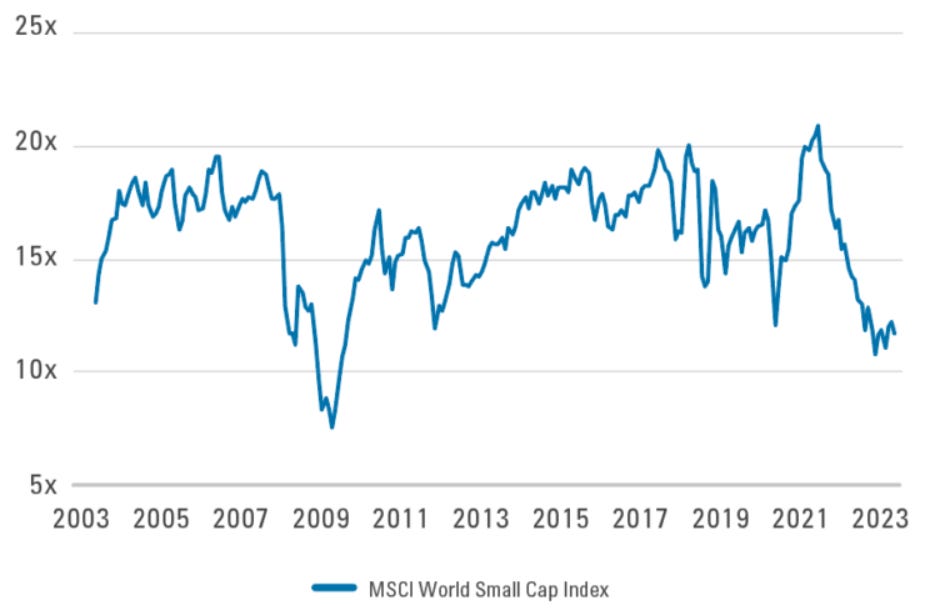
Source: Equitable Investors, TIKR Past 20 Years World Small Cap P/E Ratios
Source: Pzena Nasdaq 100 Price/Sales Ratio
Source: Charles Schwab & Co. US small caps v large caps during & after the "dot-com bubble"
Source: abrdn US small caps v large caps during & after the GFC
Source: abrdn S&P/ASX small v large during & after the "dot-com bubble"
Source: Equitable Investors, Iress S&P/ASX small v large during & after the GFC
Source: Equitable Investors, Iress AIG Industry Index
Source: IFM, AIG Consensus EPS expectations for S&P/ASX 200
Source: Cannacord Large bankruptcies ($US50m+ liabilities) - Jan-Apr count for 2023
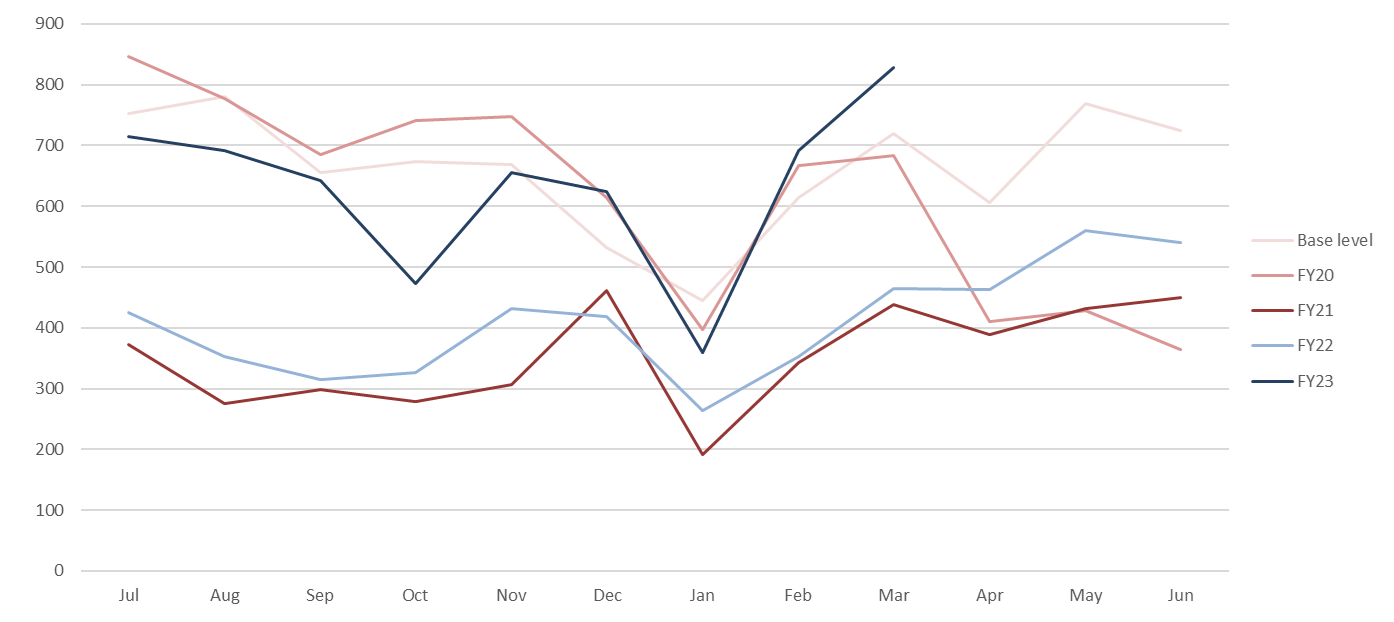
Source: Bloomberg, @jsblokland Australian companies entering external administration for the first time (FY23 = black line)
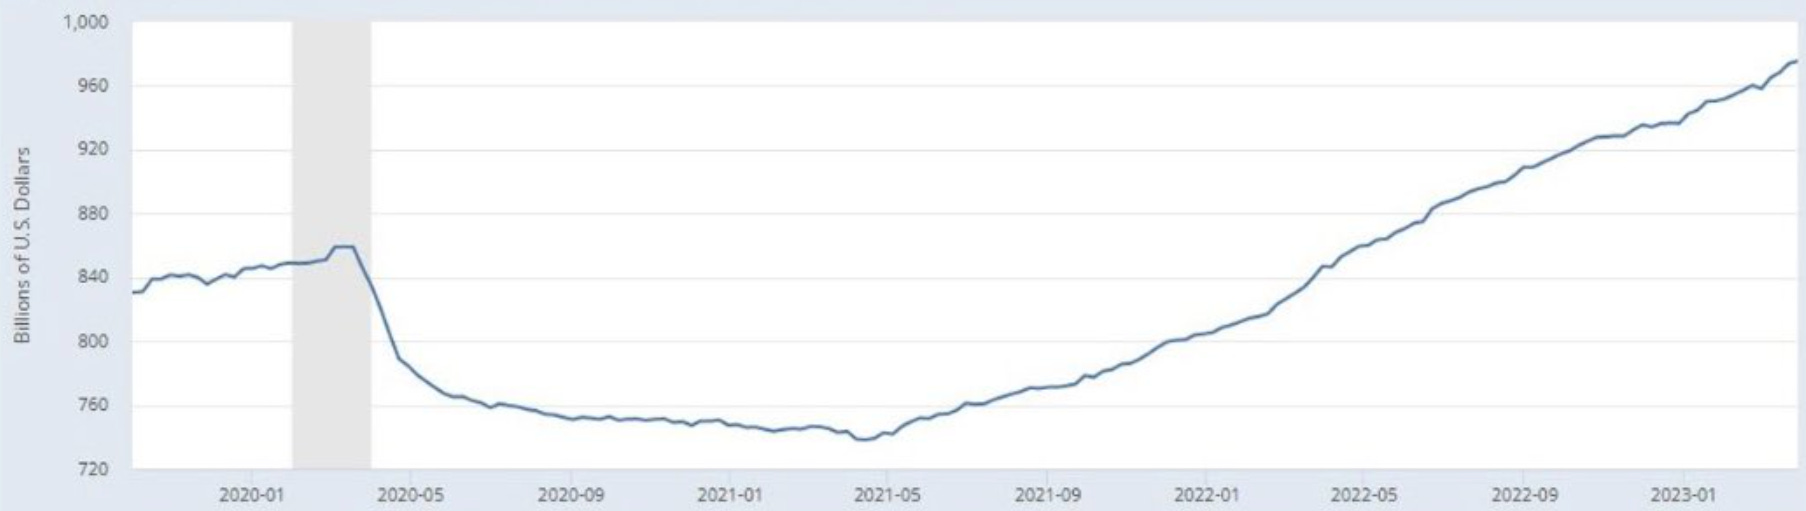
Source: ABS US Consumer Loans (Credit Cards & Other Revolving Plans, All Commercial Banks)
Source: @glightfinancial, FRED Government Bond Yields and their S&P credit ratings
Source: Equitable Investors, worldgovernmentbonds.com May Edition Funds operated by this manager: Equitable Investors Dragonfly Fund Disclaimer Nothing in this blog constitutes investment advice - or advice in any other field. Neither the information, commentary or any opinion contained in this blog constitutes a solicitation or offer by Equitable Investors Pty Ltd (Equitable Investors) or its affiliates to buy or sell any securities or other financial instruments. Nor shall any such security be offered or sold to any person in any jurisdiction in which such offer, solicitation, purchase, or sale would be unlawful under the securities laws of such jurisdiction. The content of this blog should not be relied upon in making investment decisions. Any decisions based on information contained on this blog are the sole responsibility of the visitor. In exchange for using this blog, the visitor agree to indemnify Equitable Investors and hold Equitable Investors, its officers, directors, employees, affiliates, agents, licensors and suppliers harmless against any and all claims, losses, liability, costs and expenses (including but not limited to legal fees) arising from your use of this blog, from your violation of these Terms or from any decisions that the visitor makes based on such information. This blog is for information purposes only and is not intended to be relied upon as a forecast, research or investment advice. The information on this blog does not constitute a recommendation, offer or solicitation to buy or sell any securities or to adopt any investment strategy. Although this material is based upon information that Equitable Investors considers reliable and endeavours to keep current, Equitable Investors does not assure that this material is accurate, current or complete, and it should not be relied upon as such. Any opinions expressed on this blog may change as subsequent conditions vary. Equitable Investors does not warrant, either expressly or implied, the accuracy or completeness of the information, text, graphics, links or other items contained on this blog and does not warrant that the functions contained in this blog will be uninterrupted or error-free, that defects will be corrected, or that the blog will be free of viruses or other harmful components. Equitable Investors expressly disclaims all liability for errors and omissions in the materials on this blog and for the use or interpretation by others of information contained on the blog |


15 May 2023 - Performance Report: Argonaut Natural Resources Fund
[Current Manager Report if available]

15 May 2023 - Airlie Quarterly Update
|
Airlie Quarterly Update Airlie Funds Management April 2023 |
|
Emma Fisher, Portfolio Manager, provides her views on the current market environment and discusses her recent trip to Europe where she visited CSL and QBE Insurance, which are two holdings in the Airlie Australian Share Fund. Author: Emma Fisher, Portfolio Manager Funds operated by this manager: Important Information: Units in the fund(s) referred to herein are issued by Magellan Asset Management Limited (ABN 31 120 593 946, AFS Licence No. 304 301) trading as Airlie Funds Management ('Airlie') and has been prepared for general information purposes only and must not be construed as investment advice or as an investment recommendation. This material does not take into account your investment objectives, financial situation or particular needs. This material does not constitute an offer or inducement to engage in an investment activity nor does it form part of any offer documentation, offer or invitation to purchase, sell or subscribe for interests in any type of investment product or service. You should obtain and consider the relevant Product Disclosure Statement ('PDS') and Target Market Determination ('TMD') and consider obtaining professional investment advice tailored to your specific circumstances before making a decision to acquire, or continue to hold, the relevant financial product. A copy of the relevant PDS and TMD relating to an Airlie financial product or service may be obtained by calling +61 2 9235 4760 or by visiting www.airliefundsmanagement.com.au. Past performance is not necessarily indicative of future results and no person guarantees the future performance of any financial product or service, the amount or timing of any return from it, that asset allocations will be met, that it will be able to implement its investment strategy or that its investment objectives will be achieved. This material may contain 'forward-looking statements'. Actual events or results or the actual performance of an Airlie financial product or service may differ materially from those reflected or contemplated in such forward-looking statements. This material may include data, research and other information from third party sources. Airlie makes no guarantee that such information is accurate, complete or timely and does not provide any warranties regarding results obtained from its use. This information is subject to change at any time and no person has any responsibility to update any of the information provided in this material. Statements contained in this material that are not historical facts are based on current expectations, estimates, projections, opinions and beliefs of Airlie. Such statements involve known and unknown risks, uncertainties and other factors, and undue reliance should not be placed thereon. Any third party trademarks contained herein are the property of their respective owners and Airlie claims no ownership in, nor any affiliation with, such trademarks. Any third party trademarks that appear in this material are used for information purposes and only to identify the company names or brands of their respective owners. No affiliation, sponsorship or endorsement should be inferred from the use of these trademarks.. This material and the information contained within it may not be reproduced, or disclosed, in whole or in part, without the prior written consent of Airlie. |
12 May 2023 - Performance Report: Bennelong Twenty20 Australian Equities Fund
[Current Manager Report if available]

12 May 2023 - Performance Report: Skerryvore Global Emerging Markets All-Cap Equity Fund
[Current Manager Report if available]