NEWS

23 Jun 2022 - Performance Report: Insync Global Quality Equity Fund
| Report Date | |
| Manager | |
| Fund Name | |
| Strategy | |
| Latest Return Date | |
| Latest Return | |
| Latest 6 Months | |
| Latest 12 Months | |
| Latest 24 Months (pa) | |
| Annualised Since Inception | |
| Inception Date | |
| FUM (millions) | |
| Fund Overview | Insync invests in a concentrated portfolio of high quality companies that possess long 'runways' of future growth benefitting from Megatrends. Megatrends are multiyear structural and disruptive changes that transform the way we live our daily lives and result from a convergence of different underlying trends including innovation, politics, demographics, social attitudes and lifestyles. They provide important tailwinds to individual stocks and sectors, that reside within them. Insync believe this delivers exponential earnings growth ahead of market expectations. Insync screens the universe of 40,000 listed global companies to just 150 that it views as superior. This includes profitability, balance sheet performance, shareholder focus and valuations. 20-40 companies are then chosen for the portfolio. These reflect the best outcomes from further analysis using a proprietary DCF valuation, implied growth modelling, and free cash flow yield; alongside management, competitor, and industry scrutiny. The Fund may hold some cash (maximum of 5%), derivatives, currency contracts for hedging purposes, and American and/or Global Depository Receipts. It is however, for all intents and purposes, a 'long-only' fund, remaining fully invested irrespective of market cycles. |
| Manager Comments | The Insync Global Quality Equity Fund has a track record of 12 years and 8 months and has outperformed the Global Equity Index since inception in October 2009, providing investors with an annualised return of 11.84% compared with the index's return of 10.71% over the same period. On a calendar year basis, the fund has only experienced a negative annual return once in the 12 years and 8 months since its inception. Over the past 12 months, the fund's largest drawdown was -24.82% vs the index's -11.86%, and since inception in October 2009 the fund's largest drawdown was -24.82% vs the index's maximum drawdown over the same period of -13.59%. The fund's maximum drawdown began in January 2022 and has lasted 4 months, reaching its lowest point during May 2022. During this period, the index's maximum drawdown was -11.86%. The Manager has delivered these returns with 1.53% more volatility than the index, contributing to a Sharpe ratio which has fallen below 1 five times over the past five years and which currently sits at 0.83 since inception. The fund has provided positive monthly returns 82% of the time in rising markets and 20% of the time during periods of market decline, contributing to an up-capture ratio since inception of 83% and a down-capture ratio of 86%. |
| More Information |

23 Jun 2022 - Winning the war on talent
|
Winning the war on talent Claremont Global May 2022 As global fund managers, one of the most important areas of focus for many of the companies we research is around talent acquisition and retention. This issue goes beyond not just ensuring the brightest minds remain on the books but also extends towards becoming an employer of choice in an increasingly competitive market. This is made all the more difficult due to the growing expectations laid down or justly expected by a labour pool that is, as we stand today, heavily in demand. As a result, it is becoming more and more intrinsic to a company's position within their respected industry to ensure their organisation is, in fact, an attractive proposition for any prospective candidate. A winning talent management strategy therefore should be viewed as a robust advantage, that may prove to be just as critical to the company's long-term success as the competitive moat around the business itself. Employee retention - an 'old school' metric or one to cast a sharp eye over?One metric that can get often overlooked is that of the retention rates of company staff. Whether it relates to a technology business, a retailer, or a consulting firm, the cost of replacing any given employee is greatly underappreciated. According to estimates out of the Work Institute's 2017 Report, the replacement cost for an employer averages roughly 33% of an employee's annual salary for their exit. A company we believe is industry standard when it comes to placing a stringent focus on retaining its talent and expertise is the paintings and coatings business, Sherwin-Williams (SHW-US), which operate close to 5,000 stores around the US. While providing competitive compensation and benefits for its staff, the company prides itself on the discipline of its execution and is known to train staff "like the military". Store managers usually start as graduates but are often treated as business owners. This may sound like a talent strategy from a bygone era, however, this tried-and-tested method from a 155-year-old company creates an exceptionally low staff turnover of 7-8%, or 5-6% for store managers and sales reps. We begin to appreciate how impressive this number is when measured against the US Bureau of Labour Statistics' annual turnover figures across both retail and wholesale channels. Annual US employee turnover by sales channel
Source: US Bureau of Labour Statistics This incredibly low churn creates real loyalty from the company's professional customers, who take comfort in the fact that the staff member they are dealing with on a daily basis is, in fact, an expert in what they sell. "The managers of the big brands have a very clear responsibility. It's attracting and keeping talented people in order to sustain and build the trustworthiness of that brand. There is no clearer objective in the economy. Your economic success depends on expanding and building your economies of trustworthiness." - Robert Reich The company also pushes the notion of upward mobility (everyone knows the CEO started in the stores), providing a tangible path to move into management positions, and areas of increased responsibility, if they remain at the business over the long term. The growing importance of scaleThe aptly termed "war on talent" could not currently be any more evident than in the technology and digital industries. The sheer pace at which the world has evolved in partnership with an accelerated digital transition through the pandemic has pushed demand for top-quality personnel to an extreme level. One of the key dynamics we have noticed is the unmatched strength at which the large technology firms are able to exert when looking to attract talent out of a thinning top-end labour market. These larger technology players are able to offer potential candidates extremely competitive pay and benefits packages, heavy investment in training and strong career progression opportunities ― in addition to offering a meaningful company mission and purpose that may strike a chord with those looking to make a tangible difference in how we live our everyday lives. As we can see in the chart below, many of Sherwin-Williams' competing players are struggling to compete for top-end talent due to the likes of the "hyper-scalers" sucking up this talent at unprecedented rates. The company's older and arguably less-savvy competitors are suffering "brain drain" if desired work experiences, compensation and benefits, or career progression opportunities are not fulfilled. US software engineer and software developer hires
Source: BainAura talent platform, Bain For context, while many companies were furloughing staff amid the pandemic's economic fallout, Microsoft (MSFT-US) saw its employee base rise 18,000 or 11%, with Alphabet's (GOOGLE-US) base also rising net 16,000 employees or 13%. This has developed into a seriously large competitive advantage for the large technology firms and, as current shareholders of both companies, provides us with comfort that they will be able to continually drive innovation and product development with the pools of talent they have in their corner. "What's most impressive is that your team (Google) has built the world's first self-replicating talent machine. You've created a system that not only hires remarkable people, but also scales with the company and gets better with every generation." - Paul Otellini, Former President and CEO, Intel An alternative strategyThis system of managing and curating talent extends beyond simply retaining existing personnel and hiring new staff. The strategy of careful, diligent M&A to bring in experts that not only have the skills to drive sustained innovation and product development but actually want to work for the broader organisation, is one that cannot be overlooked. We see this dynamic present itself in areas such as medical and analytical instruments, where it can be more efficient to bring in a team of scientists or technicians through bolt-on acquisitions into the umbrella organisation, rather than invest in years of internal R&D and training in order to develop specific products or technologies. We have been most impressed by this method of talent management through another one of our portfolio holdings, Agilent Technologies (A-US). Their large team of highly skilled field scientists is one of the most underappreciated assets of their business and the retention of this talent is critically important to the sustainability of their business model. This was shown over the course of the pandemic when they did not move to reduce staff, nor did they cut base pay or hours, as a response to the temporary disruptions across the business. According to Agilent's CEO Mike McMullen, this has led to attrition rates that sit at much lower levels than peers in the market. However, a key piece in the evolution of their team of scientists is the onboarding of R&D teams through focused acquisitions of appropriate target companies, subsequently integrating them into the larger Agilent ecosystem. This can be witnessed through one of their most recent acquisitions in BioTek, a leading cell analysis business, of which then-owners, the Alpert family, sought to sell their company to Agilent as they appreciated the prevailing culture and long-term synergies across their respective R&D teams. "The cultural alignment, the consistency and commitment to the same sort of core values really do matter." - Mike McMullen, Agilent CEO, Goldman Sachs Healthcare Conference, Jan-21 Agilent's stringent focus on an engineering-led culture allows them to present themselves as an attractive suitor to smaller, niche businesses with bands of top-end scientists and experts in their fields that do not necessarily want to be swept into a corporate behemoth. This enables them to not only bolster the talent pool across the organisation but retain them over the long term, which will, in turn, materialise into tangible value creation for shareholders through sustained innovation and product development. Intrinsic to longevityTalent management can no longer be dismissed as simply an HR problem. It is becoming so critical in today's world that if a company mismanages its workforce, a loss of competitive advantage and profitability will present itself as the most likely outcome. The subsequent costs of recruiting, training, loss of expertise, potentially fractured relationships with customers, wage inflation, and cultural tearing all need to be placed in heavy consideration when curating a talent management strategy. We ensure that the businesses we invest in and research at Claremont Global have sound strategies in place to manage their pool of talent, ensuring that they not only retain the best people but also attract top-flight talent in the market to drive sustained innovation and product development well into the future. Authors and consultants, Rob Silzer & Ben Dowell, capture this phenomenon perfectly: "Talent management is more than just a competitive advantage; it is a fundamental requirement for business success." - Silzer & Dowell, Strategy-Driven Talent Management: A Leadership Imperative. Author: Luke Davrain, CFA, Investment Analyst Funds operated by this manager: |

22 Jun 2022 - Performance Report: Insync Global Capital Aware Fund
| Report Date | |
| Manager | |
| Fund Name | |
| Strategy | |
| Latest Return Date | |
| Latest Return | |
| Latest 6 Months | |
| Latest 12 Months | |
| Latest 24 Months (pa) | |
| Annualised Since Inception | |
| Inception Date | |
| FUM (millions) | |
| Fund Overview | Insync invests in a concentrated portfolio of high quality companies that possess long 'runways' of future growth benefitting from Megatrends. Megatrends are multiyear structural and disruptive changes that transform the way we live our daily lives and result from a convergence of different underlying trends including innovation, politics, demographics, social attitudes and lifestyles. They provide important tailwinds to individual stocks and sectors, that reside within them. Insync believe this delivers exponential earnings growth ahead of market expectations. The fund uses Put Options to help buffer the depth and duration that sharp, severe negative market impacts would otherwide have on the value of the fund during these events. Insync screens the universe of 40,000 listed global companies to just 150 that it views as superior. This includes profitability, balance sheet performance, shareholder focus and valuations. 20-40 companies are then chosen for the portfolio. These reflect the best outcomes from further analysis using a proprietary DCF valuation, implied growth modelling, and free cash flow yield; alongside management, competitor, and industry scrutiny. The Fund may hold some cash (maximum of 5%), derivatives, currency contracts for hedging purposes, and American and/or Global Depository Receipts. It is however, for all intents and purposes, a 'long-only' fund, remaining fully invested irrespective of market cycles. |
| Manager Comments | The Insync Global Capital Aware Fund has a track record of 12 years and 8 months and has underperformed the Global Equity Index since inception in October 2009, providing investors with an annualised return of 9.89% compared with the index's return of 10.71% over the same period. On a calendar year basis, the fund has experienced a negative annual return on 2 occasions in the 12 years and 8 months since its inception. Over the past 12 months, the fund's largest drawdown was -25.39% vs the index's -11.86%, and since inception in October 2009 the fund's largest drawdown was -25.39% vs the index's maximum drawdown over the same period of -13.59%. The fund's maximum drawdown began in January 2022 and has lasted 4 months, reaching its lowest point during May 2022. During this period, the index's maximum drawdown was -11.86%. The Manager has delivered these returns with 0.9% more volatility than the index, contributing to a Sharpe ratio which has fallen below 1 five times over the past five years and which currently sits at 0.72 since inception. The fund has provided positive monthly returns 81% of the time in rising markets and 22% of the time during periods of market decline, contributing to an up-capture ratio since inception of 59% and a down-capture ratio of 82%. |
| More Information |

22 Jun 2022 - It's time to hedge - the bear is here
|
It's time to hedge - the bear is here Watermark Funds Management June 2022 REVIEW The Australian share market saw a significant contraction in May with the All-Ordinaries Index down 3.0%, its worst month since January. The sell-off was once again led by Technology stocks with the sector down 8.7%. The Real Estate sector also performed poorly, down 8.9%, led by concerns of more aggressive interest rate tightening and associated impacts on demand. After a soft April, the Materials sector resumed its outperformance in May, aided by expectations of more stimulus in China. In terms of factor leadership, value resumed its leadership over growth. The value factor has now outperformed growth by 20% over the last 6 months. MARKET OUTLOOK The secular bull market that ended for Australian shares last August emerged from the financial crisis and was a product of successive waves of liquidity led asset reflation, as central banks pushed real interest rates lower and lower and asset values higher and higher (Fig1). Figure 1: Successive waves of asset inflation Source: Bloomberg, S&P 500 Chart Asset inflation, of course, created excess demand, leaving product and labour markets acutely tight. Unemployment in Australia is now at its lowest in 40 years and with little immigration, the services sector is scrambling to find workers. Fair Work Commission awarded a 5.2% increase in the minimum wage, well above expectations. This policy led bonanza for asset owners was a consequence of systemic deflation. No one has a complete explanation for the root cause of this deflation which you can see clearly in the value of bonds which have pushed higher for decades (long term interest rates have been falling). The first phase took place in the 1980's with back-to-back global recessions that killed the inflation of that era. Then in the early 1990's with the collapse of the Soviet Union we had a rapid expansion of western democracies, a deepening of capital markets and the globalisation of trade. This spread of the neo-liberal 'rules based' order (capitalism) was deflationary allowing interest rates to fall and debt balances to accumulate. The spoils of this period where not spread evenly however, laying the seeds of its demise. Asset owners captured all the gains while labour's share of GDP has fallen sharply. We now have the first generation of citizens in the west who are worse off than their parents in real terms. The emergence of popularism and de-globalisation were the first phase of its descent. A new cold war between the East and West has manifested the next phase. With this reversal in these deflationary forces, the good times of ample liquidity and asset reflation have passed. Even before the health crisis, we were approaching the limits of these policies in driving asset values higher as bond yields in many western countries were already negative. On a hold to maturity basis, investors were guaranteed a loss, which of course is nonsensical. Then with the health crisis, policy makers doubled down on these same policies. The excess demand created from emergency stimulus and the associated supply chain disruptions have unleashed inflation which will be with us for years to come. Investors need to ask two important questions: Are the deflationary forces that persisted for so long still around or has their demise contributed to the inflation we are seeing today? Secondly, what has caused this inflation, is it established or transitory? How these inflationary pressures play out will determine the duration of this bear market. If the inflation hangs around for years to come as expected then we are in a secular bear, if it is transitory and the deflationary forces resume/return then potentially shares can make new highs in the years ahead. We are still early in this bear market. Until inflation moderates and central banks back away from hiking rates further, shares will move lower in the medium term. In the short term at least, share markets globally are oversold and sentiment is extremely bearish. In the weeks and potentially months ahead, we should see a decent bear market rally which investors should sell into as the big drawdown is still ahead in the second half of the year. Australian shares have proven remarkably resilient through this first phase of the drawdown given our economy's exposure to commodities which are the driving force behind the inflation we are seeing. In simple terms, the Australian economy is a good inflation hedge. The 'quarry and farm' may once again avoid another global recession. As we get into the 3rd quarter of the year however, around the US mid-term elections, western economies will be slowing quickly and the 'street' will be slashing profit estimates, pushing shares lower. This becomes a pivotal moment for investors as the policy response will determine the next move for shares. If the inflation data improves as everyone expects, Central Banks may 'pause' on any further policy tightening. Under this scenario economies slow but avoid recession and shares can stage a significant rally early into next year. However, an early pause only ensures inflation lingers for longer, leaving us with 'stagflation'. Alternately, Central Banks look to overshoot in tightening financial conditions further to kill inflation, only to push western economies into recession. Under this scenario shares obviously fall further into the first half of next year. The policy response as the economy slows, asset values fall, and inflation moderates will determine which path the market follows. Either way the medium-term outcome is much the same, shares will be lower. The emerging data is less than encouraging, with the May CPI report showing further deterioration, Central Banks are once again losing credibility as they were guiding to a moderation in the data. It seems they still have a lot more to do evident in the FOMC decision to increase the target interest rate by a full 75bpts (3 hikes in 1), which is unprecedented. With the broader offshore indexes down more than 20% we are now officially in a bear market for shares with investors seemingly still pricing in a soft-landing scenario (green line below in Fig 2). They have never tightened once shares have fallen into a bear market before (down >20%), a further demonstration of just how far behind the curve they find themselves. Given inflation has never been tamed once it gets above 5% without a recession, a recession more than likely beckons and we move lower (the red line in Fig 2). Figure 2: Market drawdowns with and without recessions Source: Stifel While we have seen some contraction in valuations (P/E's) already as financial conditions have tightened, we are yet to see any move lower in profit expectations. With the demand shock from the COVID stimulus, many public companies are over earning, profits have moved well above trend. In a garden variety recession earnings typically fall by a least one third Fig 3 below. Figure 3: S&P 500 Profit (EPS) drawdowns from prior peaks Source: Stifel If we are in a stagflation environment of lower growth and persistent inflation, then valuations may well move to the lower end of the historic range (P/E's are low during periods of inflation) which along with lower earnings leaves us with a share market that still has a long way to fall. SECTORS IN REVIEW The Consumer sector delivered a flat result for the month, with gains in supermarket shorts, offsetting losses in some consumer growth stocks. Our long position in the Fuel Marketers has been gaining momentum as fuel security becomes an increasing issue for Western Governments. Ampol (ALD) and Viva Energy (VEA) refining assets, historically loathed by the market, are now generating super returns and driving upgrades for both companies. This sector is under-owned and offers defensive exposure at a cheap multiple. As mentioned in the April monthly, the Agriculture sector is building as fertile ground for short ideas. Share prices have risen aggressively given the confluence of a strong domestic grain harvest, and sky-high soft commodity prices driven by supply-chain dislocation. We know however, as with all highly cyclical industries, that conditions are ever changing, and we should be careful extrapolating at either the top or the bottom of the cycle. Using a 'normal season' as the basis for valuation, earnings multiples look extreme. We see several catalysts, including the successful negotiation of a humanitarian export corridor in the Black Sea to correct over-inflated soft commodity prices. Financials had a flat month in terms of attribution. Our shorts in the Banks delivered returns, as we saw the beginning of a major sell off across the sector. Banks had held up well for most of the broader market volatility of 2022. This changed when investors came to appreciate the consequences of faster than expected rate rises. We have been highlighting for some time the nexus between bank returns and the property market. Offsetting these profits was weakness in our long position Macquarie Group (MQG), we continue to see good earnings prospects for Macquarie in the short term amidst the energy market volatility. Commodities trading remains a key driver of results. Technology delivered some modest positive returns. Largely from our short portfolio. The sector continues to be the most sensitive to higher than expected inflation outcomes. Which are then leading to higher interest rates expectation. Selling across the sector has been indiscriminate. The Building Material companies continue to come under considerable pressure as it has become clearer that interest rates will be moving a lot higher. This is the case not just for the local Builders but the US based ones as well James Hardie (JHX) and Reliance Worldwide Corporation (RWC). As manufacturing businesses these companies are also very exposed to escalating fuel and energy costs. In Media, cyclical business like Nine Entertainment (NEC) and Seven West Media (SWM) have come under considerable pressure on fears of a fall in advertising spending. NEC shares are starting to look attractive with a full recession now factored in. Contractors: We expect the resources sector to hold together relatively well even as growth slows elsewhere. Monadelphous (MND) an important contractor in energy and iron ore operating in WA should perform well in the years ahead, especially as energy investments picks up. The iron ore hubs are so large and established now, having doubled in size over the last 15 years, spending in this sector will remain elevated for years to come. As a defensive sector, Healthcare has held up relatively well in a difficult market, it's probably time to take profits here. Resources: The lithium sector has fallen hard following some negative research pieces suggesting the market is over supplied in the medium term as Chinese production ramps up. We have a balanced portfolio of attractively prices emerging producers/explores and a short portfolio of expensive explorers in preproduction. Producers of bulk commodities have held up very well in recent weeks, it's time to take profits in some of the iron ore miners in particular. The iron ore prices is still above $150/t and looks vulnerable here. Funds operated by this manager: Watermark Absolute Return Fund, Watermark Australian Leaders Fund, Watermark Market Neutral Fund Ltd (LIC) |

22 Jun 2022 - It's time to take advantage of share price falls
|
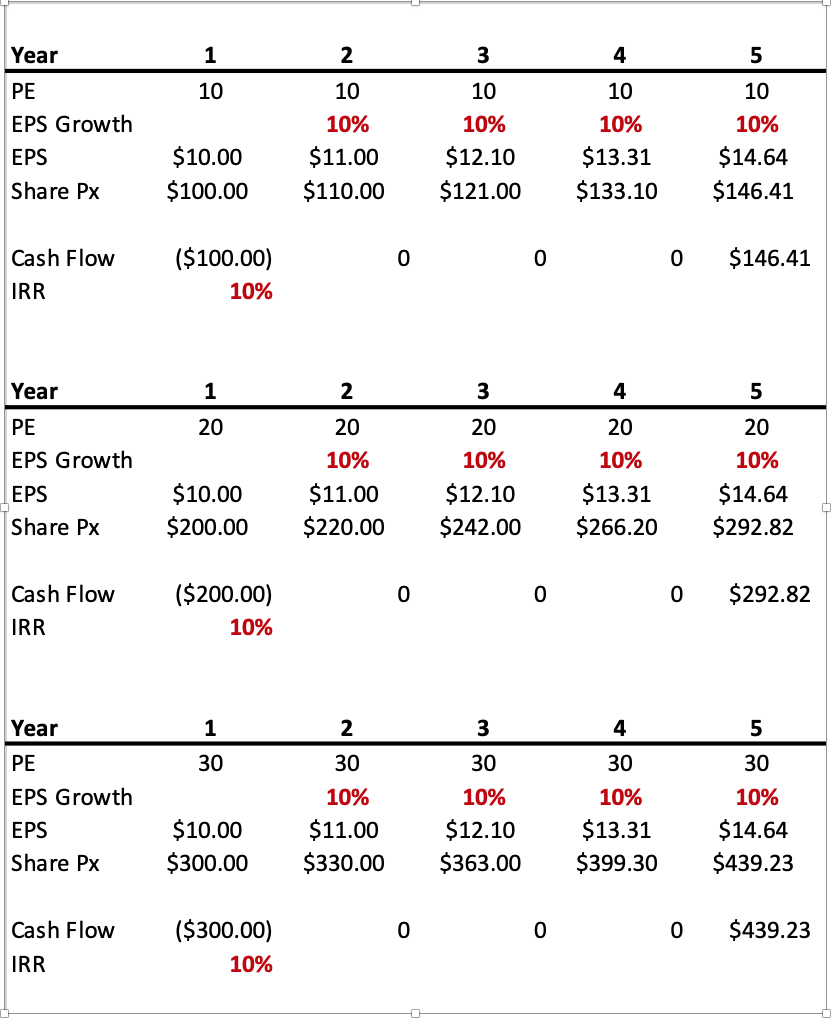
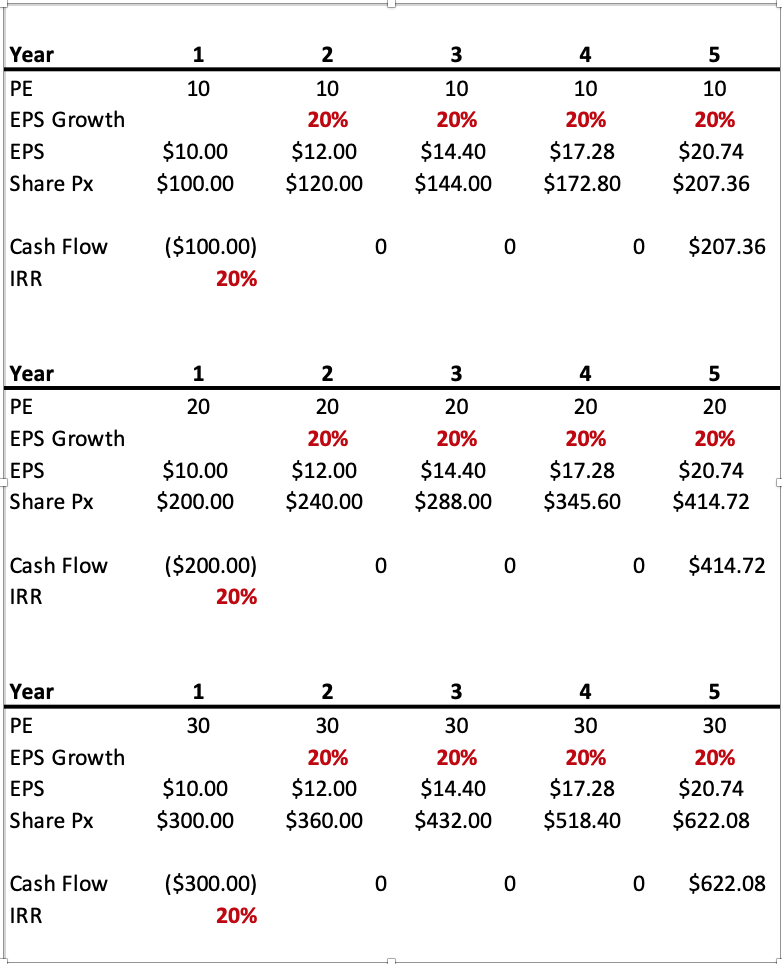
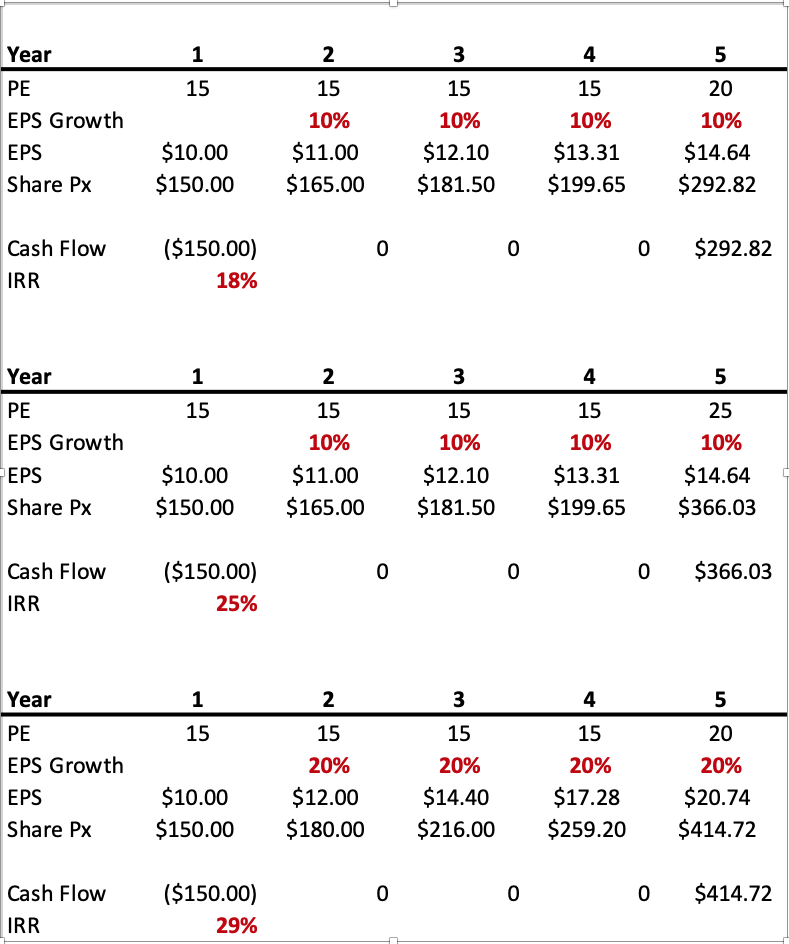
It's time to take advantage of share price falls Montgomery Investment Management May 2022 The price-to-earnings ratios of many quality businesses have fallen sharply over the last six months. In many cases, the falls were justified. Now that valuations have dropped, I believe investors have a far better chance of making attractive returns. The proviso, of course, is that you buy businesses that grow their earnings. Celebrating the recent fall in share prices might be a step too far, but investors who plan to be net buyers of equities should be at least a little excited about the recent declines. The ASX 200 decline year-to-date of just 3.4 per cent masks the more serious declines of even the highest quality companies. Indeed, 112 of the biggest 200 companies listed on the ASX are below their price at the beginning of the year. And the average decline is 17.7 per cent. The median decliner is down 15.4 per cent. Zip is off 76 per cent year-to-date, Pointsbet is down 60 per cent, Kogan is 47 per cent lower, Boral is 43 per cent below its price at the beginning of the year, and even high-quality company, Reece, is 38 per cent weaker. Meanwhile, other high-quality companies such as REA Group, Wesfarmers, ARB Corporation, Credit Corp and Super Retail Group are off between 15 and 25 per cent in less than 16 weeks. Of course all of this is happening because inflation is surprising to the upside, scaring many investors as well as central bankers. And in response the central bankers are reversing the massive stimulus that was foisted on markets and economies in response to COVID-19. The punch bowl that drove massive asset inflation during the pandemic is being taken away. It really is as simple as that. The US Federal Reserve will put its balance sheet on a new course, reducing its size by up to a trillion US dollars per year. So there's no debating; we are in the midst of a correction. There is however a silver lining. PE ratios have compressed materially over the course of the last six months. Now that they are lower, investors have a better chance of making attractive returns, provided they buy businesses that can grow earnings. Let me explain with a few simple tables. Table 1. Internal rates of return equal earnings growth when PEs remain constant. Table 1 demonstrates the investor's return, from buying and selling a share at the same PE multiple, matches the rate of earnings growth. In all three examples the earnings growth is 10 per cent per annum. It matters not whether the stock was purchased at 10, 20 or 30 times earnings; the investor's internal return will match the earnings growth rate provided the shares are sold at the same PE multiple that was paid for them. Table 2. Internal rates of return equal earnings growth when PEs remain constant Table 2 simply reinforces the earlier point. On this occasion the EPS growth rate is 20 per cent in all cases and irrespective of the PE the investor's return matches the EPS growth rate provided the shares and purchased and sold on the same PE. China's economic woes, the invasion of Ukraine, supply chain disruptions and the possibility of recessions and stagflation have all offered reasons for investors to sell stocks to the extent PE's have compressed materially. As I mentioned earlier however it doesn't matter what the contemporaneous catalysts are, throughout history whenever rates go up or inflation accelerates, PE have compressed - without exception. Now that PEs have compressed, investors must find businesses whose earnings will grow. Warren Buffett once observed: "Your goal as an investor should be simply to purchase, at a rational price, a part interest in an easily understood business whose earnings are virtually certain to be materially higher, five, ten, and twenty years from now." Compressed PEs may offer that "rational" price. PE ratios can of course fall further and any escalation of tensions between Western allies and China or Russia would certainly do that. Investors would have to simply ride through what we all hope would be a temporary interruption to the peace the western world has mostly enjoyed since the fall of the Berlin Wall. To protect oneself from the idiosyncratic risk of PE contraction, it is important that not only does the company's earnings grow, but they grow at a rate that meets or exceeds market expectations. If growth is expected to be 20 per cent and comes in at 18 per cent, the PE may contract further, offsetting the benefits accrued to investors from the earnings growth. Table 3. A bonus from PEs bouncing. Assuming global peace is maintained, investors have another benefit from investing after PE compression. Inflation will eventually peak and interest rates will eventually stop being raised. At that point PE ratios may start to expand again. Table 3 reveals the bonus in terms of internal rates of returns earned by investors from a jump in PE ratios at the time of sale. In the first example, shares are purchased on a PE of 15 and earnings grow by 10 per cent per annum. If the PE stayed at 15 at the time of sale, the investor would earn 10 per cent per annum. But in this example, in the final year, the PE jumps to 20 times. The result is an 18 per cent per annum return. PE compression and stock market falls may just be the rational price investors in equities and managed funds have been waiting for. Author: Roger Montgomery, Chairman and Chief Investment Officer Funds operated by this manager: Montgomery (Private) Fund, Montgomery Small Companies Fund, The Montgomery Fund |

21 Jun 2022 - Performance Report: L1 Capital Long Short Fund (Monthly Class)
| Report Date | |
| Manager | |
| Fund Name | |
| Strategy | |
| Latest Return Date | |
| Latest Return | |
| Latest 6 Months | |
| Latest 12 Months | |
| Latest 24 Months (pa) | |
| Annualised Since Inception | |
| Inception Date | |
| FUM (millions) | |
| Fund Overview | |
| Manager Comments | The L1 Capital Long Short Fund (Monthly Class) has a track record of 7 years and 9 months and has outperformed the ASX 200 Total Return Index since inception in September 2014, providing investors with an annualised return of 23.53% compared with the index's return of 7.57% over the same period. On a calendar year basis, the fund has only experienced a negative annual return once in the 7 years and 9 months since its inception. Over the past 12 months, the fund's largest drawdown was -7.21% vs the index's -6.35%, and since inception in September 2014 the fund's largest drawdown was -39.11% vs the index's maximum drawdown over the same period of -26.75%. The fund's maximum drawdown began in February 2018 and lasted 2 years and 9 months, reaching its lowest point during March 2020. The fund had completely recovered its losses by November 2020. The Manager has delivered these returns with 6.36% more volatility than the index, contributing to a Sharpe ratio which has fallen below 1 two times over the past five years and which currently sits at 1.09 since inception. The fund has provided positive monthly returns 79% of the time in rising markets and 66% of the time during periods of market decline, contributing to an up-capture ratio since inception of 93% and a down-capture ratio of -2%. |
| More Information |

21 Jun 2022 - Megatrends drive sustainable growth
|
Megatrends drive sustainable growth Insync Fund Managers May 2022 Megatrends enable us to locate the sustainable outsized market growth opportunity stock hunting-grounds (as well as help us avoid those that will dwindle). They are the 'fuel' to quality company's sustainable growth earnings. We are presently in the midst of one of the most disruptive innovation cycles in technological history. Thus, we resist the temptation of concerning ourselves with near term timing based 'market rotations' and changes in 'sentiment'. These distractions will otherwise prevent us from generating outsized returns in the years ahead. PWC consulting estimates that global GDP will be up to 14% higher in 2030 as a result of the accelerating development and take-up of AI. The equivalent of an additional $15.7 trillion USD.
Internet of people v Internet of Things Our lives are already being impacted. In the past 5 years alone, almost all aspects of how we work and how we live - from retail to manufacturing to healthcare - have become increasingly digitised. The internet and mobile technologies drove the first wave of digital, known as the 'Internet of People'. Analysis carried out by PwC's AI specialists anticipate that the data generated from the Internet of Things (IoT) will outstrip the data generated by the Internet of People many times over. This is already resulting in standardisation, which naturally leads to task automation and the automatic personalisation of products and services - setting off the next wave of digital progress. AI exploits digitised data from people and things to automate and assist in what we do today, how we make decisions and how we find new ways of doing things that we've not imagined before.
From one of the all-time ice hockey greats this very apt thought describes the way Insync frames its investment thinking. Despite the market's sentiment shift on the rotation trade, Insync's focus is on where the world is moving to. Data continues to show an acceleration in spending on pets, the rollout of 5G, health & wellness, and digital transformation Major corporates expect elevated growth in technology to both accelerate and persist for the foreseeable future (according to a Morgan Stanley survey), in areas such as cloud computing, digital transformation and artificial intelligence. CIO intentions indicate that they expect to increase IT spend as a percentage of revenue over the next three years than they did pre-pandemic. The percentage of CIOs planning to increase spend versus those planning to decrease spend is known as the up-to-down ratio. It rose to 9.0, nearly 6x the pre-pandemic 2019 average. The best way to invest in a megatrend isn't always the obvious way!
Semiconductors are driving the digital transformation of the world. Covid19 has had a profound impact on so many industries but one of the key areas everyone has started to care about are silicon chips. This became abundantly clear when new car purchases were dramatically delayed because of chip supply chain shortages. Semiconductor chip usefulness has gone further than any other technology in connecting the world. The companies that produce them enables us to do pretty much everything, from the smartphones in our pockets to the vast datacentres powering the internet, from electric scooters and cars to hypersonic aircraft, and pacemakers to weather-predicting supercomputers. Their manufacturing requires a high level of specialist technological know-how as it is a highly expensive, complex and a long process. It typically takes 3 months and 700 different steps to cover a silicon wafer with intricate etchings forming billions of transistors (microscopic switches that control electric currents and allow the chip to perform tasks).
Semiconductor chips lay at the heart of the exponential transition that we're going to experience in computing over the next 5-15 years. More than we have ever witnessed before, and it will continue to grow exponentially. For example, AI applications process vast volumes of data-about 80 Exabytes pa today. This is projected to increase to 845 Exabytes by 2025. One Exabyte = One quintillion bytes = one thousand quadrillion bytes. Truly eye-watering numbers. Insync's investments in the most profitable semiconductor companies enable investors to participate in 3 of the 16 enduring megatrends: video gaming, workplace automation and enterprise digitisation. Their earnings growth will continue to compound at high rates with the resulting share price growth following. This is a consistent feature of the 29 companies in the portfolio. Patience will reward. Funds operated by this manager: Insync Global Capital Aware Fund, Insync Global Quality Equity Fund Disclaimer |

20 Jun 2022 - Performance Report: Bennelong Twenty20 Australian Equities Fund
| Report Date | |
| Manager | |
| Fund Name | |
| Strategy | |
| Latest Return Date | |
| Latest Return | |
| Latest 6 Months | |
| Latest 12 Months | |
| Latest 24 Months (pa) | |
| Annualised Since Inception | |
| Inception Date | |
| FUM (millions) | |
| Fund Overview | |
| Manager Comments | The Bennelong Twenty20 Australian Equities Fund has a track record of 12 years and 7 months and has outperformed the ASX 200 Total Return Index since inception in November 2009, providing investors with an annualised return of 9.96% compared with the index's return of 8.02% over the same period. On a calendar year basis, the fund has experienced a negative annual return on 2 occasions in the 12 years and 7 months since its inception. Over the past 12 months, the fund's largest drawdown was -15.06% vs the index's -6.35%, and since inception in November 2009 the fund's largest drawdown was -26.09% vs the index's maximum drawdown over the same period of -26.75%. The fund's maximum drawdown began in February 2020 and lasted 9 months, reaching its lowest point during March 2020. The fund had completely recovered its losses by November 2020. The Manager has delivered these returns with 0.63% more volatility than the index, contributing to a Sharpe ratio which has fallen below 1 four times over the past five years and which currently sits at 0.61 since inception. The fund has provided positive monthly returns 95% of the time in rising markets and 7% of the time during periods of market decline, contributing to an up-capture ratio since inception of 117% and a down-capture ratio of 98%. |
| More Information |

20 Jun 2022 - Winning by not losing
|
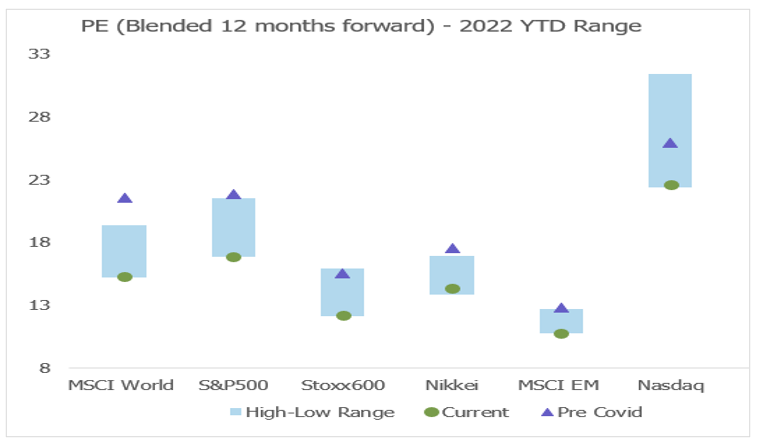
Winning by not losing Alphinity Investment Management May 2022 Investing in global equity markets has felt like playing a game of dodgeball over the last two years. Around every corner investors have been faced with a new surprise to navigate. Just as in dodgeball, where players run for cover to avoid the sting of those dreaded balls, equity investors have flocked to the safety of defensive stocks in 2022. Year to date defensives have outperformed value, growth and cyclical stocks, doing what they are supposed to do in uncertain times: offer equity investors a shield against the onslaught of valuation pressures, slowing earnings growth and increased uncertainty. As we continue to brace ourselves for ongoing volatility in equity markets, we prefer to maintain exposure to selective stocks with defensive characteristics - those that are winning by not losing. Deutsche Boerse and Merck & Co are two such examples. The big de-rating might not be overGlobal equity markets have de-rated since the recent peak in September 2020, with a sharper deceleration in 2022 driven by rising inflation fears as reflected in higher 10-year bond yields. In fact, most major market indices are now trading below their pre-Covid valuation levels. The derating has been particularly evident in the more expensive parts of the market, such as Technology stocks. For example, the Nasdaq Composite Index has fallen by -25% so far this year, with most of this occurring through forward PE multiples contracting from ~32 to ~23x currently. In comparison, the S&P 500 has fallen 16% and contracted from ~22x to ~17x over the same time frame. All major equity markets have derated sharply YTD to below pre-Covid levels
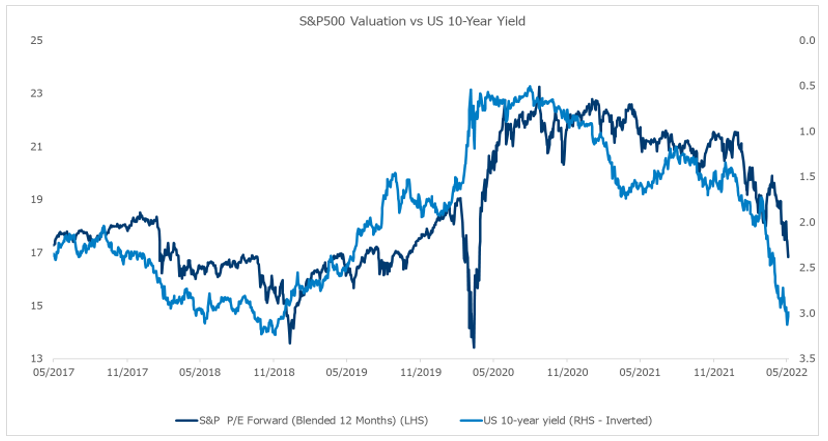
Source: Bloomberg, 10 May 2022 Despite this overall market de-rating, most major indices are still trading in line or above their 20-year averages and remain relatively high when considering the sharp rise in 10-year yields (see chart below). The Russia Ukraine War has also recently pushed commodity prices to new highs, raising inflation risks and potentially placing further pressure on market valuations. Valuations may be at more risk as bond yields continue to surge
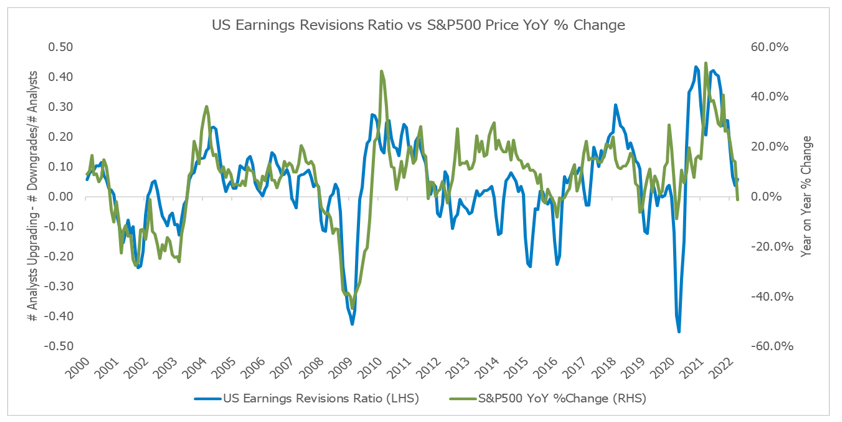
Source: Bloomberg, 10 May 2022 Investors' fears are shifting from inflation to growthUS GDP has surged past prior cycle peaks but is now decelerating sharply. Similarly, while 1Q22 earnings were modestly ahead of expectations on average, management commentary and guidance about the outlook has been increasingly cautious, prompting analysts to downgrade earnings forecasts for both '22 and '23. In fact, earnings revisions breath has been declining since August 2021 and has recently moved outright negative. Given the wide range of headwinds companies currently face, which include cost pressures, supply chain constraints, inventory build ups and potentially weaker demand from higher prices and lower global growth, it's likely that earnings revisions will remain negative for the foreseeable future. This has historically been associated with weak overall market performance (see below). Earnings Revisions and Price are highly correlated
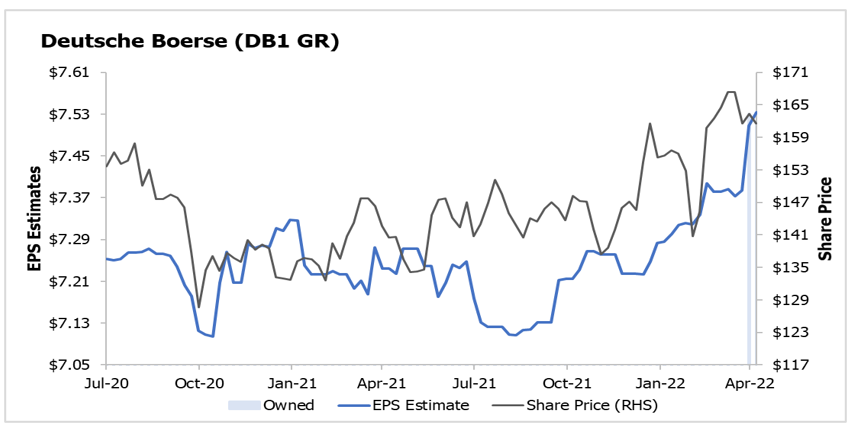
Source: Alphinity, Bloomberg, 3 May 2022 Earnings leadership has taken another step to being more defensiveAt a sector level, we have however seen a sharp contrast with the classic defensive sectors, such as Utilities and Consumer Staples outperforming the overall market year to date, driven by a superior ratings performance as well as better earnings revisions versus their cyclical peers and the broader market (excluding the Energy and Materials). Defensives have a strong track record of outperforming during slowing growth/recessionary periods, a relative safe-haven within periods of market stress. With a broad range of defensives already reflecting these benefits in relatively high valuations, active investors need to remain nimble and look for new opportunities. Some of these might not be seen as typical defensive plays, such as Merck & Co referred to below, but they offer defensive characteristics that should bode well in a volatile environment. One such defensive earnings leader is Deutsche Boerse. Just as in a dodgeball game, there are certain times in the market cycle when it is not always about running the fastest, but also about finding the best places to hide. Deutsche Boerse- Leading stock exchange enjoying multiple cyclical & structural tailwindsDeutsche Boerse (DB1) is a high-quality owner of various key pieces of financial market infrastructure in Europe across pre-trading, trading & clearing and post-trading. These assets include Institutional Shareholder Services (ISS), Eurex (leading European financial derivative exchange), EEX (a commodities trading & clearing exchange), Xetra (cash equities) and Clearstream (a leading European settlement & custody provider). These businesses all tend to command dominant or leading market positions within their segments, and as such enjoy significant barriers to entry and high margins. These diversified businesses generate resilient mid-cycle digit % secular growth, which we expect to be further boosted by various cyclical tailwinds, including both higher interest rates and higher interest rate volatility, as well as further targeted M&A. Consequently, we expect the company to exceed management's net income growth target of 10% (CAGR) for FY19-23E. With positive earnings revisions and a relatively undemanding valuation multiple (current forward PE of ~21x), we continue to see more upside for DB1 in the current environment. Deutsche Boerse - More defensive Earnings supported by several cyclical and structural factors
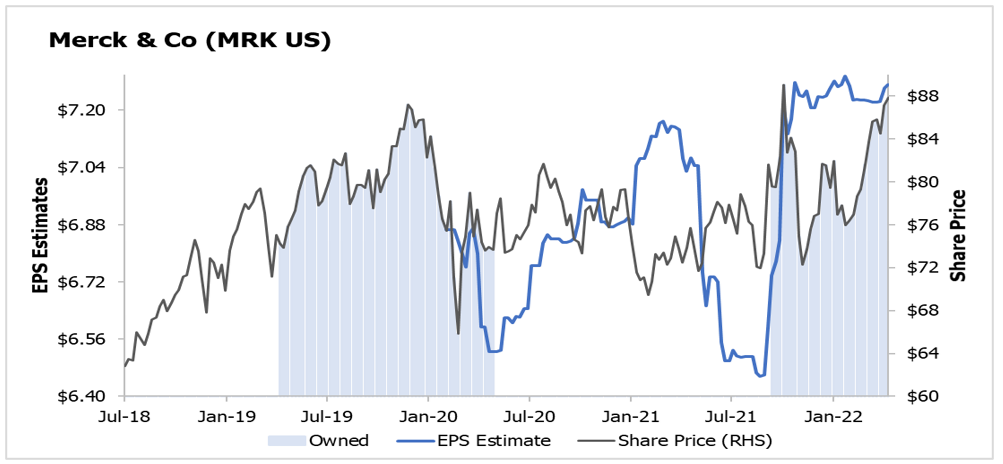
Source: Bloomberg, 10 May 2022 Merck & Co- A high quality defensive with flagship growth products & consistent earningsMerck & Co (MRK) is a global pharmaceutical company that delivers health solutions through its prescription medicines, vaccines, biologic therapies, animal health and consumer care products. MRK recently reported an impressive 1Q22 result with both revenue and earnings beating consensus expectations and the company raising 2022 guidance for both despite an expected FX headwind, driven by strength across the portfolio. Despite the relative outperformance and re-rating from 10x to 12x YTD, we maintain our position in this flagship defensive at this juncture with two main drivers for our investment case: 1) Product growth of the existing portfolio: Both the flagship growth products Keytruda (the largest selling drug in the world, innovative immuno-oncology, 30% of group revenues) and Gardasil vaccine (blockbuster vaccine against papilloma virus/cervical cancer, ~9% of group revenues) continue to grow ahead of expectations with their high quality Animal Health business (the third largest in the world) enjoying above market growth rates. 2) Business development: Management continue to look for new M&A opportunities to expand the business, underpinned by a strong balance sheet, with gearing at only ~2x EBITDA. Earnings growth underpinned by a portfolio of strong flagship products
Source: Bloomberg, 10 May 2022 Author: Elfreda Jonker, Client Portfolio Manager This information is for adviser & wholesale investors only |
|
Funds operated by this manager: Alphinity Australian Share Fund, Alphinity Concentrated Australian Share Fund, Alphinity Global Equity Fund, Alphinity Sustainable Share Fund |

17 Jun 2022 - Hedge Clippings |17 June 2022
|
|
|
|
Hedge Clippings | Friday, 17 June 2022 Central Banks are caught between a rock and a hard place, namely inflation and a recession. Of course with the benefit of hindsight, history shows putting off the inevitable doesn't work, and that hope is not a viable strategy. RBA Governor Philip Lowe is now saying inflation is likely to be around 7% by the end of the year, and it is reasonable for the cash rate to hit 2.5%. Given a further 0.75% rise in the US - the largest for almost 30 years - another 50 bps from the RBA in July is not out of the question, with another 50 bps prior to Christmas. The issue for Lowe is that many, if not all, of the drivers of inflation are outside his control, with only higher interest rates at his disposal to rein in the problem. The combination of higher prices for fuel and everyday food, combined with increased mortgage costs, and the threat of energy shortages and increased costs, will only add further to inflation, and risk impacting consumer confidence, demand - and spending. Which of course is the objective, but it's a fine balance. Whilst central banks pumped free money into the system via QE, and lowered interest rates, investors happily responded by inflating markets, particularly tech and growth stocks, with the usual cry of "this time it will be different". Realistically it rarely is, and investors are now faced with the fact that markets often fall faster than they rise. Comments from fund managers that Hedge Clippings speaks to follow a common thread: Buy quality stocks at a reasonable or discounted price, and understand that markets will be volatile, and overshoot both on the upside and downside. To that we would add diversify, both across funds, strategy and asset class. News & Insights Is this a buying opportunity? | Equitable Investors Why country risk matters | 4D Infrastructure Why it's all about Earnings Growth | Insync Fund Managers |
|
|
May 2022 Performance News Bennelong Emerging Companies Fund Quay Global Real Estate Fund (Unhedged) Insync Global Capital Aware Fund |
|
|
If you'd like to receive Hedge Clippings direct to your inbox each Friday
|


