NEWS

27 Jun 2022 - Managers Insights | Collins St Asset Management
|
|
||
|
Damen Purcell, COO of Australian Fund Monitors, speaks with Rob Hay, Head of Distribution & Investor Relations at Collins St Asset Management. The Collins St Value Fund has a track record of 6 years and 4 months and has outperformed the ASX 200 Total Return Index since inception in February 2016, providing investors with an annualised return of 17.87% compared with the index's return of 10.3% over the same period.
|

27 Jun 2022 - New Funds on Fundmonitors.com
|
New Funds on FundMonitors.com |
|
Below are some of the funds we've recently added to our database. Follow the links to view each fund's profile, where you'll have access to their offer documents, monthly reports, historical returns, performance analytics, rankings, research, platform availability, and news & insights. |
|
|
|||||||||||||||||
| DigitalX Fund | |||||||||||||||||
|
|||||||||||||||||
|
DigitalX Bitcoin Fund |
|||||||||||||||||
|
|||||||||||||||||
|
Balmoral Digital Assets Fund |
|||||||||||||||||
|
|||||||||||||||||
|
|
|||||||||||||||||
| PURE Resources Fund | |||||||||||||||||
|
|||||||||||||||||
| View Profile | |||||||||||||||||
|
Want to see more funds? |
|||||||||||||||||
|
Subscribe for full access to these funds and over 650 others |

27 Jun 2022 - 10k Words
|
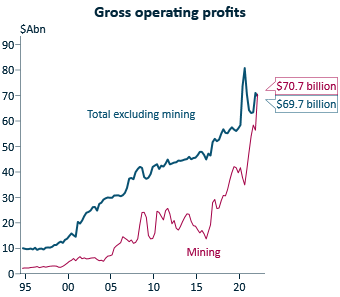
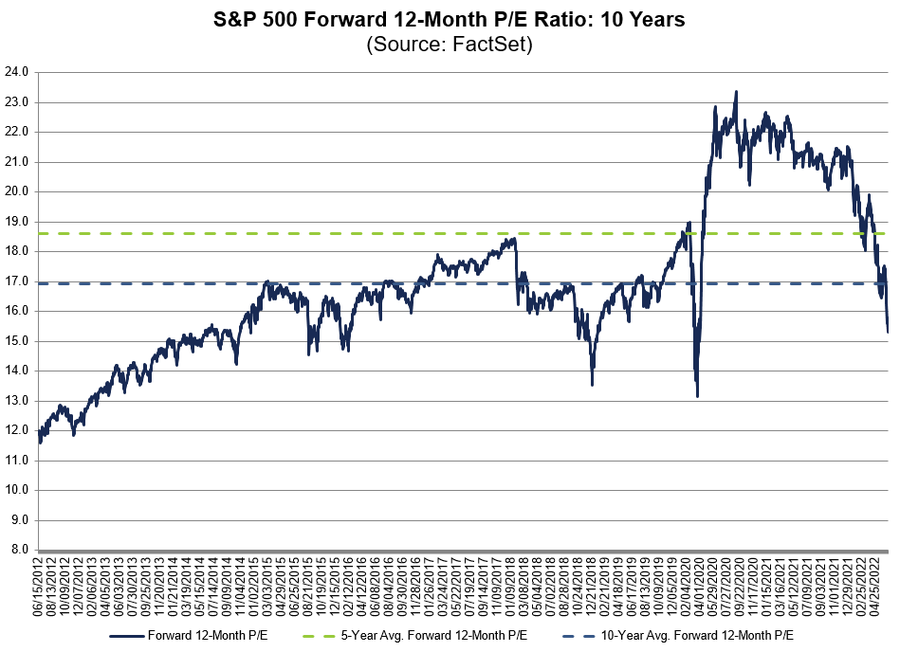
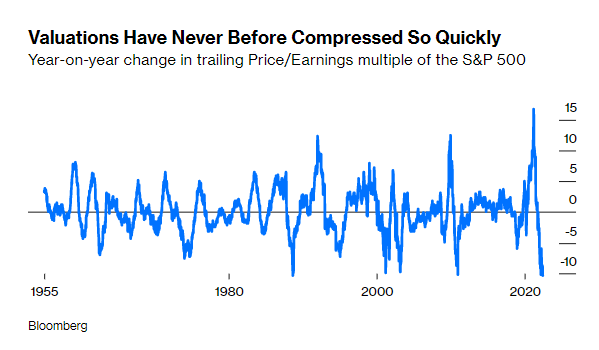
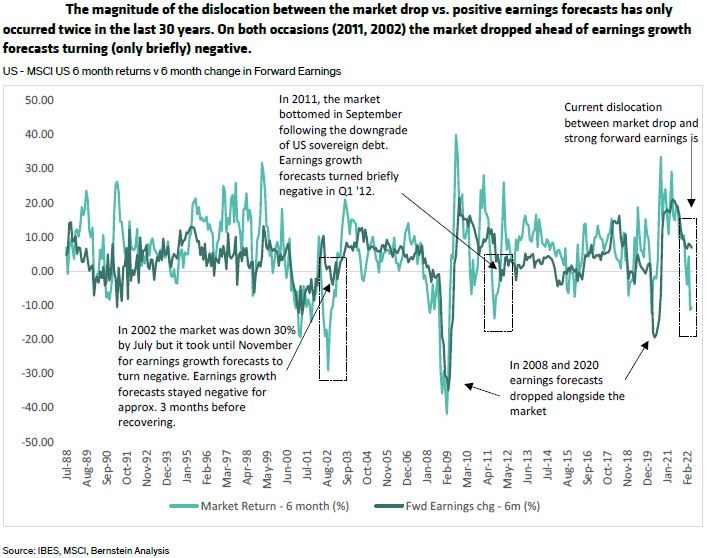
10k Words Equitable Investors June 2022 Price-to-Earnings multiples have been crunched in the calendar year to-date, as FactSet and strategist Christophe Barraud chart - but that begs the question posed by Sanford Bernstein - does this imply earnings expectations will be cut? Global equity capital markets volumes have dropped more than market indices, Equitable Investors highlights, while there are plenty of companies in need of fresh cash. Below-trend economic growth and above-trend inflation is the widely held consensus view of the economic backdrop from the Bank of America global fund manager survey. Off the back of that, the market is expecting the Fed cash rate to settle at ~3%, Wilsons calculates. Back in Australia, ANZ-Roy Morgan Consumer Confidence is strikingly low amid all the talk of inflation and interest rates - search terms that have surged on Google Trends. IFM highlights that Australian mining profits have for the first time exceeded profits in all other non-finance sectors combined.
S&P 500 Forward PE over 10 years Source: FactSet
S&P 500 trailing PE since 1955 Source: Bloomberg, @C_Barraud
Are earnings forecasts about to be downgraded?
Global Equity Capital Markets ($US)
No, ASX-listed cash burners with 12m or less cash at last reported burn-rate
Source: Equitable Investors
"Stagflation" is the most popular economic backdrop expectation
Source: BofA Global Fund Manager Survey (June 2022)
Expected path of Federal Reserve cash rate Source: Refinitiv, Wilsons
ANZ-Roy Morgan Consumer Confidence
Australian web searches for "inflation" (blue line) and "interest rates" (red line) Source: Google Trends, Equitable Investors
Australian Gross Operating Profits Source: ABS, IFM June Edition Funds operated by this manager: Equitable Investors Dragonfly Fund Disclaimer Nothing in this blog constitutes investment advice - or advice in any other field. Neither the information, commentary or any opinion contained in this blog constitutes a solicitation or offer by Equitable Investors Pty Ltd (Equitable Investors) or its affiliates to buy or sell any securities or other financial instruments. Nor shall any such security be offered or sold to any person in any jurisdiction in which such offer, solicitation, purchase, or sale would be unlawful under the securities laws of such jurisdiction. The content of this blog should not be relied upon in making investment decisions.Any decisions based on information contained on this blog are the sole responsibility of the visitor. In exchange for using this blog, the visitor agree to indemnify Equitable Investors and hold Equitable Investors, its officers, directors, employees, affiliates, agents, licensors and suppliers harmless against any and all claims, losses, liability, costs and expenses (including but not limited to legal fees) arising from your use of this blog, from your violation of these Terms or from any decisions that the visitor makes based on such information. This blog is for information purposes only and is not intended to be relied upon as a forecast, research or investment advice. The information on this blog does not constitute a recommendation, offer or solicitation to buy or sell any securities or to adopt any investment strategy. Although this material is based upon information that Equitable Investors considers reliable and endeavours to keep current, Equitable Investors does not assure that this material is accurate, current or complete, and it should not be relied upon as such. Any opinions expressed on this blog may change as subsequent conditions vary. Equitable Investors does not warrant, either expressly or implied, the accuracy or completeness of the information, text, graphics, links or other items contained on this blog and does not warrant that the functions contained in this blog will be uninterrupted or error-free, that defects will be corrected, or that the blog will be free of viruses or other harmful components.Equitable Investors expressly disclaims all liability for errors and omissions in the materials on this blog and for the use or interpretation by others of information contained on the blog |

27 Jun 2022 - Consolidation and rising tail risks

24 Jun 2022 - Hedge Clippings |24 June 2022
|
|
|
|
Hedge Clippings | Friday, 24 June 2022 Last week's Hedge Clippings noted that central bankers were caught between a rock and a hard place, trying to manage inflation by tightening monetary policy, and at the same time managing a balancing act trying to prevent their economies falling into a recession. This week Australia's media only seemed to have a single topic (leaving aside Lisa Wilkinson's Logies stupidity) - namely inflation and wages. (No doubt the pedants will correctly note that's two topics, but they sort of go hand in hand.) The trouble with trying to curb inflation is that it's like trying to put a smell back in the bottle - once it's out, it's out. (Only genies and little ships go back in the bottle.) There was a chance, ever so slight, that whilst inflation was "transient" or external, it might have been possible to argue it was temporary. However, once the central banks started to lift rates, it was out. The combination of higher mortgage repayments and inflation leads to wage pressure, with the inevitable risk of an interest rate/wage/price spiral, and so it goes on. And on. Meanwhile Putin put a spike in the spokes, energy markets went into a spin, lettuces got into the act, and the price side of the spiral was confirmed. The Prime Minister had no option but to follow through on his election promise to push for the minimum wage to rise by the then inflation rate, and the Fair Work Commission obliged by lifting it by 5.2% for 184,000 lowest paid workers, and by 4.6% for another 2.6 million workers on higher awards. RBA governor Dr. Philip Lowe said he expected inflation to peak at 7% by the end of the year, and then "moderate", and while he doesn't believe official interest rates will reach 4%, he does admit his forecasting record in that regard hasn't been spectacular, to say the least. As far as forecasting a recession, he did at least cover himself by saying while he "doesn't see one on the horizon ... you can't rule anything out." To make his job easier, Dr. Lowe wants wages growth to be kept at 3.5%, while the ACTU's Sally McManus, not surprisingly wants her members to push for wage rises in line with inflation, which based on the RBA's forecast, means 7%, and predictably saying company profits are the cause of inflation. US Federal Reserve Chair Jerome Powell was even blunter than Philip Lowe - or maybe more realistic depending on one's view, acknowledging that a recession in the US was certainly a possibility. At the same time he reiterated that two key factors driving inflation - namely, energy prices and supply chain constraints - were out of his control, and that if he had to raise rates by 1% to curb inflation at the next or future meetings, he would. Against this backdrop it is no wonder that markets have rotated from last year's risk on, to this year's risk off, with the basis for equity valuations and multiples finally switching from forecast revenue, (or even consumer or subscriber numbers) to earnings, and then to recurring earnings in particular. In the upcoming reporting season there will no doubt be further revisions to equity prices as investors' and analysts' focus switches to recurring profit, or ROE. As the P side of the P/E ratio falls, so value - and buyers - will no doubt return. News & Insights New Funds on FundMonitors.com Manager Insights | Collins St Asset Management Megatrends drive sustainable growth | Insync Fund Managers Record high inflation could trigger a fresh eurozone financial crisis | Magellan Asset Management |
|
|
May 2022 Performance News Bennelong Concentrated Australian Equities Fund Paragon Australian Long Short Fund Digital Asset Fund (Digital Opportunities Class) Glenmore Australian Equities Fund Insync Global Quality Equity Fund |
|
|
If you'd like to receive Hedge Clippings direct to your inbox each Friday
|

24 Jun 2022 - Performance Report: Laureola Australia Feeder Fund
| Report Date | |
| Manager | |
| Fund Name | |
| Strategy | |
| Latest Return Date | |
| Latest Return | |
| Latest 6 Months | |
| Latest 12 Months | |
| Latest 24 Months (pa) | |
| Annualised Since Inception | |
| Inception Date | |
| FUM (millions) | |
| Fund Overview | Life Settlements are resold life insurance policies and can be thought of as a form of finance extended to an individual backed by the person's life insurance policy. This financing is repaid upon maturity by collecting the death benefit from the insurance company. Risk mitigation measures implemented by Laureola include science-driven due diligence of policies, active monitoring of insured through a vertically integrated operation, and investor aligned fund design. |
| Manager Comments | The Laureola Master Fund has a track record of 9 years and 1 month and has outperformed the Bloomberg AusBond Composite 0+ Yr Index since inception in May 2013, providing investors with an annualised return of 14.15% compared with the index's return of 2.58% over the same period. On a calendar year basis, the fund hasn't experienced any negative annual returns in the 9 years and 1 month since its inception. Over the past 12 months, the fund's largest drawdown was -2.39% vs the index's -10.81%, and since inception in May 2013 the fund's largest drawdown was -4.9% vs the index's maximum drawdown over the same period of -11.09%. The fund's maximum drawdown began in December 2018 and lasted 10 months, reaching its lowest point during December 2018. The fund had completely recovered its losses by October 2019. During this period, the index's maximum drawdown was -0.98%. The Manager has delivered these returns with 1.83% more volatility than the index, contributing to a Sharpe ratio which has only fallen below 1 once over the past five years and which currently sits at 2.25 since inception. The fund has provided positive monthly returns 97% of the time in rising markets and 89% of the time during periods of market decline, contributing to an up-capture ratio since inception of 160% and a down-capture ratio of -189%. |
| More Information |

24 Jun 2022 - Fund Review: Bennelong Kardinia Absolute Return Fund May 2022
BENNELONG KARDINIA ABSOLUTE RETURN FUND
Attached is our most recently updated Fund Review. You are also able to view the Fund's Profile.
- The Fund is long biased, research driven, active equity long/short strategy investing in listed ASX companies.
- The Fund has significantly outperformed the ASX200 Accumulation Index since its inception in May 2006 and also has significantly lower risk KPIs. The Fund has an annualised return of 7.69% p.a. with a volatility of 7.72%, compared to the ASX200 Accumulation's return of 6.42% p.a. with a volatility of 14.13%.
- The Fund also has a strong focus on capital protection in negative markets. Portfolio Managers Kristiaan Rehder and Stuart Larke have significant market experience, while Bennelong Funds Management provide infrastructure, operational, compliance and distribution capabilities.
For further details on the Fund, please do not hesitate to contact us.

24 Jun 2022 - RBA ignores weaker real economy and hikes
|
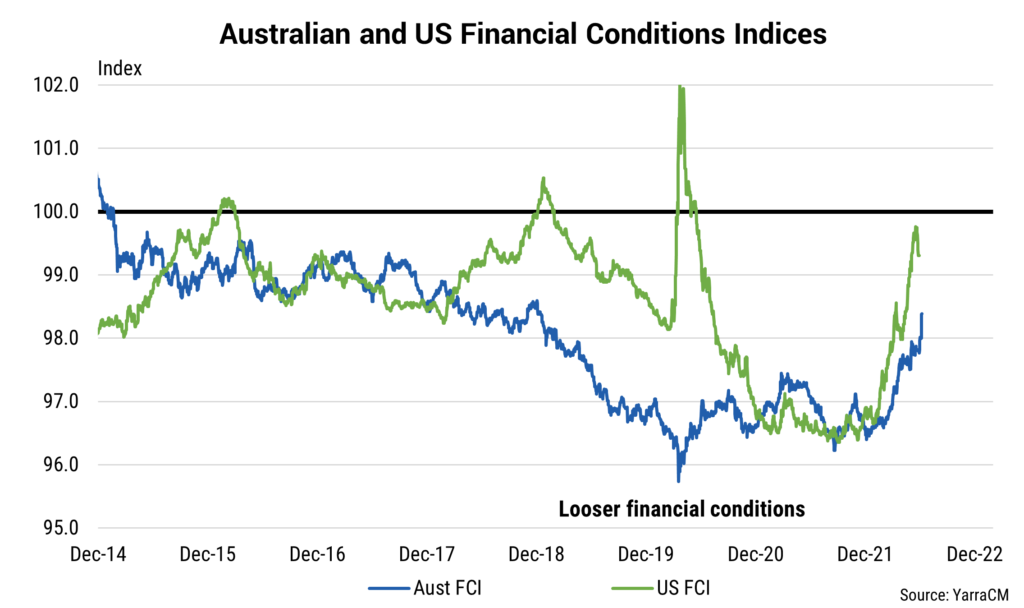
RBA ignores weaker real economy and hikes Yarra Capital Management 08 June 2022 A 50 basis point hike by the Reserve Bank of Australia (RBA) was clearly a surprise for financial markets. The RBA's rationale for increasing interest rates was that inflation is higher than expected. This is despite the fact that the CPI data was printed ahead of the May decision (i.e. the inflation surprise is not "new" news) and despite the RBA's acknowledgement that the prime reason for high inflation is due to supply shortages rather than excess demand. The RBA nevertheless decided to go against its own guidance that 25bps hikes could be expected going forward as part of their self-selected 'business as usual' strategy, instead delivering a 50bp hike. Indeed, the economic data since the May decision can be best described as limited and the tone of the data clearly missed to the downside, rather than exceeded expectations. Business confidence eased, consumer confidence was sharply lower, the wage price index missed expectations to the downside, employment was 25k weaker than expected, building approvals was 4.4% weaker than expected and home loans written were 6% below expectations. Only the GDP data slightly beat expectations (0.8%qoq v 0.7% expected). The only other data that the RBA likely could have looked at was the monthly Inflation Gauge data that did come in relatively strong at the start of the week. Again, however, the reason for the strength was supply side issues in petrol, energy, food and rent. It is also relevant to note that the accuracy of this survey can be questionable. The RBA's inability to read the (financial market) room was again on full display. While only slightly more surveyed economists expected 25bps than a larger move, only 3 of the 29 surveyed expected a 50bp hike. The ASX200 fell 0.6% and 3-year bond yields spiked 12bps as a consequence of yet again opaque and arguably misleading communication. Arguably, this is clearly an attempt of catch-up by a central bank that has been caught out by failing to detect the inflation threat early enough and now, in an effort to make greater inroads into the negative real cash rate settings, has chosen to surprise financial markets. There is likely an element of using the cover of larger hikes from the US, BoC and RBNZ to hike by a greater increment in June. However, in choosing this action the RBA has opened the door to implementing further 50bp hikes in coming months. It is indeed possible that inflation prints high in Q2, and the RBA mechanically follows with a 50bp hike in August. For households and firms this inconsistency in terms of communication, data flow and action likely adds a layer of confusion into financial markets at a time when forward looking and consistent guidance is needed. The RBA has indicated that it sees further hikes necessary stating it "expect[s] to take further steps in the process of normalising monetary conditions in Australia over the months ahead". However, if "the size and timing of future interest rate increases will be guided by the incoming data and the Board's assessment of the outlook for inflation and the labour market" then it would be useful if they were consistent in that interpretation of that data and their decision on the cash rate. From our perspective it was a coin toss between a 25bp or 40bp hike. However, rates markets are now left with little choice but to embed hikes in excess of 25bps per meeting for the next few months while the RBA moves to set local rates sharply higher in an effort to contain global supply led inflation pressures. In the rush to catch up to other central banks, however, we need to be conscious that the monetary transmission mechanism works very differently in Australia. The tightening in financial conditions in the US has been a function of all key forces moving in the same direction (wider corporate bond spreads, higher bond yields, higher USD, weaker US equities and Fed hikes). In Australia, however, movements in the RBA cash rate and the A$ have much greater impacts. Australia's financial conditions have now tightened materially post the RBA's decision (refer chart). Should the RBA hike rates by a further 100bps over the coming months, Australia's financial conditions will likely move closer to the current level in the US. However, given Australia is currently already a high carry currency, the risk is now firmly skewed to a materially higher A$ in coming months. The impact of this would likely be to further tighten Australian financial conditions and act as a material headwind for the interest rate sectors of housing and consumer discretionary. |
|
Funds operated by this manager: Yarra Australian Equities Fund, Yarra Emerging Leaders Fund, Yarra Enhanced Income Fund, Yarra Income Plus Fund |

23 Jun 2022 - Fund Review: Bennelong Twenty20 Australian Equities Fund May 2022
BENNELONG TWENTY20 AUSTRALIAN EQUITIES FUND
Attached is our most recently updated Fund Review on the Bennelong Twenty20 Australian Equities Fund.
- The Bennelong Twenty20 Australian Equities Fund invests in ASX listed stocks, combining an indexed position in the Top 20 stocks with an actively managed portfolio of stocks outside the Top 20. Construction of the ex-top 20 portfolio is fundamental, bottom-up, core investment style, biased to quality stocks, with a structured risk management approach.
- Mark East, the Fund's Chief Investment Officer, and Keith Kwang, Director of Quantitative Research have over 50 years combined market experience. Bennelong Funds Management (BFM) provides the investment manager, Bennelong Australian Equity Partners (BAEP) with infrastructure, operational, compliance and distribution services.
For further details on the Fund, please do not hesitate to contact us.

23 Jun 2022 - Performance Report: Insync Global Quality Equity Fund
| Report Date | |
| Manager | |
| Fund Name | |
| Strategy | |
| Latest Return Date | |
| Latest Return | |
| Latest 6 Months | |
| Latest 12 Months | |
| Latest 24 Months (pa) | |
| Annualised Since Inception | |
| Inception Date | |
| FUM (millions) | |
| Fund Overview | Insync invests in a concentrated portfolio of high quality companies that possess long 'runways' of future growth benefitting from Megatrends. Megatrends are multiyear structural and disruptive changes that transform the way we live our daily lives and result from a convergence of different underlying trends including innovation, politics, demographics, social attitudes and lifestyles. They provide important tailwinds to individual stocks and sectors, that reside within them. Insync believe this delivers exponential earnings growth ahead of market expectations. Insync screens the universe of 40,000 listed global companies to just 150 that it views as superior. This includes profitability, balance sheet performance, shareholder focus and valuations. 20-40 companies are then chosen for the portfolio. These reflect the best outcomes from further analysis using a proprietary DCF valuation, implied growth modelling, and free cash flow yield; alongside management, competitor, and industry scrutiny. The Fund may hold some cash (maximum of 5%), derivatives, currency contracts for hedging purposes, and American and/or Global Depository Receipts. It is however, for all intents and purposes, a 'long-only' fund, remaining fully invested irrespective of market cycles. |
| Manager Comments | The Insync Global Quality Equity Fund has a track record of 12 years and 8 months and has outperformed the Global Equity Index since inception in October 2009, providing investors with an annualised return of 11.84% compared with the index's return of 10.71% over the same period. On a calendar year basis, the fund has only experienced a negative annual return once in the 12 years and 8 months since its inception. Over the past 12 months, the fund's largest drawdown was -24.82% vs the index's -11.86%, and since inception in October 2009 the fund's largest drawdown was -24.82% vs the index's maximum drawdown over the same period of -13.59%. The fund's maximum drawdown began in January 2022 and has lasted 4 months, reaching its lowest point during May 2022. During this period, the index's maximum drawdown was -11.86%. The Manager has delivered these returns with 1.53% more volatility than the index, contributing to a Sharpe ratio which has fallen below 1 five times over the past five years and which currently sits at 0.83 since inception. The fund has provided positive monthly returns 82% of the time in rising markets and 20% of the time during periods of market decline, contributing to an up-capture ratio since inception of 83% and a down-capture ratio of 86%. |
| More Information |


 Source: Sanford Bernstein
