
NEWS

18 Jul 2023 - Global Economic Outlook: Recession, Interrupted
|
Global Economic Outlook: Recession, Interrupted abrdn June 2023 Resilient labour markets, strong service sectors, and sticky underlying inflation mean that central banks are not done raising interest rates. However, the size of these hiking cycles is still likely to cause eventual recessions in many developed markets and some emerging economies. While headline inflation will continue to drop sharply, only these downturns will be able to bring sticky underlying inflation down in a sustainable manner. In turn, we are forecasting central bank cutting cycles during 2024 that will ultimately take interest rates back into accommodative territory. Figure 1: Global forecast summary Source: abrdn, June 2023 Recession, interruptedThe US, and broader global consumer and services sectors, will remain robust for slightly longer than we'd previously anticipated, given households' ongoing willingness to draw down excess savings, the resilience of labour markets, and the boost consumers will soon get from lower headline inflation. Certainly, the weakness in manufacturing and housing activity in the US that started in the fourth quarter last year does not seem to have been the usual early-warning signal of a wider recession. Instead, it has remained largely consigned to those two sectors, and there are even signs that housing activity may be starting to recover. Against this, we expect ongoing stresses in the banking sector amid higher interest rates, although we don't anticipate a systemic financial crisis. Nonetheless, credit conditions will continue tightening - a headwind to growth that will build over time. Stubborn inflationHeadline inflation will continue to drop sharply over the next 12 months driven by energy base effects and lower food inflation, albeit with some volatility and cross-country differences. Indeed, by late-2024, headline inflation rates in many economies will be close to target. Core inflation will also decline from here, as it has already started doing in the US, Eurozone, and many emerging market (EM) economies. However, this will be mostly driven by global-goods disinflation in the first instance. We think core services inflation will remain sticky amid tight labour markets and strong wage growth. Indeed, a recession is ultimately necessary to bring core-services inflation back to target-consistent rates in the US, many other developed markets (DM), and parts of EMs. We think this is a price central banks are willing to pay to deliver on their mandates and maintain the credibility of inflation targets in the future. What now for monetary policy?This means that central banks still have a small amount of additional monetary policy tightening left to implement. We are forecasting a Federal Reserve (Fed) rate hike in July after skipping one in the June meeting. A final rate hike later in the year, as signalled by the Fed's latest forecasts, is possible although not our base case. We think the European Central Bank (ECB) will hike rates once more in July, and the Bank of England (BoE) at least twice more. But the risks around these forecasts are also clearly skewed to the upside. Ongoing inflation persistence could force both central banks to tighten further despite the clear desire of policy makers to draw the hiking cycle to a close for fear of triggering recessions. In Japan, we expect the Bank of Japan (BoJ) to deliver effective monetary policy tightening this northern hemisphere summer via changes to the yield curve control (YCC) framework, allowing the 10-year Japanese Government Bond yield to trade up to 75 basis points. Past tweaks to YCC reflected concerns about market functioning, which have since diminished. Instead, in a striking change to the Japanese macroeconomic environment, we think the BoJ will now be tightening policy directly in response to a pick-up in underlying inflation pressure. Recessions around the cornerWe continue to think this large monetary-tightening cycle will ultimately lead to recessions in the major DM economies and parts of EMs. The manufacturing sector in many economies is already in contraction. However, amid broader data resilience, we now think the timing of economy-wide recessions will be somewhat later than we had previously anticipated - mostly beginning around the turn of the year. There are cross-country differences in the timing of the respective recessions we are forecasting, with the UK downturn beginning as soon as the second quarter (albeit in part due to a technical quirk of the data), the Eurozone expected to be in recession by the fourth quarter this year, and the first negative quarterly gross domestic product (GDP) print in the US in the first quarter of next year. That said, our conviction around the precise timing of the US downturn is less strong than our conviction that this cycle will end with a policy-induced recession over a time horizon that is relevant for investment decision making. The US…We think policy only became contractionary in the US around the middle of last year when the real policy rate started to exceed our estimate of the equilibrium real rate. The 'long and variable' lags of monetary policy mean that the impact of that tightening is only now starting to be felt in earnest, with the effects set to build through the second half of this year. This is the same signal that our recession probability models are providing, with near-term risks having declined as data have been solid, but longer-horizon models remaining elevated due to the deep imbalances in the US economy. It is plausible that the economy could remain even stronger than we expect through the rest of this year, with a tight labour market supporting household spending. However, we think such a 'no landing' scenario is unsustainable as the Fed would be forced to take another 'bite of the cherry' - pushing up rates much further to squeeze out the inflationary excess in the economy. In this scenario, the recession is merely delayed rather than avoided. …and elsewhereIn our base case scenario, we think monetary policy cutting cycles will begin by early 2024 and continue throughout next year as headline inflation drops and growth is negative. We ultimately expect interest rates to fall below neutral and by more than markets have priced. This is consistent with how theory and history suggest central banks behave, with large and rapid easing cycles the norm once an economy has entered a recession and unemployment is increasing. The easy gains of China's re-opening recovery are over. However, we still forecast above-target GDP growth in 2023 given the room for consumption, travel, and services activity to return to pre-pandemic levels. But manufacturing, trade and real estate will continue to struggle, which mean much smaller global economy spill overs than during a typical Chinese recovery. With inflation rates very low, there is scope for modest policy easing. While many EMs were early to the rate-hiking cycle, they will have to wait until 2024 for underlying inflation to cool enough to allow rate cuts to begin. Latin America is best placed to cut given high real rates. Asia Pacific benefits from a less challenging inflationary environment, but lower policy rates there require a 'wait and see' approach. Central and Eastern Europe's lack of central bank credibility amplifies its still substantial inflation problem, implying the region will be the last to cut rates. The most likely alternative scenario is still a soft landing. One way of reading the US labour market data is that a benign loosening - that can reset wage growth and lower inflation expectations without a recession - is already underway. But we still think that historical precedent lends greater weight to a recessionary baseline. ABRDN RESEARCH INSTITUTE |
|
Funds operated by this manager: Aberdeen Standard Actively Hedged International Equities Fund, Aberdeen Standard Asian Opportunities Fund, Aberdeen Standard Australian Small Companies Fund, Aberdeen Standard Emerging Opportunities Fund, Aberdeen Standard Ex-20 Australian Equities Fund (Class A), Aberdeen Standard Focused Sustainable Australian Equity Fund, Aberdeen Standard Fully Hedged International Equities Fund, Aberdeen Standard Global Absolute Return Strategies Fund, Aberdeen Standard Global Corporate Bond Fund, Aberdeen Standard International Equity Fund, Aberdeen Standard Multi Asset Real Return Fund, Aberdeen Standard Multi-Asset Income Fund |

17 Jul 2023 - Performance Report: Argonaut Natural Resources Fund
[Current Manager Report if available]

17 Jul 2023 - Performance Report: Bennelong Australian Equities Fund
[Current Manager Report if available]

17 Jul 2023 - Investing Essentials: Active vs passive
|
Investing Essentials: Active vs passive Bennelong Funds Management June 2023 |
|
Firstly, let's clarify the difference. A passively managed fund is designed to minimise decision-making and keep costs down. The most common types of passively managed funds are index funds, which replicate the movements (and therefore returns) of a particular benchmark index. These funds are set up so their performance will effectively mirror that of the index - meaning the fund won't outperform the index, but won't underperform it either. An actively managed fund aims to outperform a particular index or benchmark over a defined period of time, with a portfolio manager using research and expertise to select individual securities they believe will perform best. There is also, therefore, a risk of underperforming the benchmark. What sometimes gets lost in the argument of 'which is better' is a genuine understanding of the different approaches - and, importantly, how they can both benefit you as an investor at different times. In a constant effort by investors to reduce fees, the popularity of index funds is understandable. But in a world where performance is becoming harder to come by, an actively managed fund - where investment choices are based on analysis, research, and market knowledge and experience - might be a more attractive option. When deciding on an investment approach, there are three important things you should consider. 1. Your objectives If you're looking for a market level return and you're comfortable with the characteristics of a particular asset class and its benchmark (such as the ASX300 for Australian equities), an index fund could suit your requirements. In terms of performance, whatever the market does is what you'll get - there's no flexibility around this. If you want to try and outperform the market, need a particular style of return (such as income), or have a bias towards a particular characteristic or type of stock, then you could consider an actively managed fund. 2. Fees There are no active investment decisions involved in managing an index fund, so a comparatively smaller investment team is required. As a result, index funds usually have a lower management fee than actively managed funds. In an actively managed fund, the investment team will usually conduct assessment and analysis of individual shares as well as the broader economy and other relevant factors. Given the resources involved in this, and the fact that an active manager expects to outperform its benchmark, actively managed funds tend to have a higher cost than index funds. In the drive to reduce fees and get 'value for money', investors can sometimes become hung up on the investment's cost rather than its outcome. Make sure your investment strategy is aligned to your goals, and you understand the difference between price paid and value received. 3. Investment manager Because it only ever matches an index, an index fund will essentially always do what it says on the tin. If the index goes up, performance goes up, and vice versa. But when it comes to choosing an active manager, not all funds are created equal. This is also why it can be hard to compare the performance of active and passive funds: there are wild variances between active managers, styles, investment approaches, risk, etc. Do your research when it comes to a manager's style, process and philosophy. Do you understand how the fund is managed? Are you clear on what it's aiming to achieve? Above all, though, always remember that past performance is not an indicator of future performance - one of the most important rules of investing! There's no doubt that the debate around 'active versus passive' will continue. But, as with all investments, the key for investors is to be clear on what your own purpose or objective is, and then select the funds that best align to achieving your goals. It doesn't have to be either/or - adopting an investment strategy that combines active and passive elements may in fact deliver the best of both worlds |
|
For more insights visit www.bennelongfunds.com Disclaimer The content contained in this article represents the opinions of the author/s. The author/s may hold either long or short positions in securities of various companies discussed in the article. This commentary in no way constitutes a solicitation of business or investment advice. It is intended solely as an avenue for the author/s to express their personal views on investing and for the entertainment of the reader. |

14 Jul 2023 - Hedge Clippings | 14 July 2023
|
|
|
|
Hedge Clippings | 14 July 2023 Have We Reached the Tipping Point of Inflation? As widely predicted by all and sundry, and frequently hinted by Treasurer Jim Chalmers, RBA Governor Philip Lowe's seven year tenure will end in September, to be replaced by current Deputy Governor, Michele Bullock. While there's a change at the top, and about to be widespread changes to the bank's board structure and decision making, the appointment provides continuity of the outgoing Governor's thought processes - assuming there was cohesion and agreement between the two over the past couple of years. We'd expect that to be the case. Both are longstanding RBA employees, Bullock with 38 years under her belt, whilst Lowe has 43. Jim Chalmers noted that the incoming Governor will provide a "fresh perspective", but we doubt it will cause major underlying changes to the overall approach, or the bank's actions when it comes to interest rates. Lowe has taken all the heat from the rate rises that the RBA has announced over the past 15 months, and of course for his earlier comments that rates wouldn't rise from an unprecedented 0.1% until 2024. Those earlier comments have been used by all and sundry, plus Chalmers and Albanese, to point the blame at Lowe for the fact that global inflation has caused rates to rise across the western world. The fact is that Australia's inflation rate is less than the UK's, on a par with the Eurozone, and until this week's surprise number, the US as well. Australia's cash rate at 4.1% is less than both the UK and the US, both at 5.0%. The government has been happy for Lowe to be blamed, having done nothing to help. In fact, they did the opposite by supporting wages rises that are yet to flow through the system. They've done nothing to try to control the inflationary impact of higher energy costs in a country where exports account for 70% of thermal coal production, and 82% of our gas. According to the Australia Institute as of 2020, only 1% of the gas produced in Australia is used in Australian manufacturing, less than 10% of the amount the LNG export industry uses itself. Twice as much gas is used just running gas export terminals as is used by Australian households. Whilst we're proud capitalists, and not fans of government control, one would have thought Canberra (on both sides of politics) might have stepped in somewhere or somehow along the line. For Bullock, the timing couldn't be better, and in our humble opinion she's a good choice. She's perfectly qualified, full of appropriate experience, and after 38 years, understands the bank. She comes in at a time of change, but will presumably maintain the current course. And for Chalmers, it allows the blame for mortgage pain to be laid squarely at the feet of Philip Lowe, just as it looks as if he might have achieved his "narrow path" balancing high inflation, low growth, and close to full employment. Just in time US inflation numbers have peaked, with this week's annual figure at 3%, down from 9.1% a year ago. With the delayed effects of the 13 rate rises to date working their way through the system, we may, or may not, see a (mild) recession by the end of the year. If we avoid one, we'll no doubt hear all about it from Dr. Chalmers, but how much credit he'll give to Philip Lowe is less certain. The CPI numbers due on 26th July will be critical. News & Insights Global Matters: The importance of emerging markets to the infrastructure opportunity | 4D Infrastructure Market Update June | Australian Secure Capital Fund June 2023 Performance News Bennelong Long Short Equity Fund Emit Capital Climate Finance Equity Fund |
|
|
If you'd like to receive Hedge Clippings direct to your inbox each Friday |

14 Jul 2023 - Performance Report: Delft Partners Global High Conviction Strategy
[Current Manager Report if available]

14 Jul 2023 - Performance Report: Airlie Australian Share Fund
[Current Manager Report if available]

14 Jul 2023 - Australian Secure Capital Fund - Market Update June
|
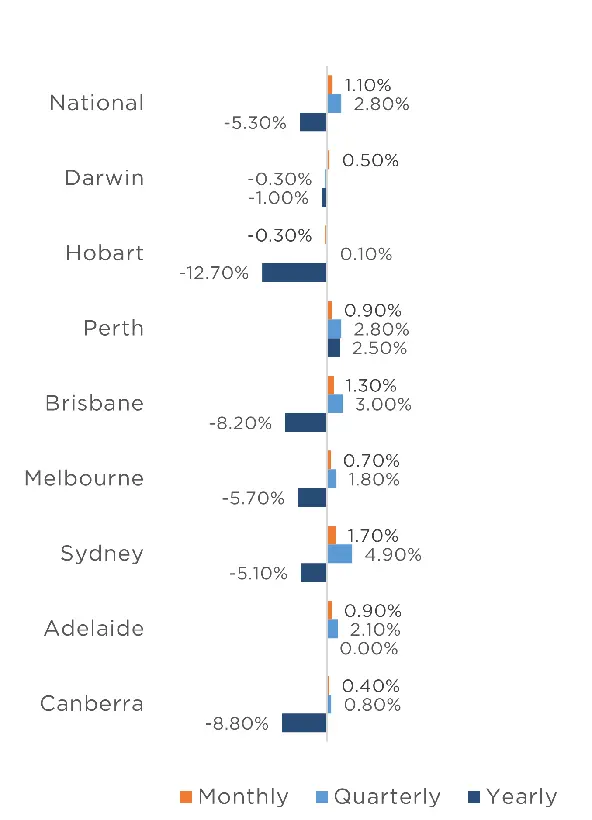
Australian Secure Capital Fund - Market Update June Australian Secure Capital Fund July 2023 The Australian housing market finished the financial year strongly, increasing by 1.1% in June according to CoreLogic's national Home Value index. All capitals except for Hobart (-0.3%) recorded growth for the month, with Sydney the standout with a 1.7% monthly increase. Brisbane was not far behind (1.3%) followed by Adelaide (0.9%), Perth (0.9%), Melbourne (0.7%), Darwin (0.5%) and Canberra (0.4%). The regions also performed strongly with only regional Victoria (-0.4%) and Tasmania (-0.3%) recording a reduction. Regional Queensland and South Australia performed best, with both recording a 1% increase. Regional New South Wales and Western Australia also saw a modest increase of 0.3%. The particularly strong performance over the past two months resulted in very favorable quarterly results, with all markets except for Darwin and regional Victoria experiencing growth. Auction numbers continue to be bellow that of last year, with 1,530 auctions taking place on the first weekend of July, down from 1,881 in the previous year. This further highlights the lack of supply in the housing market, with all capital cities recording fewer auctions than the same weekend of 2022. Sydney recorded the most auctions with 696 taking place with Melbourne not far behind with 517. Brisbane, Adelaide, Canberra and Perth recorded significantly fewer auctions with 132, 111, 68 and 6 respectively. There were no auctions held in Tasmania, however there was also only 1 auction on the same weekend last year. This lack of supply is resulting in higher than usual clearance rates, with the weighted average clearance rate of 70.3% for the weekend, up from 53.2% in the previous year. Once again, clearance rates are higher across all capital cities than last year, with Adelaide performing the strongest at 81.8% (up from 65.4% last year). Sydney (71.2%), Melbourne (70.2%), Brisbane (64.3%) and Canberra (60.5%) all performed strongly and well above previous years results of 49.9%, 55.8%, 45.2% and 52.9% respectively. Clearance Rates & Auctions 26th June - 2nd of July 2023
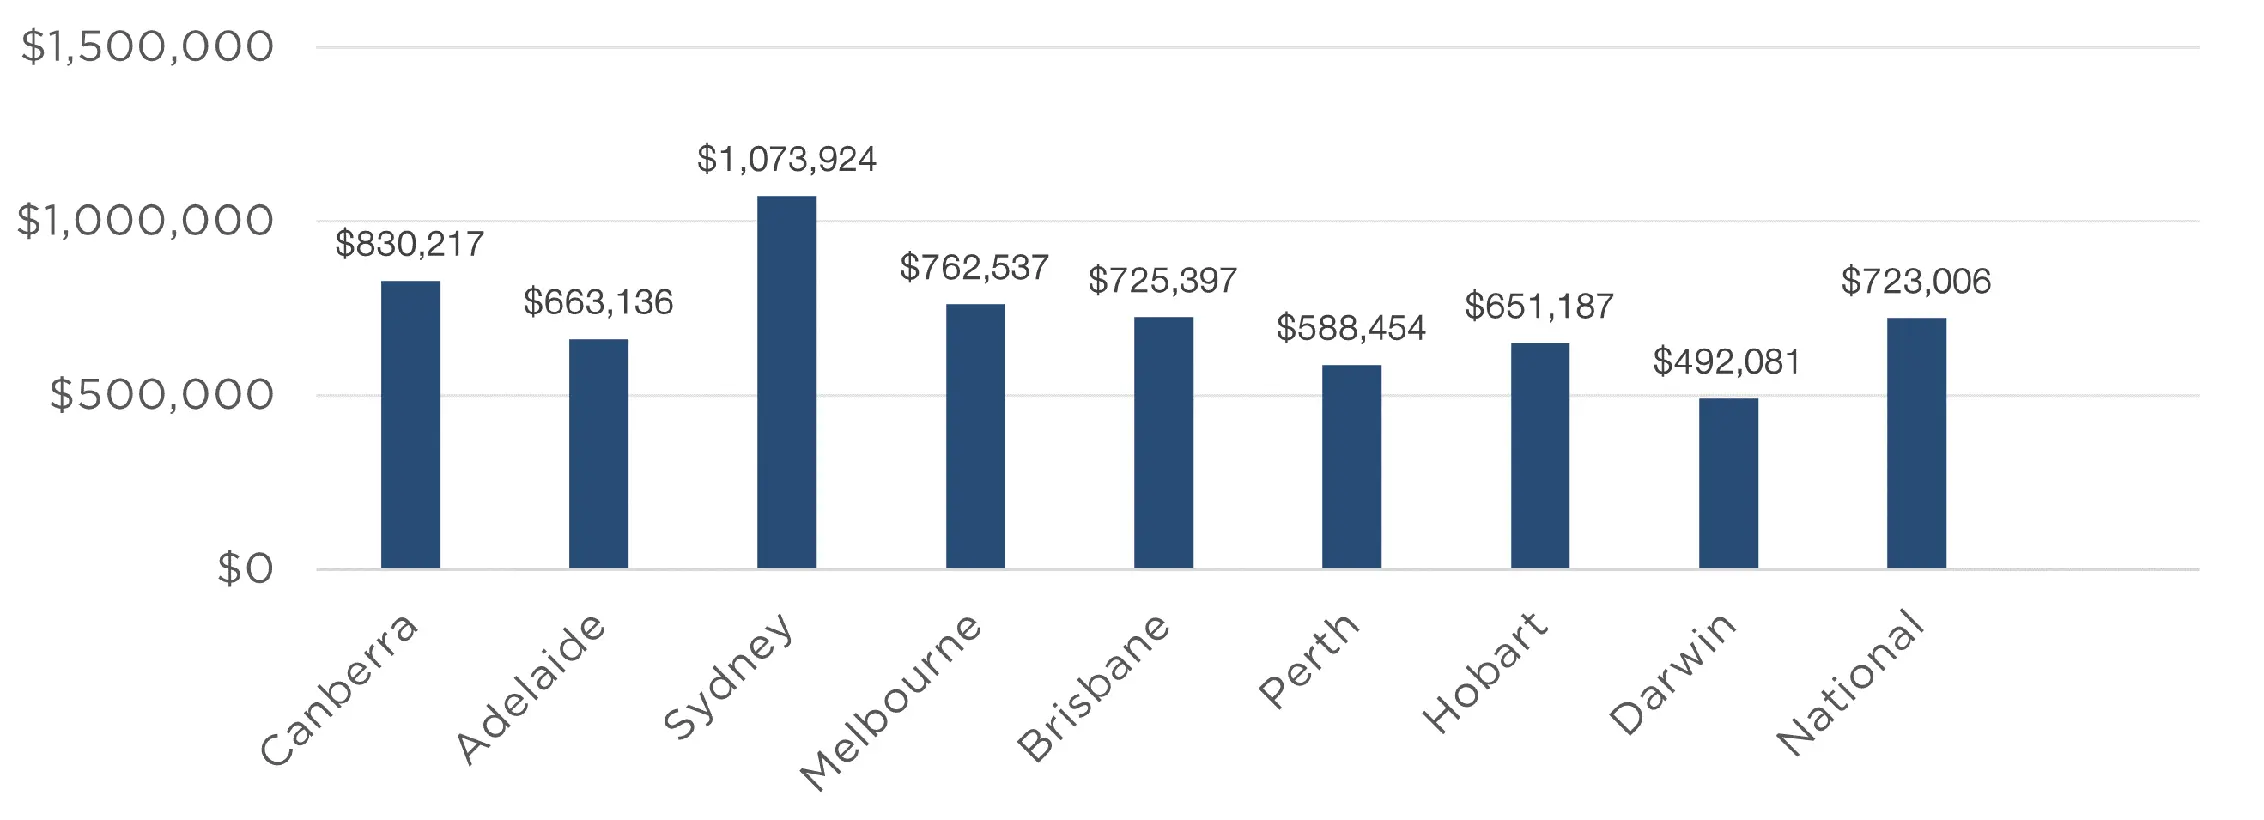
Property Values as at 30th of June 2023
|

13 Jul 2023 - Performance Report: Collins St Value Fund
[Current Manager Report if available]

13 Jul 2023 - Performance Report: DS Capital Growth Fund
[Current Manager Report if available]