
NEWS

9 Oct 2023 - What are Warrants and what is a Bond/Warrant?
|
What are Warrants and what is a Bond/Warrant? PURE Asset Management September 2023 |

| Cost to acquire the warrant/option | -$0.10 |
| Cost to exercise | -$2.50 |
| Proceeds from sale of shares | +$3.00 |
| Profit | +$0.40 |
| Return on investment | 400% |
The appeal is that, compared to simply investing the shares, there is much more leverage to the rising share price. Using the same example above, but instead buying the shares, the investor would have made a 50% return.
| Cost to buy the shares | -$2.00 |
| Proceeds from sale of shares | +$3.00 |
| Profit | +$1.00 |
| Return on investment | 50% |
Therefore, although the investor is taking more risk by buying a warrant or option, because of the limited time frame until expiry, they can achieve the same profit while deploying far less capital. See below, where both scenarios yield a $5,000 profit, but the investor in the warrant/option has had to invest just 12.5% of the capital to achieve the same outcome:
| Warrant/Option | Shares | |
| Capital invested | $1,250 | $10,000 |
| Cost per security | -$0.10 | -$2.00 |
| Number of securities | 12,500 | 5,000 |
| Profit per security | +$0.40 | +$1.00 |
| Profit | $5,000 | $5,000 |
| Return on investment | 400% | 50% |
What is a Bond/Warrant?
A bond/warrant is Convertible Loan broken into its two constituent parts, being a bond (or loan to a Company), with a detached Warrant (an option to buy the shares).
Just like a convertible loan, when the warrants are exercised, the investor is effectively converting from debt into equity. This is achieved by making the cost of exercising the warrant the same as the value of the loan, so that when the Company receives the proceeds from exercise, they can be used to extinguish the loan. In turn, the investor has effectively cancelled the loan, in exchange for shares from the Company.
Just like a convertible loan, the attraction to the investor is that they prior to conversion they receive the benefits of a loan structure: interest and more protection in the capital structure, but they also have the opportunity to make an additional profit if the share price rises above the strike or conversion price.
Often a traditional convertible note does not allow the flexibility of early repayment because when the loan is repaid the investor loses the optionality of converting into shares. Convertible notes often prohibit early repayment because issuer Companies may be incentivised to repay or refinance the convertible note, just before the investor can profit from the rising share price.
Therefore, a bond/warrant structure can be attractive to the Company versus a traditional convertible loan as the Company retains the right to repay the bond whenever it chooses. Likewise, the investor is happy because if the loan is repaid early, they retain the warrant and keep the optionality to make a profit from the rising share price, but without any capital at risk i.e., they have created a free warrant.
Bond/warrants are a win-win for both the investor and the Company, but they are also a win for other shareholders. This is because the inherent attraction of the structure means the warrant strike price can justify at a material premium to the prevailing share price, therefore shareholders are less diluted, compared to raising capital via the issuance of shares. It's a win-win-win!
Funds operated by this manager:

6 Oct 2023 - Hedge Clippings | 06 October 2023
|
|
|
|
Hedge Clippings | 06 October 2023 As expected, the RBA kept rates on hold last Tuesday, and in the Governor's statement following the board meeting, incoming chair Michele Bullock stuck to her predecessor's script: While cautious, she expects inflation won't be back to the 2-3% target range until late 2025 - at least 2 years away. As always, the last sentence of RBA-speak remained consistent: "The Board remains resolute in its determination to return inflation to target and will do what is necessary to achieve that outcome." That warning provides those economists predicting one more rate rise this cycle the chance that they'll be proven correct, but based on the numbers available at present, the 12 upward steps totaling 4.0% taken to date seem to be having the intended result - although the progress is painfully slow, while the effect on mortgage holders is just painful. Things may seem steady in Australia (at least on the monetary policy front) but in spite of our comment in last week's Hedge Clippings that the outlook for US rates was broadly the same as here (i.e. steady as she goes, although "higher for longer") but with the chance of one more rate rise, that possibility seems to have been confirmed. The market was certainly not waiting for confirmation: The yield on 30-year US government bonds hit 5% on Tuesday for the first time since 2007. In the United Kingdom, the yield on 30-year bonds also reached 5% this week, the highest level in more than two decades. Yields on German long-dated bonds are back to levels last seen in 2011. Yields on Italy's 10-year bonds hit 5% on Wednesday, the highest level since 2012, when the Eurozone debt crisis was in full swing. So even though the outlook for Australian rates may be cautiously optimistic, (i.e.staying steady) the global outlook for bonds, and, as a result, equities, is causing considerable pain both globally and in Australia. News & Insights New Funds on FundMonitors.com Investment Perspectives: A big disinflation tailwind is coming | Quay Global Investors China - the re-opening trade that never quite was | 4D Infrastructure August 2023 Performance News Equitable Investors Dragonfly Fund
September 2023 Performance News |
|
|
If you'd like to receive Hedge Clippings direct to your inbox each Friday |

6 Oct 2023 - Is Tesla just another car company?
|
Is Tesla just another car company? Montgomery Investment Management September 2023 In the ever-evolving landscape of the automotive industry, few companies have captured the world's attention quite like Tesla. Thirteen years ago, electric cars were synonymous with virtue signalling rather than high-performance excitement. However, Tesla disrupted this perception, transforming electric vehicles into something thrilling and aspirational. Its journey, from a modest initial public offering (IPO) in 2010 to a valuation exceeding $1 trillion in 2019, has been nothing short of remarkable. Yet, recent stagnation in Tesla's stock price has prompted a critical question: Is Tesla still the visionary pioneer it once was, or is it merely becoming "just another car company"? A background to Tesla Thirteen years ago, in 2012, hybrid electric cars were unsexy and uninspiring. Think of the Toyota Prius here in Australia, or the Chevrolet Volt and Nissan Leaf in the U.S. These were virtue-signaling vehicles designed without mass appeal in mind. Manufacturers also had a vested interest in their legacy internal combustion engine (ICE) models and weren't tooled up for mass adoption of electric vehicles (EV). Tesla changed all that, first delivering exciting luxury cars that also happened to be fast and battery-powered, before widening the appeal by launching more affordable models that were also powerful and equally good-looking. Around thirteen years ago, a small company called Tesla Motors (NASDAQ:TSLA) launched its initial public offering (IPO) on the NASDAQ stock exchange, raising a total of U.S.$226.1 million at a (split adjusted) share price of U.S.$3.40. Three years later, in 2013/14, Tesla transitioned from being essentially a start-up with highly uncertain survival prospects to being a credible auto business, redefining public expectations around electric vehicles with its introduction of the Model S, and in 2013, generating its first quarterly profit. Excitement in the stock market for Tesla, however, was arguably greater. Between 1 January 2013 and 1 January 2014, consensus full-year earnings forecasts for Tesla were revised up sharply, with 2015 net income forecasts moving from U.S.$247 million to U.S.$432 million and 2016 net income forecasts moving from U.S.$415 million to U.S.$784 million. The less-than-doubling of earnings expectations however, resulted in a 10-fold increase in the share price as the discount associated with doubts about the company's survival unwound. Tesla's profits fell well short of those forecasts, with the company reporting a net loss in 2015 of U.S.$889 million and another net loss in 2016 of U.S.$773 million. Yet the market's excitement didn't wane. The share price gains didn't continue, but the price gains didn't reverse either. Profitable hopes were simply deferred. At the start of 2015, Tesla commanded a market valuation of close to U.S.$30 billion, well short of the value ascribed to the world's largest automakers, but still around half that of Ford and General Motors. It wasn't until 2019 that the fortunes of Tesla started to take off, with its shares jumping from U.S.$12.65 in May 2019 to a split-adjusted U.S.$409.97 on November 04, 2021, and a market capitalisation of over U.S.$1 trillion. In mid-2020, Tesla achieved four consecutive quarters of positive net income for the first time in its history, and over the prior 12 months consensus net income forecasts for Tesla increased substantially. The 2021 forecast increased to U.S.$3.15 billion from U.S.$1.72 billion, and the 2022 number rose to $5.03 billion from $3.44 billion. This less-than-doubling of earnings forecasts had driven another 10x share price move. Tesla today Today, however, the share price is roughly where it was almost three years ago. If the gas has been let out (pun intended) of the share price's ascent, it begs a question: what if Tesla is just another car company? Tesla is still the market leader in battery-powered electric car sales in the U.S., with a market share of above 60 per cent, and the company's flagship Model 3 is the best-selling EV model in the U.S.. Meanwhile, Tesla's market capitalisation today of U.S.$777 billion is more than the combined market capitalisation of the next eight biggest manufacturers, including (in descending order) Toyota, Porsche, BYD, Mercedes Benz, VinFast Auto, BMW, Volkswagen, and Ferrari. Not unlike Apple, Tesla has adopted a closed-ecosystem approach to its products, owning the cars, the servicing, and the charging directly, setting it apart from other manufacturers. But does this deserve the hefty multiple placed on the company's earnings that renders it as valuable as the world's next eight biggest manufacturers? Investors can buy Toyota for $22,000 per vehicle sold in 2022, BMW for $27,825, BYD for $53,800 per vehicle sold, or they can buy Tesla for nearly U.S.$591,000 per vehicle sold. The economics between Tesla and every other car manufacturer in the world, in the long run, might be slightly different. Still, they cannot be sufficiently dissimilar to justify such a disparity in either absolute market capitalisation terms or in relative terms. Despite a share price today that is 40 per cent below its all-time high, enthusiasm for the world-changing potential of EV technology has clearly translated to an equally transformative approach to stock market valuation for Tesla. What investors are forgetting, however is that Tesla will ultimately be a car company. As competitors catch up, the competitive advantage of Tesla will erode. Meanwhile, any differences in the economics of car manufacturing between Tesla and its rivals will also diminish as more of each brand's fleet moves to electric. In time it will be harder to justify such a disparity between Telsa's market valuation and that of its competitors. Ten reasons why the differences will narrow Increased competition: As we have written about many times, an increasing number of automobile manufacturers, including traditional giants and EV startups, are producing electric vehicles that compete directly with Tesla's lineup. Brands like Ford, Rivian, Lucid, and Chevrolet have rolled out new electric models that, in some cases, outperform Tesla in terms of range, performance, and looks (the latter being subjective of course). And while the market for EVs overall is growing, Tesla's dominance in EV market share in the U.S. has already slipped from 72 per cent to 62 per cent in just the first year of rising competition and brand choice. Meanwhile analysts believe Telsa's market share could fall to as little as 18 per cent by 2026 from 78 per cent in 2018. Ageing product line: Tesla first new passenger vehicle model in three years is the just released updated Model 3. This 'stagnation' in model releases provides competitors with an opportunity to entice potential Tesla customers with newer and potentially more advanced options resulting in Tesla losing further share. Struggles in key markets: China, the world's largest auto market, has been a significant growth engine for Tesla. However, the company has experienced a softening in demand in China. Local competitors, of which BYD Co. is the largest by no means alone, are making significant strides, offering a more diversified range of models that cater to various price points. Critics in China suggest Tesla does not fully understand the preferences of Chinese consumers. Marketing and branding issues: Tesla's decision to offer discounts to boost sales is a departure from its earlier stance, indicating potential demand challenges and lower margins. Furthermore, Elon Musk's controversial takeover of Twitter Inc. has affected Tesla's brand perception, pushing some potential buyers away. Distracted Elon Musk: Many shareholders are concerned that Elon Musk, the driving force behind Tesla, has been distracted with his acquisition and management of Twitter, now called X. Such diversions annoy analysts who believe they could impact Tesla's strategic directions and operational efficiency. Share price malaise: Tesla's share price is unchanged from almost three years ago, suggesting investors are acknowledging the challenges Tesla faces and waking up to the reality of the long-term economics of manufacturing cars. Inability to meet growth targets: Despite aggressive scaling efforts, Tesla is falling short of its annual growth targets. With a 40 per cent annual growth rate in 2022 compared to 87 per cent in 2021, the company's exponential growth might be plateauing if Elon Musk's target of two million vehicles in 2023 is not met. Shifting strategies: Elon Musk's statement back in July 2021 that the "goal is not to be a car company" suggests a broader and potentially more diffuse focus and remains a reminder for analysts who focus too closely on the company's position and growth in the automobile industry. Over-reliance on existing models: Rather than diversifying its lineup, Tesla is focused on scaling up and churning out as many of its existing models as possible. This strategy is at odds with conventional (and capex intensive) wisdom that releases new models almost annually. The traditional auto industry belief is car makers need to offer a wide range of updated and more advanced models to keep buyers interested and part of their brand 'family'. Valuation metrics: At September 2023 Tesla is trading at 63.1 times trailing twelve-month (TTM) earnings. This compares to 120 times at the end of 2021. At either measure the price-earnings (PE) is a market valuation more typical of high-growth tech companies than a car manufacturer. Conclusion If Tesla does indeed become 'just a car company', the sharp drop in PE will continue and reflect a growing realisation in Tesla's growth prospects, its position in the auto industry, and its economics are less exciting than once believed. Tesla remains a global leader in the EV market with strong fundamentals, however, there are clear signs that it faces increasing challenges from competitors, potential demand issues, and market sentiment shifts. The lofty valuations and hype surrounding the company needs to be re-evaluated considering these inescapable realities. Author: Roger Montgomery Funds operated by this manager: Montgomery (Private) Fund, Montgomery Small Companies Fund, The Montgomery Fund |

5 Oct 2023 - Performance Report: Equitable Investors Dragonfly Fund
[Current Manager Report if available]

5 Oct 2023 - The hidden value in securitisation warehouses
|
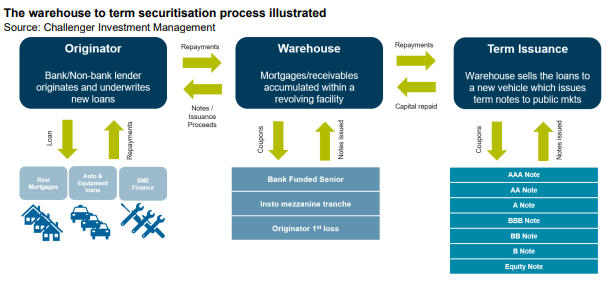
The hidden value in securitisation warehouses Challenger Investment Management September 2023 Early in my career I was introduced to the adage, "you get paid for brain damage". Despite its crudeness, the expression has proved accurate. Put another way, if you are willing to make the effort to understand and mitigate complexity, you can often get paid outsized returns for doing so. In the years following the global financial crisis, securitisation markets were viewed as overly complex. Regulatory bodies disincentivised pension funds, banks and insurers from investing in these markets outside of the most risk remote tranches. Investors that were willing to finance mezzanine tranches of securitisation issuance were rewarded handsomely for it. Fast forward to today and while markets have normalised to a degree the structural opportunity remains. However sophisticated investors have recognised that the real opportunity lies in the manufacturing of new securitisation bonds in private markets, so called warehousing or pre-securitisation finance. As a reminder a securitisation pools a group of loans/receivables into a pool which are then tranched into bonds of different risk and return profiles. A warehouse is a securitisation that allows a lender to accumulate a sufficient volume of receivables to then issue into the public market.
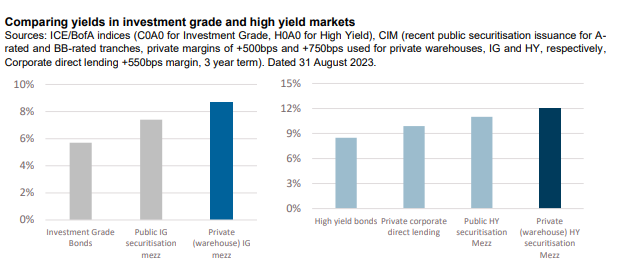
In the warehouse market the senior financier is typically a bank who will also act as the arranger of the public transaction. Prior to the Global Financial Crisis banks were willing to fund close to (and in some cases even more than) 100% of warehouse with the difference comfortably funded by the originator of the loans. There was no need for anyone to bridge the gap between senior bank funding and equity. The post GFC world is immeasurably different. Basel III capital standards impose extremely punitive capital treatment for banks that lend below investment grade ratings, especially where they are not in the senior tranche. For some asset types, the gap between where banks are willing to lend to and where the originator can fund can be 20-30% of the overall pool of collateral. This is the first piece of the value puzzle for securitisation warehouses. Regulations have created a structural gap in warehouse funding markets into which alternative lenders have enteredBut not just anyone can step into a warehouse. As with many private lending transactions execution risk, ongoing management and certainty of capital are critical considerations for a borrower. Alternative credit funds who are active in warehouse lending will typically have well established intercreditor relationships with multiple senior bank financiers and a long track record of efficient execution of transactions through multiple cycles. Scale also matters; an ability to grow the warehouse over time and even provide incremental capital to de-risk senior is also an important consideration for a borrower. Unlike corporate lending markets where even private transactions have some degree of standardisation, warehouses tend to be bespoke to meet the specific needs of the borrower. Having experienced counterparties who are a known quantity can reduce the cost and risk of execution. You may ask why cost and risk of execution are so important in securitisation warehouse transactions. The answer lies at the heart of the second, and in our view most important piece of the value puzzle. Securitisation warehouses are a means to an endSecuritisation originators make their returns by terming out warehouses into public markets at the lowest possible cost of funds. The warehouse allows the originator to get a sizeable enough portfolio that meets the specific needs of the public market securitisation investors, thus lowering the cost of funds. The goal of the warehouse is to get to the public markets as quickly and efficiently as possible. Experienced originators understand that the trade-off for the speed and efficiency in the warehouse is higher returns to the warehouse financiers. For the senior banks, the higher returns come through transaction fees for arranging and distributing the public securitisation. For the alternative credit funds providing the mezzanine finance, the margins in warehouses are generally around 2% per annum higher than the margins in public term transactions of the same implied credit ratings. With cash returning close to 5% across most developed markets, the all-in yield on a warehouse trade is in the low teens for a credit risk profile that often blends to around a BB credit rating. This is a considerable pickup over the high yield bond market which is only yielding around 7% in US dollar markets.
The final piece of the value puzzle relates to risk and is strongly tied to the "means to an end" argument. Because the warehouse is such an integral part of the value creation chain, borrowers have tended to go to great lengths to maintain the performance of their warehouses. This includes putting in additional equity/subordination, buying back non-performing receivables or targeting a lower risk profile with new originations. Subordination levels are also typically set based on a hypothetical 'worst case' pool based on eligibility criteria and portfolio parameters meaning that required subordination levels are higher than what they would be based on the actual pool. While we think there is a strong case for securitisation warehouses being lower risk than public market securitisations, it is important to acknowledge that they can be dangerous in the wrong hands. After all, these are mezzanine tranches where 100 cents in the dollar can be lost if there is a default. Potential investors need to be wary of this and understand the key risks which include:
The securitisation warehouse market is one of the more esoteric parts of a private lending landscape that is rapidly gaining the attention of investors across the globe. The more mainstream parts of the US and European direct lending landscape are now characterised by a group of mega funds increasingly competing with public markets (and each other) to provide multi-billion dollar leveraged buyout debt packages. The next, and in our view most attractive, opportunities in private debt lie in more niche subsectors and geographies which remain off the radar of these mega funds. Funds operated by this manager: Challenger IM Credit Income Fund, Challenger IM Multi-Sector Private Lending Fund |

4 Oct 2023 - China - the re-opening trade that never quite was
|
China - the re-opening trade that never quite was 4D Infrastructure September 2023 In this article, we explore why China's re-opening has proven to be more fizzle than fireworks.
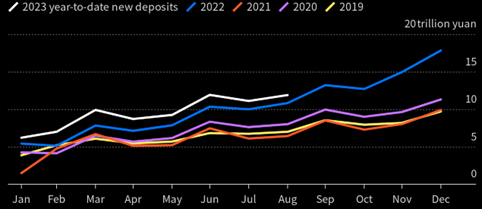
So, what went wrong? The data China's economic re-opening initially followed the expected trajectory. However, it sputtered out in the second quarter, and by July, activity numbers looked terrible. Some stabilisation has occurred in the latest August releases, but most key measures are still well below pre-COVID levels. The expectation of a pent-up consumption wave has been replaced by a more cautious household approach, marked by a higher savings rate than the four years prior. Chinese household savings
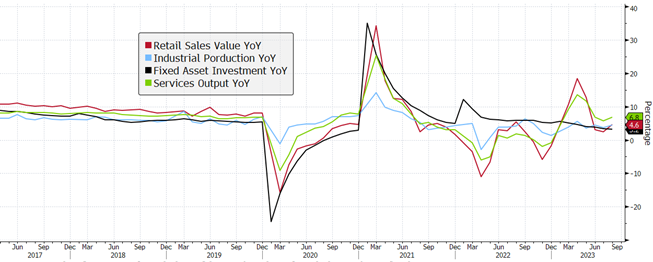
One of the main sectors that did benefit from the re-opening was restaurants (+19.4% YTD), as Chinese consumers embraced 'activities' post-extended COVID lockdowns. This was at the expense of spending on household goods (home and office appliances, and building materials). The chart below shows China's retail sales growth. Key activity data
Since re-opening, other activity, loan and survey data has also been mixed:
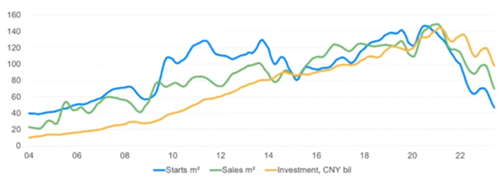
The slowdown in sales has put pressure on developer cashflows, with Country Garden, the largest developer outside of Tier-1 cities, under bankruptcy clouds in August. Any further signs of stress in the property market will have a detrimental effect on consumer confidence. Real estate measures (trended, mil m2, CNY bil)
Policy response and stimulus The Chinese government understands that stabilising the property market is crucial to shifting the consumer mindset towards a more spending-oriented approach, not just in the short term but as part of a long-term transition from heavy investment and export-driven growth to domestic consumption and value-added sectors. Initially, investment markets expected substantial stimulus measures when signs of weakness emerged in Q2. However, during their July politburo meeting, the People's Bank of China (PBoC) opted for more targeted fiscal stimulus across specific sectors and smaller policy measures. The government has refrained from providing cash handouts, a stance endorsed by western governments. In essence, the Chinese government is prioritising boosting consumer sentiment and spending over pursuing indiscriminate growth, especially given the significantly higher Chinese government debt compared to previous periods of stimulus, such as the Global Financial Crisis (77.7% of GDP vs. 29.3% in 2007). To date, triggers that have been pulled include:
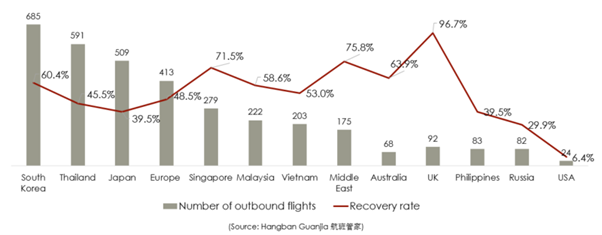
Our infrastructure exposure Within 4D's investment universe of core infrastructure, notably airports, ports, toll roads and utilities, the fundamental outlook has been mixed, with significantly overdone equity market moves. Travel demand in China has been a story of two markets. Domestically, flights are now above pre-pandemic levels, while, as at July, international travel is only at 46.9% of pre-pandemic levels. The slower-than-expected international recovery is due to the slow easing of restrictions (access to new passports and visas, group travel). Flight capacity has also been patchy regionally, and highly political, with capacity negotiated bilaterally between countries. However, we believe the demand is there. As consumer confidence increases, we expect an increase in Chinese tourists in European and Asian airports. European operator, Fraport, highlighted that there had been a steady recovery since re-opening from 18% of pre-pandemic levels in January, to 52% in June, with expectations this will continue to ramp up in the second half of the year. It has left its outlook unchanged for the financial year, anticipating Q3 will be back to 50-60% of 2019 while Q4 is expected to reach 80%, with December at 90%. Adding to the positive international momentum, in August, an additional 78 countries were added to the list where travel agents were allowed to sell group tours and package travel. Outbound flights from China (July 2023)
In the Chinese toll road sector, network traffic is now exceeding pre-COVID levels at 100- 120%. Some government policies on consumption are also benefiting the sector, such as reducing the tax on passenger vehicles and increasing subsidies for electric vehicles. Domestic car ownership maintained steady growth in the first half of 2023, reaching 328m vehicles (+5.8%). Further, the balance sheets of the listed toll road operators are in a very strong position to take in new assets should the provincial governments look to raise capital through asset sales. The port sector has seen muted volumes at both an export and import level, while yields have been solid. The volume story should not be a shock to the market - as flagged by operators - it's partly structural due to factors other than the stalled re-opening (e.g. global onshoring). The gas sector has fundamentally been slower to rebound. There has been some loss in volume growth given the slower economic activity, especially for those exposed to factories and manufacturing regions. There is also some concern over the slowing property market and a loss of new-connection revenue. However, the market has completely over discounted what we believe to be short-term shocks, and the sector is currently offering very attractive value. On our stress testing, we would have to assume zero volume growth for the next 25 years and a huge jump in the risk premia to get close to current prices. Conclusion The COVID re-opening boom and revenge-spending that was witnessed globally did not eventuate or persist as expected in China. Whilst activity data, credit growth, and consumer and business confidence has been weak, there have been signs of stabilisation in recent data points. However, one month doesn't change a picture, and market sentiment remains very poor, with foreign investor outflows still elevated. At an infrastructure sector level, domestic activity on toll roads and domestic air travel are already ahead of 2019 levels. Furthermore, the easing of travel restrictions and opening of travel capacity with key travel markets will positively impact European and Asian-based airports relying on Chinese travellers. Regardless, Chinese equities are pricing in multi-cycle low valuations, and some stocks are trading as if the re-opening never happened. We continue to be highly selective in our portfolio and continue to invest on fundamental value and assess investment opportunities that are beneficiaries to the Chinese economy, both directly and indirectly. |
|
Funds operated by this manager: 4D Global Infrastructure Fund (Unhedged), 4D Global Infrastructure Fund (AUD Hedged), 4D Emerging Markets Infrastructure Fund For more information about 4D Infrastructure, visit https://www.4dinfra.com/ The content contained in this article represents the opinions of the authors. This commentary in no way constitutes a solicitation of business or investment advice. It is intended solely as an avenue for the authors to express their personal views on investing and for the entertainment of the reader. |


3 Oct 2023 - Investment Perspectives: A big disinflation tailwind is coming
29 Sep 2023 - Hedge Clippings | 29 September 2023
|
|
|
|
Hedge Clippings | 29 September 2023 Although some sections of the media attempted to make a big deal of it, Wednesday's headline annual inflation rate for August, which came in at 5.2%, up from 4.9% the previous month, was both widely expected, and no cause for the RBA to reverse their recent "pause" approach. That will come as a relief for Michele Bullock, who would hardly have wanted to kick her tenure off with a rate rise after three straight months of them holding steady. The RBA board will be more interested in the core inflation level, which excludes volatile items such as fruit and vegetables, fuel, and holiday travel, and which fell to 5.5% from the previous month's level of 5.8%. The pain points in the numbers were bread and cereals, and dairy, both of which recorded a 12 month rise of just over 10%, offset by fruit and vegetables which fell by 8.3%. We assume anyone on a diet of bread and potatoes therefore (apart from a growing girth) would have come out about even! On a more serious note, gas and electricity rose over 12%, and fuel costs were up almost 14%, as anyone who has filled up recently would know. While inflationary, both these are in part doing the RBA's job of dampening consumer demand, as evidenced by the insipid retail sales figures for August, which came in at 0.2% for the month, and 1.5% for the year. While a few economists are still predicting the possibility of one more rate rise down the track from the RBA, on current data that's unlikely. However, the "stronger for longer" inflationary and interest rate outlook is far more likely, with our view that the 2-3% band is at best a long way off, and quite possibly a thing of the past. Ditto in the US, although the potential for one more rate rise is possibly a little higher than here. However Jerome Powell is shooting for 2%, as opposed to the RBA's 2-3% band, and that's going to be even harder to achieve without more consumer and economic pain. Ditto, or at least "deja vu" seems to be the best way to describe a number of goings on in the US at present: The recurring potential for a government funding shutdown is on again, although as yet markets don't seem too concerned. Maybe they're getting used to it, having seen previous negotiations always end up the same way - with an increased debt ceiling. Sooner or later one would think the ceiling's going to crack, or ...? And finally, in the US everything to do with Donald Trump also seems to be a recurring theme, with yet another court appearance (and loss), and yet another non-appearance at a Republican presidential debate. Neither avoidance, nor appearance seem to dent Trump's self belief, or for that matter, his supporters' commitment to his cause. Only in America! Moving on: We could try to intertwine commitment into any discussion regarding the Wallabies performance in the RWC last week, but that might be a cheap shot. If you take a youthful squad, many of whom should only have been playing at the 2027 event, and leave your most experienced players behind, what do you expect? As far as commitment goes, or the perception of it, Eddie's discussions with the Japanese RU will hopefully result in him accepting their job offer. If it comes, it can't come soon enough! We hope the Wallabies can overcome Portugal on Monday morning, but even that might not be a foregone conclusion based on last week's performance. However, this week-end should see a tighter contest at both the AFL and ARL Grand Finals. Sit back and enjoy, and may the best teams win. News & Insights Market Commentary | Glenmore Asset Management Climate Finance Strategies and Global Decarbonisation | Emit Capital Market Update August | Australian Secure Capital Fund August 2023 Performance News |
|
|
If you'd like to receive Hedge Clippings direct to your inbox each Friday |

29 Sep 2023 - Performance Report: Insync Global Quality Equity Fund
[Current Manager Report if available]

28 Sep 2023 - Performance Report: DS Capital Growth Fund
[Current Manager Report if available]