
NEWS

27 Oct 2023 - Performance Report: Insync Global Capital Aware Fund
[Current Manager Report if available]

27 Oct 2023 - Performance Report: PURE Resources Fund
[Current Manager Report if available]

26 Oct 2023 - Performance Report: Equitable Investors Dragonfly Fund
[Current Manager Report if available]

26 Oct 2023 - Performance Report: Bennelong Twenty20 Australian Equities Fund
[Current Manager Report if available]

26 Oct 2023 - Why Cash Is (Still) Not King
|
Why Cash Is (Still) Not King Redwheel October 2023 |
||||||||||||
|
Cash is finally worth talking about. Almost two decades of considerable accommodative policy have handed cash a woeful reputation, but despite inflation being still too high for comfort, cash in various parts of the world is managing to offer a real return - but is this really the return of the king?
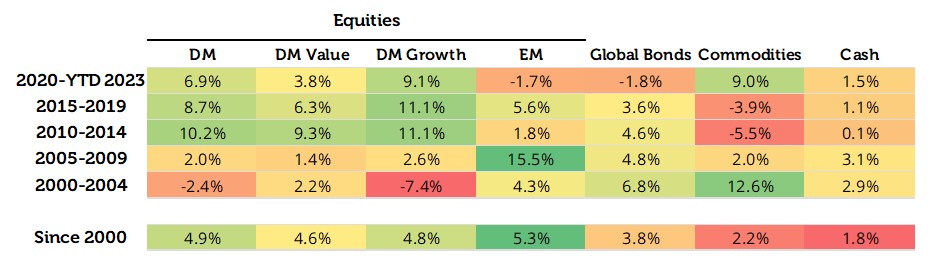
Source: Bloomberg, 3-month government bond yields and CPI as at 29/09/23 and 31/08/23, respectively. The information shown above is for illustrative purposes. After an era of relatively unassuming inflation, investors are now largely keen for it to lose steam - but not without weighing up the cost, with the higher for longer narrative still fuelling speculation of a hard landing. Both cash and equities are influenced by, and at times arguably at the mercy of, central banks getting these decisions right, with current efforts to 'land' inflation proving a good example. Thankfully, equities have much more to their story through owning a piece of a company and capturing its potential; cash lacks the possibilities that equities can offer over the longer term. The outcomes of these possibilities are, undoubtedly, not always favourable; being an equity investor can certainly be painful at times. But we mustn't forget what being an investor means and requires: long-term thinking, and crucially, patience. "The stock market is a device for transferring money from the impatient to the patient." - Warren Buffett And patience often pays off. Whilst cash can seem like an idyllic cocoon for investors in choppier markets, investors run the risk of being left behind in the longer term. Without a doubt, cash has often provided better returns in challenging market backdrops, but over longer periods of time, other asset classes have flourished - particularly equities. On top of this, typically when cash yields are trending higher, the economy is heating up - and a burgeoning economy is usually supportive of equities. When cash yields are high and this constrains economic activity, then not only should equities struggle, but yields will likely have to fall to encourage a recovery. Whilst these scenarios are not exhaustive, both highlight how equities still will often, ultimately, have the upper hand.
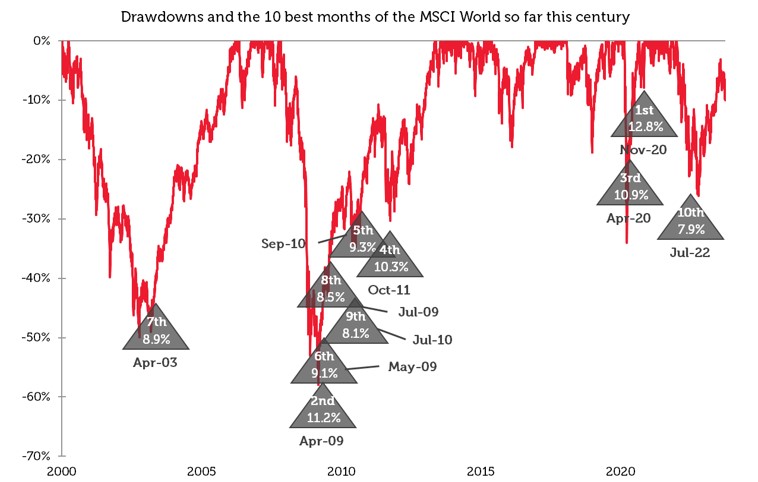
Source: Redwheel, Bloomberg, total annualised returns in USD as at 29/09/23 . Past performance is not a guide to future results. No investment strategy or risk management technique can guarantee returns or eliminate risks in any market environment. Equities may have reigned, but these returns mask the sizeable downturns equity markets experienced during these periods. This points to another key drawback to allocating to cash: timing. Once you are out of the market, there is the notoriously difficult - and practically impossible to consistently get right - call of when to get back in. This daunting job is one of the best kept secrets in the world of investing; even when removing human emotion and behavioural biases, algorithmic approaches have been inconsistent in finding ways to time the market, though with AI in relative infancy, it could hold some promise if it can evolve to be able to keep up with markets. The recent uncertainty has seen cash continue to attract flows, but with an equity market that ultimately seems to be evergreen - no matter what you throw at it - investors could easily find themselves holding onto cash balances for longer than anticipated. Let's not forget that the longest US stock market bull run lasted nearly 11 years, or 131 months, following the fallout of the 2007/08 global financial crisis that created a much shorter, 17-month bear market. It was only stopped in its tracks by the Covid pandemic, but a new bull run was subsequently born, albeit narrower and shorter. Further, the bear market prompted by the outbreak of Covid only lasted a mere 33 days and may have wiped over c.30% off the market, but the market rebounded c.70% for the rest of the year, which meant the S&P 500 delivered a total return just shy of 20% for 2020 - considerably higher and a real return compared to 0.7% from US T-Bills. Although these are extreme examples, over the years, some of the most sizeable stock market gains have taken place during, or just after, bear markets. Clearly, based on this, cash is not king - unless you (miraculously!) have impeccable timing. Time in the market often proves a lot more fruitful than market timing. You have to be in it to win it; granted, this mantra is an oversimplification - reaping the benefits of equities' outperformance does not come without experiencing some shorter-term volatility; investing isn't about a quick and easy win but comes down to wins outweighing losses and incrementally building on those wins over time when it comes to achieving longer term gains.
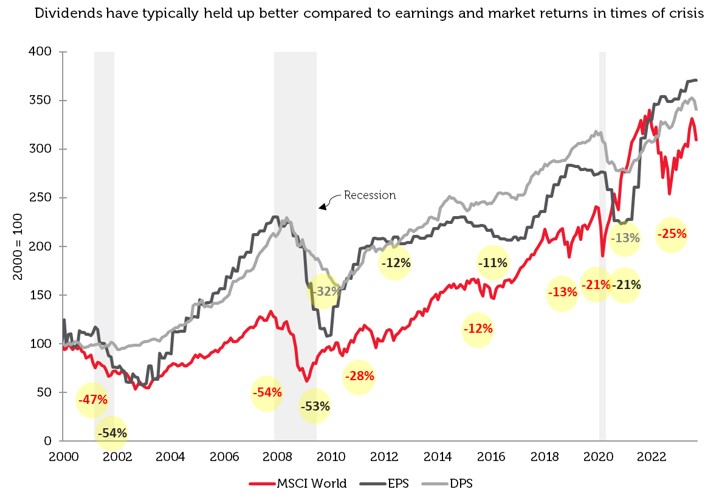
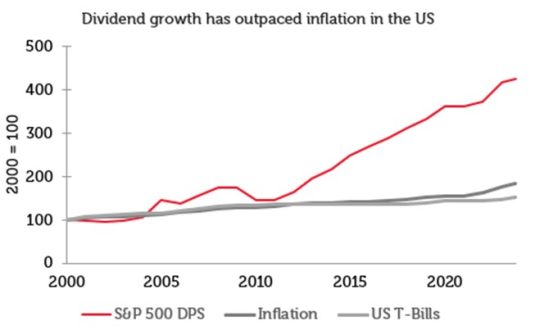
Source: Redwheel, Bloomberg. MSCI World Index, total returns in USD as at 29/09/23. Past performance is not a guide to future results. We have always believed that it is better to stay engaged with equities, but we don't just mean any equities. When it comes to investors thinking about taking risk off the table, we believe balancing the equity mix needs more of the spotlight than turning to cash. Stocks offering higher income than the market are often put head-to-head with cash given their dividend payments. Income stocks may not offer the prospect of sizzling returns in the shorter term compared to other areas of the equity market, but those with quality characteristics, particularly, can compound (growing) dividends as well as offer capital appreciation when it comes to longer return horizons, where equity volatility tends to even out. Compared to cash, dividend payments come with greater uncertainty, but we have found that focusing on quality companies cushions the risk to dividend payments. Further, dividends have often experienced softer contractions and recessions compared to earnings and market returns. We have also found that being disciplined in sticking to stocks that compound income that is higher than the broader market helps evade temptation to time the market, due to the focus on compounding dividends given its significant contribution to returns over the longer term. Even though this century has so far seen dividends often take more of a backseat in US markets, they have firmly outpaced inflation, whilst the same cannot be said for US T-Bills.
Source: Redwheel, Bloomberg. Total returns (monthly) in USD, EPS (earnings per share) and DPS (dividend per share) of the MSCI World Index, rebased indices, as at 29/09/23. Past performance is not a guide to future results.
Source: Redwheel, Bloomberg. DPS of the S&P 500, US CPI and Bloomberg US Treasury Bill Index, rebased indices, as at 29/09/23. Past performance is not a guide to future results. We believe that for cash to truly serve more of a strategic purpose, it ultimately comes down to timing to ensure to not miss out on equity markets' ability to soar. After all, when was the last time investors were inspired by a bull market in cash? We recognise that market timing is not our forte; as investors we are in it for the longer term - but we don't believe cash is when it comes to helping our strategy and investors achieve longer term returns. |
||||||||||||
|
Funds operated by this manager: Redwheel China Equity Fund, Redwheel Global Emerging Markets Fund |
||||||||||||
|
Sources: [1] Indices: Developed Market Equities (DM) - MSCI World Index; Developed Market Value Equities (DM Value) - MSCI World Value Index; Developed Market Growth Equities (DM Growth) - MSCI World Growth Index; Emerging Market Equities (EM) - MSCI Emerging Markets Index; Global Bonds - Bloomberg Global Aggregate Bond Index; Commodities - Bloomberg Commodities Index; US T-Bills (Cash) - Bloomberg US Treasury Bill Index. Key Information |

25 Oct 2023 - Performance Report: Altor AltFi Income Fund
[Current Manager Report if available]
25 Oct 2023 - Performance Report: PURE Income & Growth Fund
[Current Manager Report if available]

25 Oct 2023 - The Fall and Rise of Uranium
|
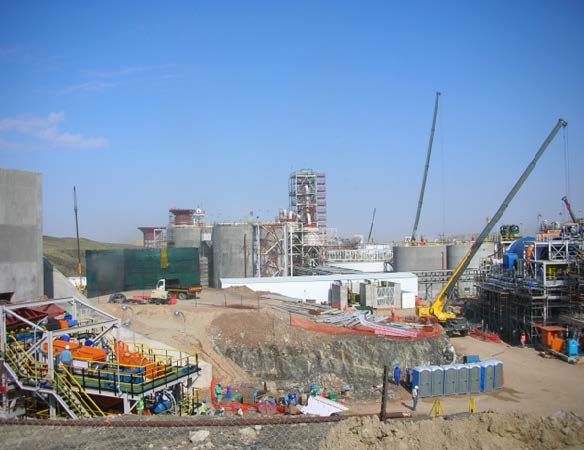
The Fall and Rise of Uranium Eiger Capital October 2023 The nuclear industry is undergoing something of a renaissance. For anyone with an interest in the industry, even a passing one, it's been a painfully long wait, but the uranium worm certainly seems to have turned. Over the past 12-18 months, we have added positions in Boss Energy (BOE.ASX) and Paladin Energy (PDN.ASX), two uranium miners. At the time of writing, the uranium spot price had topped US$70/lb, a 13-year, pre-Fukushima high and contracted volumes are on the up. In that time there has been more than one surge in the commodities sector, but uranium has missed out every time. So how did we get here?
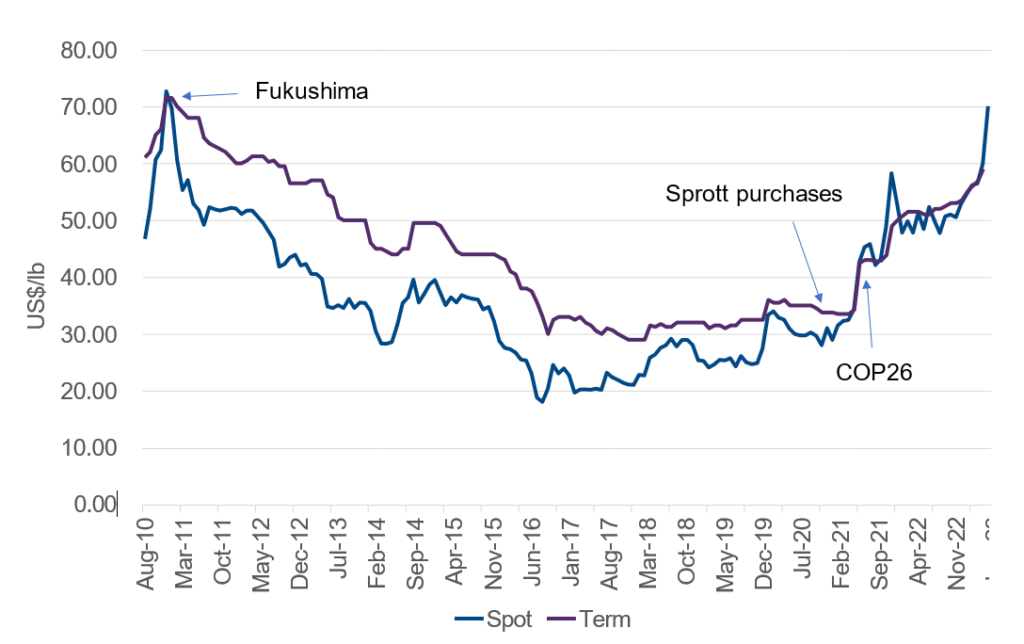
Langer Heinrich Stage 3 construction circa 2011 (about a month prior to Fukushima) - uranium was looking up The FallNot much moves quickly in the nuclear industry. The last time we experienced this level of positivity, one of our team was on site at Paladin's Langer Heinrich (LH) uranium mine in Namibia. That was in early 2011 during the Stage 3 expansion (see above). The mood then had turned bullish even though the uranium price had peaked three years earlier at over US$130/lb . Uranium price, US$/lb (Source: Cameco) Most commodities overshoot and that was certainly the case with uranium in 2007 as phenomenal Chinese growth erased a decades long malaise in uranium. However, over the next three years, the price did not dip below US$40/lb and exceeded US$70/lb around the time of that LH site visit - about where we find ourselves now. Prices were high, the mine was expanding, and uranium was being hailed as a natural alternative to coal for reliable baseload, driven by a "green energy" tailwind. What could go wrong? An earthquake. And an unusually big and complex one at that. It struck the east coast of Japan in March 2011, just a handful of months after that LH site visit. At magnitude 9, the so-called Great East Japan Earthquake was the largest in Japan's history and the fourth largest recorded since the advent of modern seismology, 110 years earlier. In other words, this was a very rare event. The earthquake and resulting tsunami disabled the cooling systems of the coastal Fukushima Daiichi Nuclear Power Plant, resulting in core meltdown in three reactors. While the Daiichi plant, which first began operating in 1971, was able to withstand the ground movement produced by the quake, it was not designed to cope with the 15m tsunami that followed. Unfortunately, the engineers had used a 1960 Chilean earthquake and its resultant 3m tsunami to design some of the safety systems at Daiichi. The plant's 10m elevation should have allowed plenty of room for a "regular" tsunami but proved to be inadequate on this occasion as no-one anticipated the magnitude of this event. In short, Japan's nuclear industry, which accounted for ~30% of the country's electricity generation, shutdown in a nationwide safety review, whilst a pall was cast over the global industry that would last a decade. A long, dark winterFukushima's impact on the global nuclear industry cannot be underestimated. For example, following the accident, Germany immediately shutdown eight of its 17 reactors and committed to close the remainder of its fleet, the last of which occurred in April 2023. Prior to the disaster, nuclear energy accounted for one-quarter of Germany's electricity production.
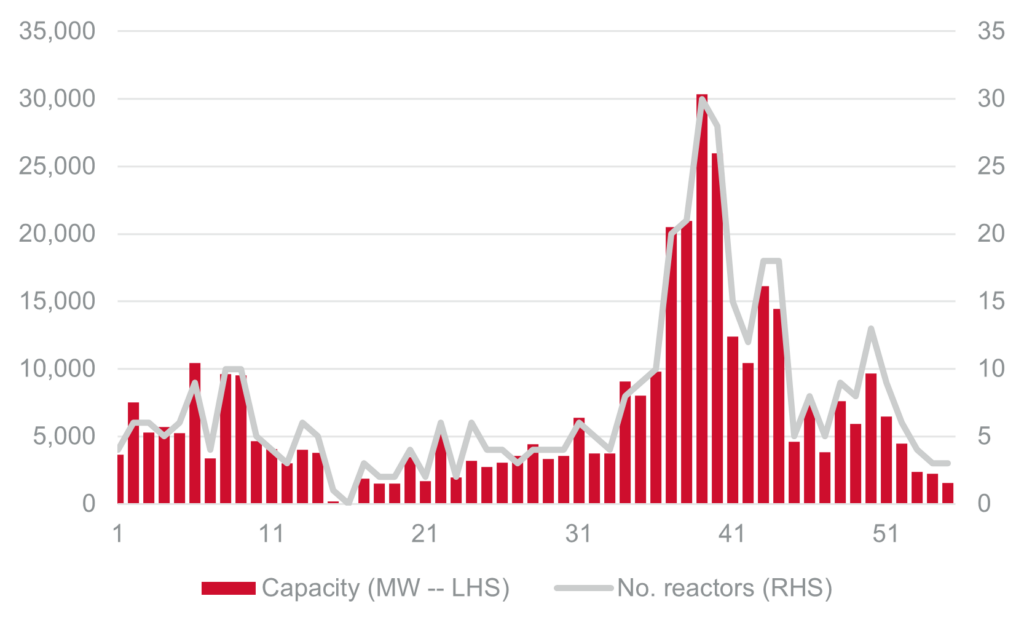
Reactor numbers are still low (Source: IAEA - PRIS) Overall, global electricity production from nuclear dropped 11%. Justifiably, fear of further accidents at older reactors and the increased cost of upgrading/replacing to newer, safer designs, impeded growth of the industry. Furthermore, sentiment was greatly impacted by the potential of renewables - would nuclear even be needed as baseload if windmills and solar panels could deliver zero-carbon power? On the supply demand side, Kazakhstan, the world's biggest producer of uranium, was ramping up production at the time of Fukushima, and continued to do so beyond the shutdown of the Japanese industry. To compound the problem, Canada's Cameco commenced full-scale commercial production at the underground Cigar Lake in May 2015. The eventual commissioning was complex and protracted. Development had started a decade earlier, but a series of water inflows flooded the mine (it's not called Cigar Lake for nothing). At the bottom in October 2016, the spot price of uranium dipped to US$18/lb and it would be another four to five years before market would stir.
Nuclear capacity under construction (Source: IAEA - PRIS) The SpringWe can probably trace the start of the current "boom" to mid-2021 when Canada's Sprott Asset Management founded its Sprott Physical Uranium Trust (SPUT), a physically backed financial product. Its purchases helped soak up excess market supply within a gently improving backdrop for nuclear energy. This enthusiasm was shortly followed up at the COP26 meeting in Glasgow, Scotland, later that same year, where nuclear energy again featured as a low-carbon alternative to coal baseload power but arguably with more urgency. It is increasingly apparent that net-zero by 2050 solely from renewables is extremely challenging and nuclear power represents one low-carbon way to fill the gap. In terms of power generation, nuclear energy offers several advantages over traditional baseload. Nuclear utilities are very long-life assets, land use is 30-100x less than other low CO2 options, CO2 emissions/kWh are lower than all other power sources except for wind, and life extensions of nuclear power plants represents the lowest cost low-CO2 energy. Other factors have combined to add upward pressure to the uranium price. For example, in the US, the Inflation Reduction Act (Aug 22) provides tax credits and development incentives for existing reactors and uranium resources, while the DoE commenced purchases for its Federal Strategic Uranium Reserve (Sept 22). Elsewhere, nuclear energy has been included in the green energy taxonomies of the EU, UK and South Korea. In geopolitical terms, there is clear uranium (and gas) supply risk around Russia following the invasion of Ukraine and the coup in Niger, the world's sixth largest supplier, has caused consumers like France some concern.
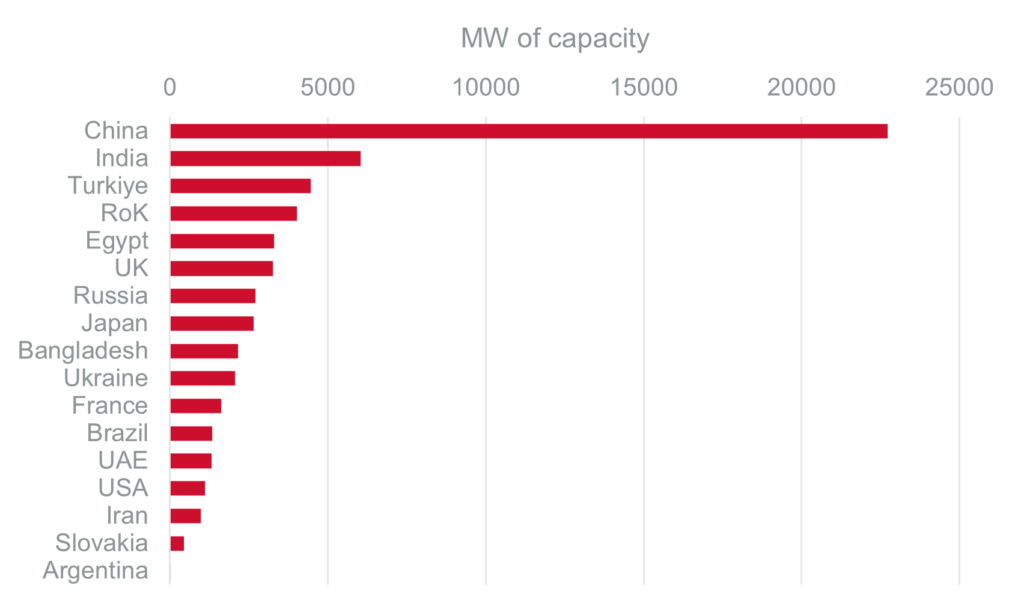
Nuclear capacity under construction (Source: IAEA - PRIS) From a capital point of view, we are seeing increased investment in nuclear power from Asia in particular (see above). On the supply side, uranium exploration and development has plummeted and remains at multi-year lows. While the uranium market is a closed and esoteric one that can be difficult to decipher, there is incremental benefit in the short-term from this supply-demand dynamic.
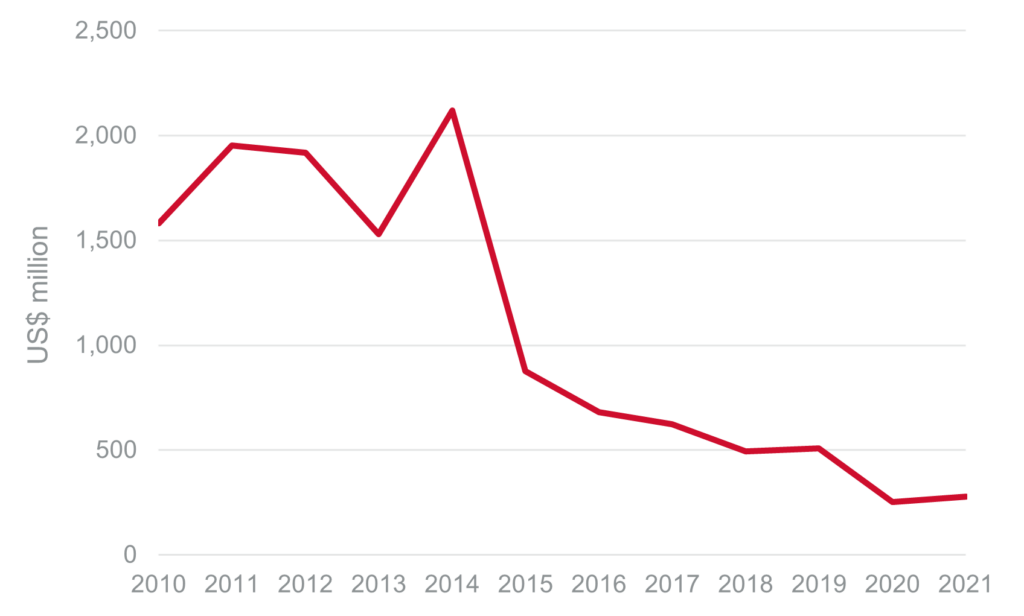
Global uranium exploration and development expenditure (Source: NEA/IAEA)
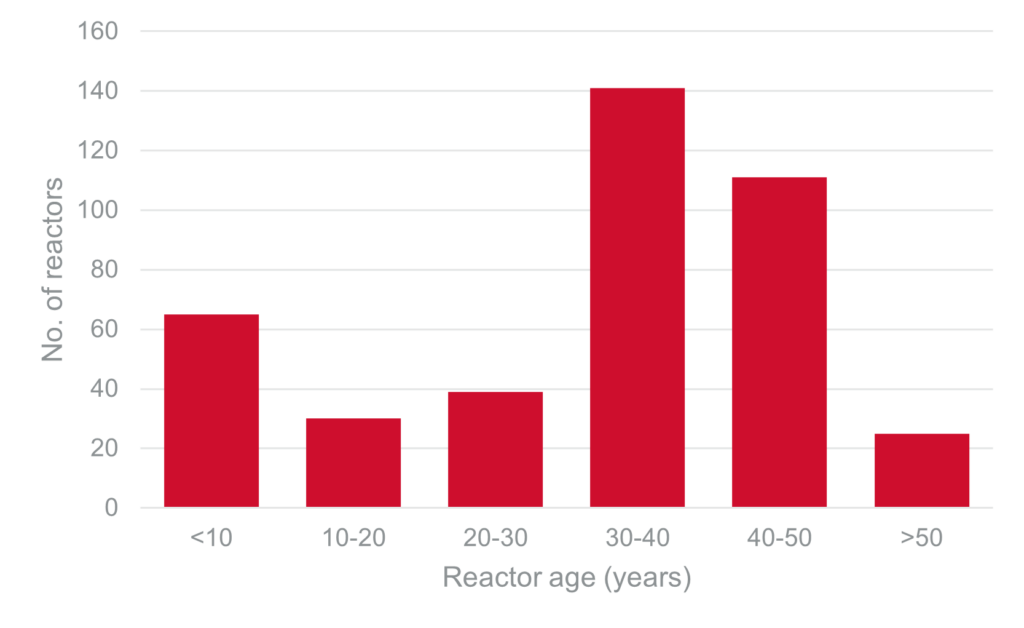
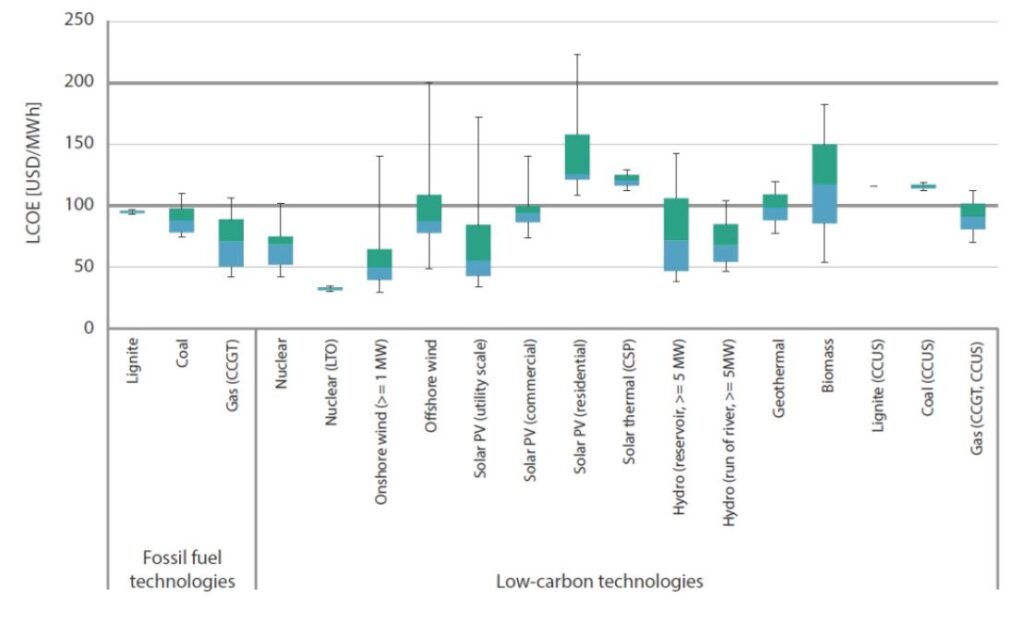
Note: Values at 7% discount rate. Box plots indicate maximum, median and minimum values. The boxes indicate the central 50% of values. i.e. the second and the third quartile. Source: IEA Where to from here?While the outlook for the uranium market is better than it has been for more than a decade, challenges remain. Nuclear energy is still a divisive issue due to ever-lingering safety concerns, and it could be argued that countries like Australia may never see its use. Other factors that impede acceptance include the upfront cost of construction, strict regulation and the time to build a new plant, where the median time is currently around 80-90 months. On the flip side, nuclear facilities are amongst the most rigorously engineered structures on Earth and provide very long life, consistent output. While upfront capex is very high, the levelized cost over the life of a nuclear asset is extremely competitive especially if life extensions to existing plants is considered. Moreover, new technologies, such as Small Modular Reactors (SMR) offer potential advantages in cost and safety. Finally, recent geopolitical developments such as the Russia/Ukraine conflict highlight the need for secure, reliable sources of power. In a world focused on low carbon electricity, it is not surprising that many nations are considering a nuclear future. Author: David Haddad, Principal and Portfolio Manager Funds operated by this manager: |

24 Oct 2023 - Australian Secure Capital Fund - Market Update
|
Australian Secure Capital Fund - Market Update Australian Secure Capital Fund October 2023
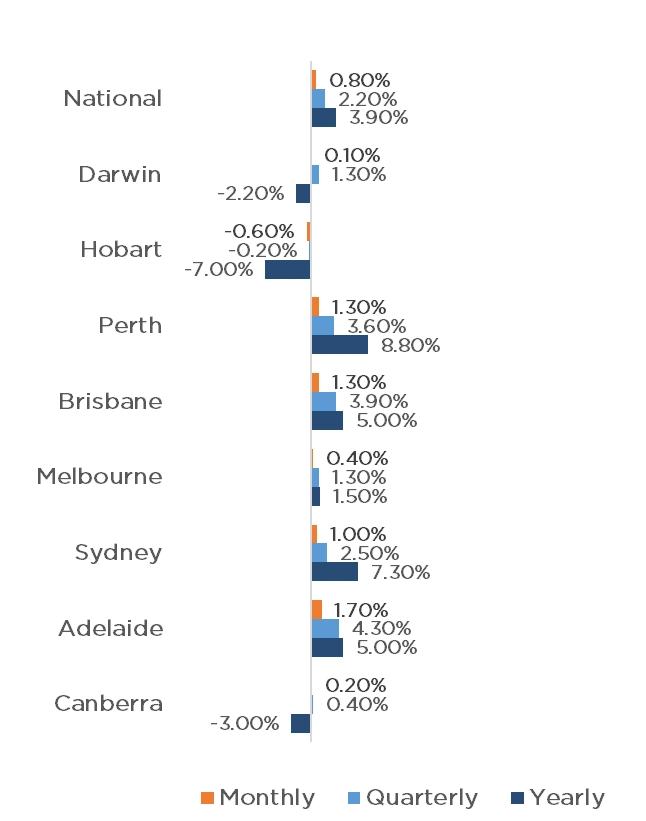
The first weekend of October saw the number of auctions decline significantly on the previous week (1215, down from 2,648), as is common on long weekends, caused by the AFL Public Holiday and the King's Birthday. Sydney recorded the most auctions of the capital cities, with 730 taking place, followed by Melbourne and Brisbane with 203 and 110 respectively. Adelaide and Canberra just missed out on triple digit figures, with 83 and 74 respectively, whilst just 13 and 2 auctions occurred in Perth and Tasmania respectively. Whilst the number of auctions declined for the week, clearance rates remained strong at 70.3% across the combined capitals (up from 59.7% last year). This was driven by Adelaide, Sydney and Brisbane all recording above 70% clearance rates with 79.3%, 71.7% and 70.7% respectively. Melbourne and Canberra also had moderate clearance rates of 66.0% and 62.5% respectively. The property market continued to grow yet again with a 0.8% rise for the month of September, taking quarterly growth to 2.2%. Adelaide experienced the largest monthly growth of 1.7%, followed by Brisbane and Perth with 1.3% each. Sydney, Melbourne, Canberra and Darwin all experienced growth with 1%, 0.3%, 0.2% and 0.1% respectively, whilst Hobart was the only capital city to fall in September with -0.6%. Quarterly data is similar, again with Adelaide leading the way (4.3%), closely followed by Brisbane (3.9%), Perth (3.6%) and Sydney (2.5%). Melbourne and Darwin both increased 1.3% for the quarter, with Canberra at 0.4%. Again, Hobart is the only capital to not experience growth, falling by 0.2% for the quarter. Whilst many economists predicted a softening in property prices in the later stages of 2023, dwelling values have remained strong. As we head into the spring and summer selling season, we may see supply increase slightly but the market remains extremely tight. Clearance Rates & Auctions Week of the 3rd of October 2023
Property Values as of 2nd of October 2023
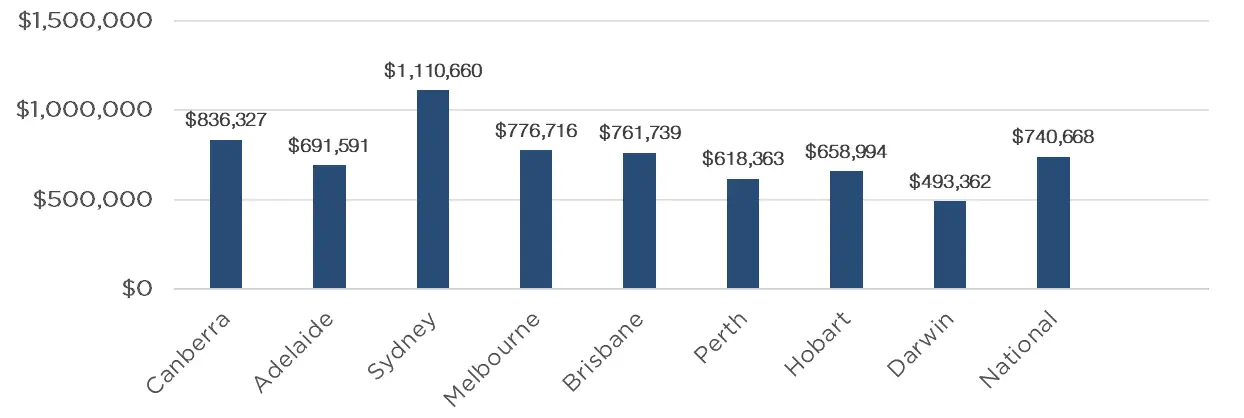
Median Dwelling Values as of 2nd of October 2023
|


23 Oct 2023 - Performance Report: 4D Global Infrastructure Fund (Unhedged)
[Current Manager Report if available]