
NEWS

Performance Report: Kardinia Long Short Fund
The Kardinia Long Short Fund rose by +9.54% in December, outperforming the ASX 200 Total Return benchmark by +2.28%. Since inception in May 2006, the fund has returned +7.47% per annum, an outperformance of +0.93% relative to the benchmark...
Read more...

10k Words | January 2024
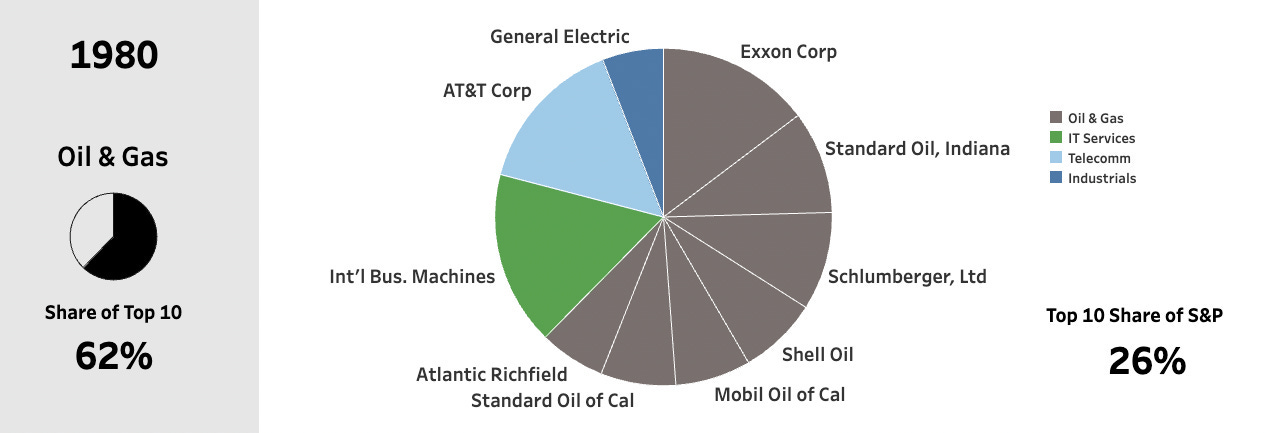
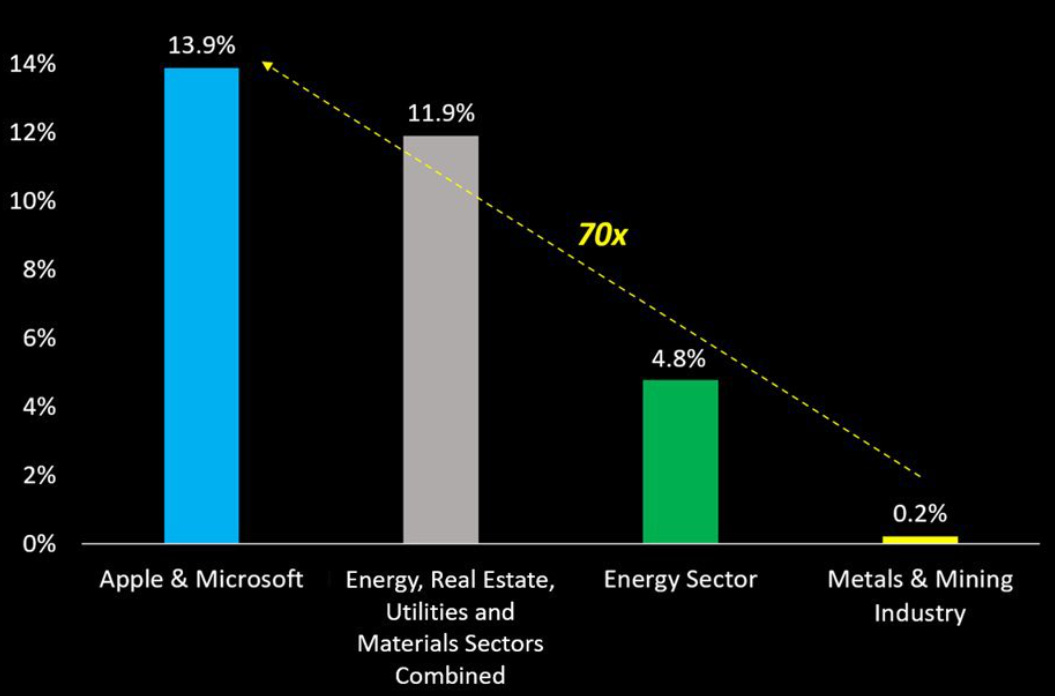
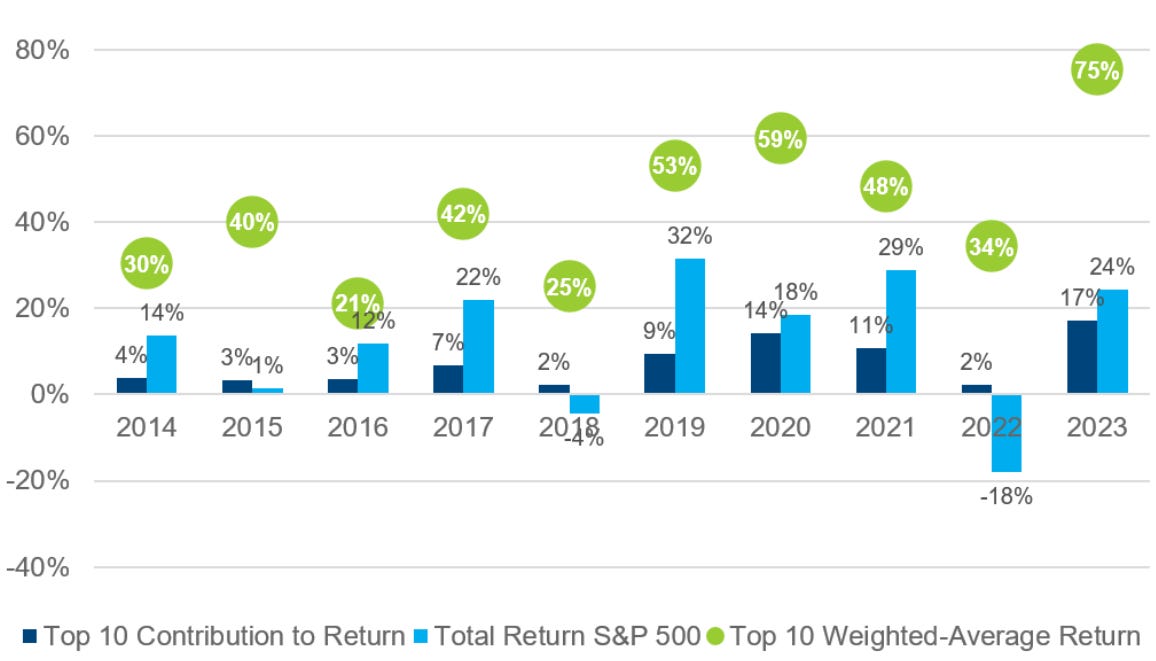
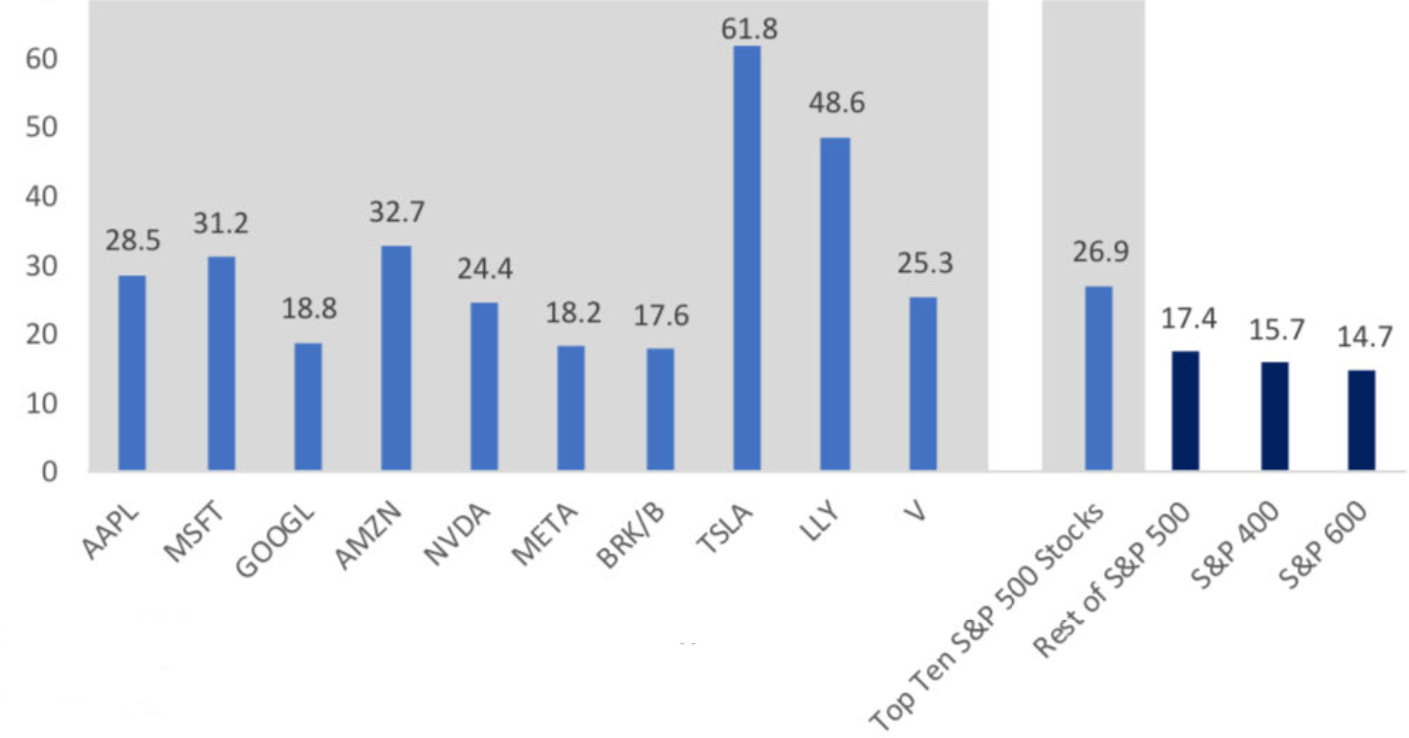
Will Australian consumers join the upswing in sentiment in 2024? What happened to the heavyweights of the S&P 500 from the 1980s? Let's take a look at what is happening with the skewed weightings and returns in that index today.
Read more...


Performance Report: Digital Asset Fund (Digital Opportunities Class)
The Digital Asset Fund (Digital Opportunities Class) rose by +1.16% in December. Since inception in May 2021, the fund has returned +22.25% per annum, an outperformance of +34.8% relative to the S&P Cryptocurrency Broad Digital Market...
Read more...

Performance Report: Collins St Value Fund
The Collins St Value Fund rose by +11.73% in December, outperforming the ASX 200 Total Return benchmark by +4.47%. Since inception in February 2016, the fund has returned +14.7% per annum, an outperformance of +4.9% relative to the...
Read more...

New Funds on Fundmonitors.com
Here are some of the latest additions to our database. Follow the links to view each fund's profile, where you'll have access to their offer documents, monthly reports, historical returns, performance analytics, rankings, research,...
Read more...


Hedge Clippings | 19 January 2024
Happy New Year, and Welcome Back to Hedge Clippings' weekly update of news covering the world of actively managed funds, along with the regular review or comment on what we think is happening in the world, be it the economy, politics, or...
Read more...

Performance Report: Bennelong Concentrated Australian Equities Fund
The Bennelong Concentrated Australian Equities Fund rose by +9.35% in December, outperforming the ASX 200 Total Return benchmark by +2.09%. Since inception in February 2009, the fund has returned +13.41% per annum, an outperformance of...
Read more...

Performance Report: Delft Partners Global High Conviction Strategy
The Delft Partners Global High Conviction Strategy rose by +1.62% in December, outperforming the All Countries World (AUD) benchmark by +0.25%. Since inception in August 2011, the strategy has returned +14.19% per annum, an outperformance...
Read more...

Trip Insights: The US
This is the 14th in our series of Trip Insights, where we share our travel experiences. It follows Peter Aquilina, Senior Investment Analyst and Head of ESG, as he travels through New York, Houston, Tulsa, and Arizona, meeting with...
Read more...

Performance Report: Airlie Australian Share Fund
The Airlie Australian Share Fund rose by +7.46% in December. Since inception in June 2018, the fund has returned +10.85% per annum, an outperformance of +2.44% relative to the ASX 200 Total Return benchmark which has returned +8.41% on an...
Read more...