
NEWS

1 Mar 2024 - Hedge Clippings | 08 March 2024
|
|
|
|
Hedge Clippings | 08 March 2024 This week saw a slew of Australian economic data released, including Housing, Labour and Employment numbers, and National Accounts. News & Insights New Funds on FundMonitors.com Social and Regulatory Risks of AI | Magellan Asset Management February 2024 Performance News |
|
|
If you'd like to receive Hedge Clippings direct to your inbox each Friday |
1 Mar 2024 - Hedge Clippings | 01 March 2024
|
|
|
|
Hedge Clippings | 01 March 2024 This week's inflation figures were encouraging, but unlikely to prompt the RBA to change their approach at their next board meeting. Annual inflation stayed steady at 3.4% in the 12 months to January, well down from the peak of 8.2% in December 2022, while the number for underlying inflation, excluding volatile items, dropped fractionally to 4.1%, also well down from its December 2022 peak of 7.2%. We have long held the view that getting inflation down the "last part" to the RBA's target of 2.5% will be the most difficult, and the RBA has been consistent in its guidance that they won't be rushed into cutting rates too soon - at least not until they are convinced the battle has been well and truly won. So while there will be calls from some quarters for a cut sooner rather than later, the RBA is more likely to reverse that, (i.e. later rather than sooner) particularly as the Wage Price Index (WPI) for the December quarter came in at 4.2% - indicating that wages rose faster than inflation. Until the RBA sees the unemployment rate, currently 4.1%, nudge higher they're not going to feel comfortable cutting rates and sending a signal that the inflationary problem is over - even if the actual inflationary cycle has turned. Normally we'd be waiting until the RBA's meeting next Tuesday, but under the board's new structure the normal first Tuesday of the month meeting is now postponed to 18-19th of March, by which time the ABS will have released a slew of data to keep economists busy, with next week seeing National Accounts (including GDP) on Wednesday, and of particular interest to Hedge Clippings, the statistics on the Managed Funds sector due on Thursday. Elsewhere next week our attention will be piqued by Super Tuesday in the USA, when 16 states vote for their preferred Republican and Democratic candidates. Both Joe Biden and Donald Trump would appear to be a shoe-in for their respective party's nominations, with Nikki Haley hanging in there in the hope of a Steven Bradbury like finish if Trump can't overcome his multiple issues with various court cases, and Joe Biden just hoping to hang in there, full stop, or as they say in the USA, period! Both Biden's and Trump's greatest hope for a clear - if not clean - result in November, would seem to be the other's failings. News & Insights New Funds on FundMonitors.com Market Update | Australian Secure Capital Fund Global Matters: Gridlock - the vital role of Australia's transmission infrastructure | 4D Infrastructure January 2024 Performance News Emit Capital Climate Finance Equity Fund Argonaut Natural Resources Fund |
|
|
If you'd like to receive Hedge Clippings direct to your inbox each Friday |

1 Mar 2024 - Performance Report: PURE Income & Growth Fund
[Current Manager Report if available]

1 Mar 2024 - Looking through the headline noise
|
Looking through the headline noise Ox Capital (Fidante Partners) February 2024 Reality vs. sentimentWe are seeing a clear dislocation between reality and stock market sentiment. Contrary to news headlines of a lacklustre macro-economic environment and outlook, quality companies continue to execute and grow earnings. The overall economy is resilient and showing pockets of strength. Headwinds to the property market are manageable and well understood. Our base case is the Chinese economy will grow this year (4.5% to low 5% range) and we continue to expect the Chinese authorities to provide support for the economy to restore confidence. After sharp pullbacks in Chinese equities, the authorities are intervening, introducing various measures to support the stock market. It's important to look through the noise. Return of the flow. Daily volumes of on shore ETFs have spiked. This is important, as the National Team (China's Sovereign Fund) has proactively intervened with direct purchase of equities/ETFs to support the market. The Sovereign fund also vows to further increase ETF holdings to support the market as needed. This reminds us of when the Hong Kong government stepped in during the Asian Crisis to support the market and uphold stability. 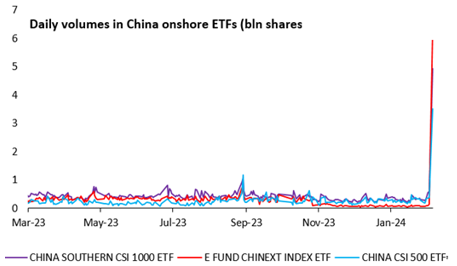
Recurring headlines are somewhat old news. Despite recent headlines, the Chinese property downturn is in fact quite advanced. This is a well-known fact as sales are down over 40% since peak. Developer loans exposure to the baking system is low (less than 6%). Distressed developers have defaulted, while contagion to the trust industry is low and very manageable. The news of property developer Evergrande's inevitable collapse was well known despite recent articles highlighting its demise. Again, it's important to look through the noise. The government extending support for local developers (both private and state owned) through banks with measures to improve developers' liquidity will further improve confidence. Moreover, China's real estate investment relative to GDP remains one of the lowest relative to other major economies while sales are approaching sustainable levels after years of declines. Finally, the government continues to show willingness to provide support by easing policy further. The PSL (China's version of QE) grew in December and January to fund urban village redevelopment and social housing. In addition, the PBoC recently lowered the deposit reserve ratio requirements of financial institutions by 0.5%, in-line with prior guidance of further monetary policy easing. As such, the reduction in reserve requirements will provide liquidity, benefiting the real estate market and economy overall, supporting consumer confidence even further. We do acknowledge however, the stimulus measures all up (including urban redevelopment, lower mortgage rates, ect..) will take time to fully restore confidence and strengthen the economic outlook. 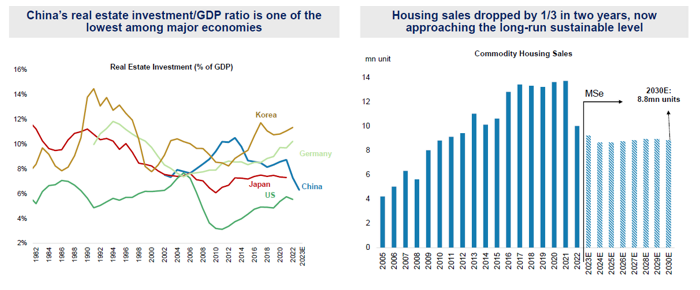
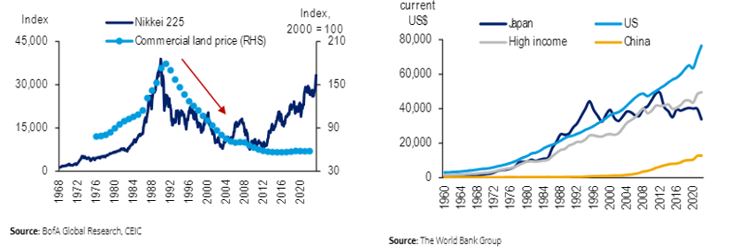
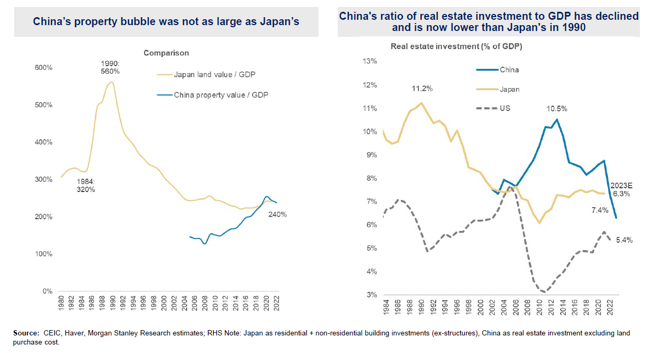
China is not Japan's "Lost Decade": There have been a recent uptick in headlines and concerns that China's outlook is similar to Japan in the 1990s when there was a period of economic stagnation and a significant slow-down in economic activity and the asset bubble eventually collapsed. Notable differences:
  Right now, valuations for Chinese equities are at depressed levels, and at a time when government authorities are dedicated to restoring confidence and reinvigorating the economy. Quality businesses will continue to grow and become champion businesses in coming years. Now is the time to invest and take advantage of the very attractive valuations. As we have stated previously, it is important to consider the multiple catalysts and act now given 1) valuations are extremely cheap, 2) property market is stabilising, 3) China QE "PSL" is supporting the economy (and restoring confidence) at this juncture, 4) Chinese capital replacing international flows in Hong Kong equities market, 5) National Team providing stability, and 6) geopolitical stabilisation. Funds operated by this manager: |

29 Feb 2024 - Performance Report: Equitable Investors Dragonfly Fund
[Current Manager Report if available]
29 Feb 2024 - Performance Report: PURE Resources Fund
[Current Manager Report if available]

29 Feb 2024 - Just Eat the Marshmallow: Why Wait When Value Is Already on the Table?
|
Just Eat the Marshmallow: Why Wait When Value Is Already on the Table? Redwheel January 2024 |
|
Ah, January. Just the word sends shivers of excitement down the spines of gym proprietors across the world, salivating at the prospect of new year's resolutioners confidently paying for a full year's membership, only to slink away sometime in March. Yes, it is the season for attempting to better oneself, and crucial to that effort is self-control and discipline: being able to say no to that sweet treat, and dragging yourself out of bed for that early morning run. Self-control's influence on success has been a topic of extensive study, one of the most famous involving four-year-olds, and marshmallows. In the experiment [1], Walter Mischel, a psychology professor at Stanford University, placed a single marshmallow on a table in front of several hundred children (one at a time, mind you). He would then leave the room for a few minutes, and if, by the time he came back, the child had resisted the urge to eat the marshmallow, they would earn a second marshmallow. Fun as though this experiment must have been - at least for the children - the most interesting results came years later, when the researchers followed up with the now-grown subjects of their study. There was a strong correlation between the length of time that a child was able to resist eating the marshmallow - taken as a proxy for self-control - and their academic test results, weight, life satisfaction, mental health, and earnings. The longer the wait, the better the outcome. While some dispute the efficacy of this study, the general principle of self-control as a route to success in life is hardly controversial. When it comes to investing, however, we would caution against the alluring promise of additional sweets and advise instead: just eat the marshmallow. And here is where the key difference between the experimental bonus marshmallow and corporate earnings comes in: waiting for the extra marshmallow may be a good use of self-control when it is promised by a psychologist in a white coat, because you know that it is coming; the same, alas, is not necessarily true with companies. Why wait and rely on hopes that high future growth materialises when you can invest in companies already trading at more reasonable valuations? As value investors, we look to buy companies at a significant discount to intrinsic value, or the true worth of a business, based on a conservative assessment of its earnings power over time, and the money that will need to be reinvested to sustain that earnings power. A key part of that process is in trying to figure out what the business can earn realistically, and not getting too absorbed in expectations for sky-high earnings growth. Helpfully, earnings tend to be tied to a number of things, including the assets that the business can utilise and, importantly, what the business has previously demonstrated that it can earn. After all, paying a reasonable price for established earnings doesn't require great feats of corporate athleticism to turn into a good result for investors. By contrast, when you pay a large price relative to the historic earnings power, you are baking in assumptions of good-to-exceptional growth; figuring out ahead of time which companies are going to deliver that growth, and which will disappoint, is an almost impossible task. Paying for that growth upfront leaves no room for error: you likely won't beat the market by being right most of the time if you are betting on the outcomes as certain. Consider a company priced at 50x its most recent earnings [2]. To justify that price, we need to distil into a single value all the future earnings of the business: the way that this is done is typically by taking a nearer-term picture of income, say, over the next ten years, and then adding on a "terminal value", the net worth of the business after that forecast - a sum intended to reflect long-run value. These figures are then expressed as a present value - namely, what the sum of the cashflows is worth today - and that present value is the price at which investors buy and sell companies in the market. To justify a price of 50x current earnings, investors would have to assume that earnings per share grow at 15% each year for the next ten years - a herculean feat - and assume a longer-term growth rate of about 3.0%. Even then, with such staggering success, the price can still only be justified by utilising a required rate of return of 8.0%, which some may see as insufficiently low for the associated risk [3]. Finally, even after generating such incredible earnings growth for ten years, paying 50x today's earnings means that today's present value is still mostly made up of the "terminal value", which represents a whopping 73% of the current asking price:
Source: Redwheel. The information shown above is for illustrative purposes. To pay such a price, therefore, investors need to feel certain of the future, certain that by ignoring more reasonably priced companies today - the lonely single marshmallow presented at the start of our experiment - they are going to be rewarded with phenomenal growth for a very long time into the future, and earn themselves an extra marshmallow. Assuming such extreme growth for such a long time makes value investors like us nervous. If we don't make any heroic assumptions [4], and pay a much lower price relative to current earnings, the reliance of our current business value on the outcome of the long-term future falls fast, with the "terminal value" comprising only 30% of today's price, if we pay only 9x current earnings. That means that if both our theoretical companies announced that they were going to cease to exist in ten years, our investment would retain 70% of its value, compared with the higher-priced company, which would be worth only 27% of the price paid.
Source: Redwheel. The information shown above is for illustrative purposes. We make this point to underscore the importance of thinking carefully about the expectations - explicit or implicit - that are built into market prices for businesses, and the chances of those expectations paying off. Unlike in a lab, in the real economy it is, in our opinion, foolish to assume that more marshmallows will always be forthcoming, and we believe investors should think carefully before turning one down today. So next time you hear analysts confidently predicting that Company X or Y is going to make $25 per share of earnings in 10 years' time, and $250 in 20 years' time - ask them to take out their wallets and bet on it. We, on the other hand, would gladly tell you that we cannot precisely predict what earnings will be in 10- or 20-years' time, and we don't need to - because we haven't paid much for them in advance, preferring to base our view of sustainable earnings power on the demonstrated historical earnings capabilities of an enterprise. While many are trying to predict the future, we are simply trying to put the present in the context of the past. In the investment world, we find simply eating the marshmallow in front of us requires the most self-control - and can often make the most sense. Author: Shaul Rosten |
|
Funds operated by this manager: Redwheel China Equity Fund, Redwheel Global Emerging Markets Fund |
|
Sources: [1] Mischel W, Ebbesen EB, Zeiss AR. Cognitive and attentional mechanisms in delay of gratification. J Pers Soc Psychol. 1972 Feb;21(2):204-18. doi: 10.1037/h0032198. PMID: 5010404. (https://pubmed.ncbi.nlm.nih.gov/5010404/) [2]We can think of a few culprits, who shall remain nameless; one rhymes with Badobe [3] I would be one of those people [4] In this case, 2.5% annualised per share earnings growth, a 2.0% perpetual growth rate, and a 15.0% discount rate Key Information |


28 Feb 2024 - Performance Report: Argonaut Natural Resources Fund
[Current Manager Report if available]

28 Feb 2024 - Global Matters: Gridlock - the vital role of Australia's transmission infrastructure

27 Feb 2024 - Performance Report: Emit Capital Climate Finance Equity Fund
[Current Manager Report if available]