NEWS

20 Feb 2023 - Performance Report: Bennelong Twenty20 Australian Equities Fund
[Current Manager Report if available]

20 Feb 2023 - Australian Secure Capital Fund - Market Update
|
Australian Secure Capital Fund - Market Update January Australian Secure Capital Fund February 2023 January saw property prices fall nationally by 1%, which was less than December and the smallest month to month decline since mid last year according to CoreLogic's national Home Value Index. Prices fell across all capitals by an average of 1.1%, however regional housing values continued to record a milder rate of decline at -0.8%. Hobart saw the largest reduction (-1.7%), followed by Brisbane (-1.4%), Sydney (-1.2%), Melbourne (-1.1%), Canberra (-1.0%), Adelaide (-0.8%) while the falls in Perth and Darwin were less significant at (-0.3%) and (-0.1%) respectively. The quarterly trend however is pointing to a reduction of the in the pace of decline, and despite the falls every capital city and region is still recording home values above pre-pandemic levels. Contributing to the reduction of dwelling values, is the fall in demand. Capital city dwelling sales were down -29.4% on previous year figures, with listings -22.2% below the same time last year meaning that most home owners who are considering selling are sitting things out with no pressure to sell into this market. Weekly auction activity has begun to increase in 2023, with 706 auctions taking place across capital cities last weekend achieving a 67.9% clearance rate which we consider positive. Melbourne recorded the most auctions with 259 auctions taking place at a clearance rate of 68.3% (67.5% last year), followed by Sydney with 202 auctions and a strong clearance rate of 71.6% (66.3% last year). Adelaide achieved the best clearance rate for the weekend with 76.8% (81.8% last year) for their 105 auctions whilst Brisbane and Canberra were lower with clearance rates of 59.6% (80.1% last year) and 52.2% (85.5% last year) respectively. Whilst property prices will undoubtedly be linked to the movement in interest rates we do believe we are nearing the end of the rate rise cycle, with some banks already beginning to reduce the fixed rates for 3 and 5 year terms. The resurgence in overseas student migration will also see the rental market remain tight and help support yields across the residential property market. As a result we do believe housing values will stabilise over the coming months as some level of confidence returns to the market.
Funds operated by this manager: ASCF High Yield Fund, ASCF Premium Capital Fund, ASCF Select Income Fund Source: Australian Financial Review
|
||||||||||||||||||||||

17 Feb 2023 - Hedge Clippings |17 February 2023
|
|
|
|
Hedge Clippings | 17 February 2023 This week Hedge Clippings thought we'd give inflation, interest rates, and RBA Governor bashing a rest. After all, it's been front page news for a couple of weeks (or should that be months) and culminated in Philip Lowe appearing before a Senate Committee grilling today for the second time this week. For the record, he's sticking to the script that inflation is the number one problem, that unemployment could reach 8.5% if it wasn't fixed, and the only way to fix it is to keep on raising rates even at the risk of recession. He acknowledged, as we suggested last week, that increased interest rates hurt the vulnerable most, and the impact "is being felt very unevenly across the community". Being in the sights of politicians asking some plainly uneducated questions (surprise, surprise), he did have a dig back, saying that he could make decisions that politicians couldn't, or wouldn't, with this comment: "It's hard for the political class to take the short-term decisions to manage the cycle." Ouch! Moving right along... If ever there was a year to reinforce the twin benefits of diversification, and taking a long-term view when investing in managed funds, 2022 would be it. Surprisingly, given the well publicised, painful, and costly examples of ignoring each, (or both) they're two of the standout lessons from an analysis of 2022 fund performances. Against a backdrop where few anticipated the sudden outbreak of inflation, or the speed and extent of central banks' reaction, overall the market had a shocker. The 12 month returns of 16 Peer Groups to December 2022 shows that only Debt (+5.11%) and Hybrid Credit (+4.20%), and to a lesser degree Infrastructure (+0.94%) provided investors any comfort. Equity funds, particularly Small/Mid Cap, both in Australia and globally, bore the brunt at -19.34% and -23.31% respectively. On a relative basis, Australian Small/Mid Cap funds underperformed their overseas peers with the average fund (-19.34%) underperforming the broader ASX200 T/R index (-1.08%) by over 18%. By comparison, while Global Small/Mid Cap funds averaged a negative return of -23.31%, this was "only" 5% below the S&P500 total return of -18.11%. While one can therefore argue that small caps weren't the place to be in 2022, taking a longer view - as recommended in every offer document for a managed fund we've ever seen - provides a more balanced view. In the three prior years, 2019-2021, Australian Small/Mid Cap funds returned 27%, 18%, and 21% p.a. respectively, and over the prior 10 years this group had only one negative year (-6.5% in 2018) and no less than six years of +20% returns. Taking it back even further to 1995, this Peer Group has returned an average of over 15% p.a. with an up capture ratio of 137% (in other words, 37% above the market's return when it is positive) and a down capture ratio of 95% (showing when the market falls, they fall almost as much). For the record, not all small/mid cap managers suffered as badly, but consistency across the cycle is difficult. Over 3 and 5 years only two - Anacacia Wattle Fund (+16.79% and 16.73%) and Glenmore Australian Equities (+16.37% and 17.42%) beat the long-term (25 year) peer group average of 15% and outperformed the ASX200 in 2022. And while some investors in Small/Mid Cap funds may be nursing losses in FY2022 (average -17.58%) that had reversed by FY January 2023 to +12.18% since July last year. There lies Lesson #1: Investing in managed funds requires a long term view. Lesson #2: Diversification, and distribution of funds' and indices' returns. Diversification is a two edged sword: Over diversification can flatten performance. Concentration - such as investing in a single fund or product - can lead to significant under-performance. While still on the small mid cap peer group - although this runs true across the board - the spread of performance is significant, particularly in market sell-offs. 2022 saw small/mid cap managers' performance range from +3.53% through to -43%. The dilemma, for investors and advisors alike, is how much to diversify, and how to avoid long-term underperformers, or worse still, the likes of Mayfair 101. |
|
|
News & Insights 10k Words | Equitable Investors Magellan Global Strategy Update | Magellan Asset Management January 2023 Performance News Argonaut Natural Resources Fund Bennelong Concentrated Australian Equities Fund Quay Global Real Estate Fund (Unhedged) Skerryvore Global Emerging Markets All-Cap Equity Fund |
|
|
If you'd like to receive Hedge Clippings direct to your inbox each Friday
|

17 Feb 2023 - Performance Report: Cyan C3G Fund
[Current Manager Report if available]

17 Feb 2023 - Performance Report: Bennelong Long Short Equity Fund
[Current Manager Report if available]

17 Feb 2023 - Battleground ESG issues for 2023
|
Battleground ESG issues for 2023 Yarra Capital Management January 2023
As we look forward to the year ahead, we have been reflecting on where we are likely to see the most prominent sustainability issues (sometimes called 'ESG' or environmental, social and governance issues) surface for companies in the year ahead. Our predictions include continuing to see the big issues, such as climate change, remain centre stage but shift from a conversation about disclosures and targets to issues of quality and substance. Alongside climate, we will see companies scrambling to make sense of an expanding environmental mandate to include understanding their implications on nature and biodiversity more broadly. We see a big year ahead for social topics, including industrial relations and labour rights, as well as a resurgence of issues pertaining to social license to operate. And, as ever, good governance will continue to be a key driver of value, particularly with the continuing rise of cybersecurity issues and companies having to navigate an increasingly complex landscape of material issues. Our predictions for the big battleground ESG issues for the year ahead are: Environment1. Climate change issues are evolving towards quality:
2. Nature, food and water security and biodiversity will be the newest everywhere topic:
Social3. Industrial relations and labour rights and conditions will become increasingly material:
4. Social license to operate makes a 'comeback':
Governance5. Data security and privacy evolves to include issues of data sovereignty:
6. The 'G' factor will drive corporate responses to an evolving landscape of material issues:
Beyond the E, S, and GBeyond the individual issues surfacing under the E, S, and G banners, we also see trends toward positive investment opportunities, including: 7. Scale will be the focus for the new wave of purpose driven capital:
8. Sustainability, ESG and Impact are no longer distinct approaches to investing:
Author: Dr Erin Kuo, Yarra's Chief Sustainability Officer |
|
Funds operated by this manager: Yarra Australian Equities Fund, Yarra Emerging Leaders Fund, Yarra Enhanced Income Fund, Yarra Income Plus Fund |

16 Feb 2023 - Performance Report: Bennelong Kardinia Absolute Return Fund
[Current Manager Report if available]

16 Feb 2023 - The path to clean, secure and affordable energy
|
The path to clean, secure and affordable energy Nikko Asset Management January 2023
The changing seasons are nature's way of reminding us that time moves on. And it is the same in the Russell household, where my youngest is approaching 18 and his late weekend nights are his way of telling me change is arriving in our home too. There is a dawning that I am heading into a new stage of life. It is exciting, but after 20 years of bringing up a family, I also admit to being a little scared of what the next chapter will bring. In markets we often get obsessed with short-term changes but it can be the slow structural moves—such as a child leaving the home—which can have a more profound longer-term impact. Bear markets exist for a purpose. They expose the heavy misallocation of capital that in this bear market happened because finance was too easy. While capital is now more rationed, energy too can no longer be taken for granted. Of course management teams of energy companies have been aware of this for some time, as they have witnessed their own cost of capital rise as the shale revolution unwound and climate change took hold. In bear markets time horizons are compressed and dreams are often shelved as rising costs force management teams to make difficult choices. These choices impact different stakeholders, often over different time horizons, which explains why companies adopting a stakeholder approach with purpose could be better equipped to navigate their way through difficult times and eventually, when the next bull market begins, may be better placed to solve the significant challenges facing society over the coming decades. Choice One: Energy affordability versus long-term energy transitionEnergy markets and policies have changed as a result of Russia's invasion of Ukraine, not just for the time being, but likely for decades to come. The environmental case for clean energy needed no reinforcement, but the economic arguments in favour of cost-competitive and affordable clean technologies are now stronger—and so too is the energy security case. But solving for clean, secure and affordable energy is not straight forward. Energy is an input to making substantively everything in the modern world. So when we have shortages—as we do now—the rising costs of everything acts like a tax on consumption. Primary energy costs at the start of the last century were about 4% of the global GDP. Today, primary energy accounts for about 12% of total GDP, which is similar to that achieved in the two oil shocks in the 1970s.1 Direct energy makes up about 45% of European inflation (Chart 1). However, we also know that 10%-15% of all primary energy goes into making food for the world's population—which adds to the inflationary pressure. If other associated links to energy are added, we can estimate that approximately 75%2 of inflation is driven directly and indirectly by energy costs. Our current energy crisis is a core element of today's inflation and until we solve energy's supply problems, we expect inflation to remain stubbornly above most central banks' 2% targets. Chart 1: Headline inflation rate with component contributions - Eurozone
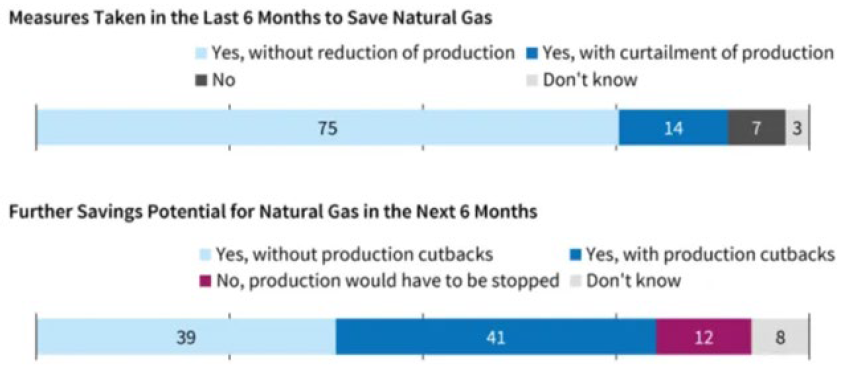
Source: Aurora Energy Research, GOV.UK, Eurostat, U.S. Bureau of Labor Statistics, MarketWatch Today, for every US dollar (USD) spent globally on fossil fuels, USD 1.5 is spent on clean energy technologies. But by 2030, under the net-zero emissions by 2050 scenario, every dollar spent on fossil fuels will be outmatched by USD 5 on clean energy supply and another USD 4 on efficiency and end-uses.3 If clean energy investment does not accelerate, higher investment in oil and gas will be needed to avoid further fuel price volatility, while also putting the 1.5 degrees Celsius goal in jeopardy. But if we accelerate clean energy today at the expense of fossil fuels, we will only exacerbate our energy shortages, given the short-term draw on valuable energy sources made by solar and wind. These are long-term versus short-term choices that even the experts have difficulty reconciling (Exhibit 1): Exhibit 1: IEA illustrates the challenge between short-term affordability and long-term energy transitionInternational Energy Agency (IEA) executive director Fatih Birol: "If governments are serious about the climate crisis, there can be no new investments in oil, gas and coal, from now - from this year". ("No new oil, gas or coal development if world is to reach net zero by 2050, says world energy body", The Guardian, 18 May 2021) IEA's 2022 outlook: "Ahuge increase inenergy investmentis essentialto reducethe risksoffutureprice spikes and volatility, and to get on track for net zero emissions by 2050… an average of almost USD 650 billion per year 'will be' spent on upstream oil and natural gas investment to 2030, a rise of more than 50% compared with recent years". (IEA "World Energy Outlook 2022", November 2022) The most suitable near-term solutions include projects with short lead times that bring oil and gas to market quickly, but also includes areas such as capturing some of the 260 billion cubic metres of gas that is wasted each year through flaring and methane leaks4 to the atmosphere—a key driver of our investment in Emerson. Reference to individual stocks is for illustration purpose only and does not guarantee their continued inclusion in the strategy's portfolio, nor constitute a recommendation to buy or sell. 1Thunder Said Energy, "Energy Shortage: fear in a handful of dust?", November 2022 Demand efficiency and productivity could also be key and in this field, there has been significant progress. A recent German IFO survey suggested that most companies—in this case 75% of those that use gas as a primary energy source in their production—have found ways to reduce gas usage in the last six months while still meeting production targets (Chart 2). Chart 2: Reduction of natural gas consumption in the production process (%)
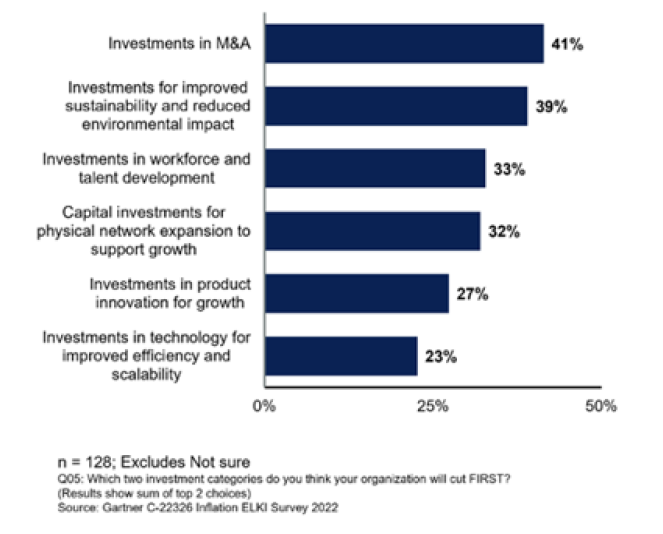
Source: IFO Business survey, October 2022 In fact energy efficiency is the number one place to look for solutions to this energy crisis. While energy costs soar, CEOs are expected to look at ways to make their businesses more resilient and reduce their energy burden. Paybacks on energy efficient investments will be very high, in our view, and are unlikely to be shelved if and when a recession starts. We see this providing tailwinds for long-term holding companies such as Schneider and opportunities within the energy services companies, where cash flow returns could accelerate to double-digit levels. This is certainly a significant part of the reason for our more recent investments in Worley & Schlumberger Choice two: ESG recession versus stakeholder capitalismRecent market history suggests that commodity prices will correct with a recession and if central banks have their way, a recession is exactly what we may get. Our own experience tells us that we should prepare for where the cuts might be. Some are obvious—such as advertising and marketing. These cuts have already started as can be seen by the demise of Google or Meta. For many others their earnings recession is just starting. Corporates are also expected to cut capital projects and the following June 2022 Gartner poll provides some insight into where these might be (Chart 3). The results are not surprising—but significant reductions in investment for improved sustainability and environmental impact is worth raising. Chart 3: Investment categories to be cut first—surveys
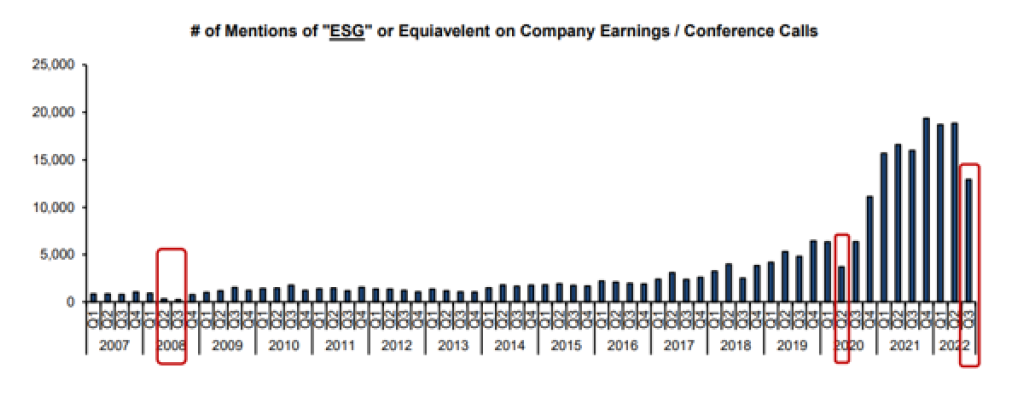
Source: Gartner, July 2022 Reference to individual stocks is for illustration purpose only and does not guarantee their continued inclusion in the strategy's portfolio, nor constitute a recommendation to buy or sell. While corporates may sharpen the knife on sustainability, what is surprising to many is the backbone behind policy changes in Europe and the US (among others) which instead of accelerating fossil energy supply, are expanding incentives and targets for alternatives, such as wind, solar and hydrogen. The REPowerEU Plan was launched by the European Commission earlier in 2022 to reduce the European Union's (EU) dependence on Russian fossil fuels in a direct response to the Ukraine invasion. The plan calls for the EU to consume 20 million tonnes (mT) of hydrogen by 2030, instead of the 5mT target previously quoted in the Fit For 55 policy announced just a few months before, as an example. If we feared a clash between decarbonisation and short-term energy needs, decarbonisation seems to remain society's number one target. The bull market for ESG data and integration has been stratospheric. Changing demographics, rising inequality, the rise in the importance of externalities such as nature and increased influence of the state through regulation all have a part to play. But as was the case in prior recessions, we should expect ESG to be less of a focus for management teams as they divert their attention to short-term challenges or for some simply staying afloat (Chart 4). In our view, expensive virtue signalling does not perform well during recessions (e.g. Tesla). Chart 4: Long-term bull market for ESG—with a few blips
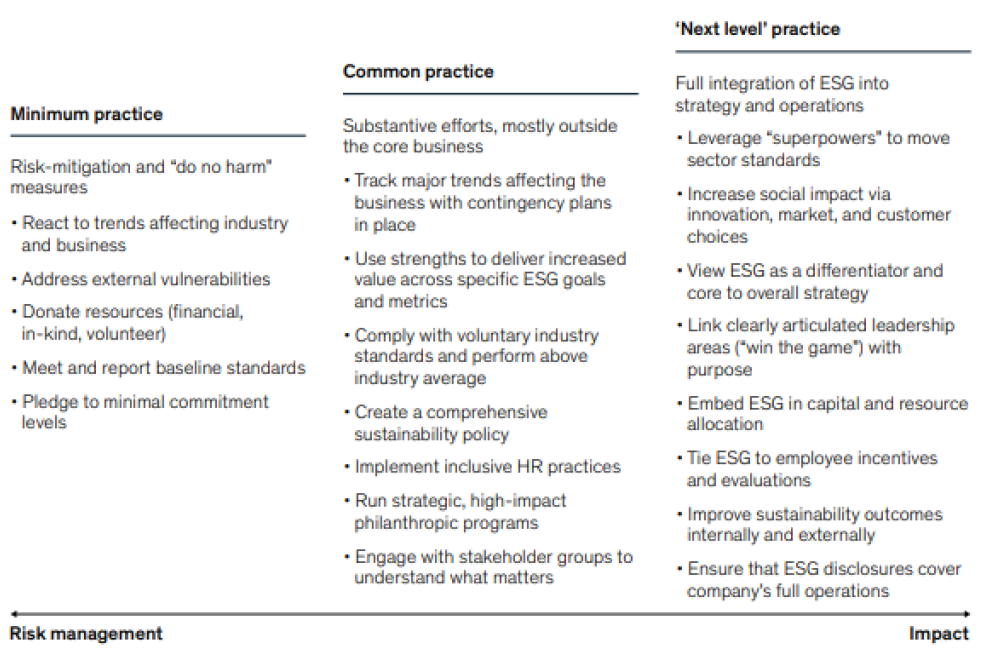
Source: Bernstein research and Bloomberg, October 2022 In terms of energy shortages, we may play out the 1970s again. We also appear to have returned to that decade to question the role of shareholder primacy, with both business leaders and politicians (e.g. business round tables and the Davos Manifesto), suggesting we are on the verge of a fundamental reshaping of society. This slow, structural change is of course not new and ESG is a key cog if stakeholder capitalism is to work. Given the shift to stakeholder capitalism is such an ideological shift, it shouldn't surprise anyone that we are now seeing an ESG backlash, the most vigorous of which is targeted at greenwashing. Survey evidence around sustainability suggests trust is low. For example, three out of four institutional investors do not trust companies to achieve their sustainability targets and commitments.5 And of course, the measurement of ESG data is fraught with difficulty; while credit ratings correlate 99%, the correlation of external ESG ratings ranges between 38% and 71%.6 For some, ESG is leading to a significant misallocation of capital and is morally bankrupt. 7 8The situation has prompted some regulators, such those in the predominantly Republican US states, to try and alter the direction of travel and ban ESG investing altogether. Yet, many companies today are making major decisions, such as discontinuing operations in Russia and protecting employees in at-risk countries. They also continue to commit to science-based targets and to define and execute plans for realising these commitments. This indicates that ESG considerations are becoming more—not less— important in companies' long term decision making. In fact, at Nikko Asset Management we believe companies should adopt a stakeholder approach. Companies must approach externalities as a core strategic challenge, not only to help future-proof their organisations but to deliver meaningful impact over the long term. Some companies that have already built purpose into their business models and are demonstrating they benefit multiple stakeholders are already showing success, such as Microsoft or lesser known companies, such as Compass Group. Reference to individual stocks is for illustration purpose only and does not guarantee their continued inclusion in the strategy's portfolio, nor constitute a recommendation to buy or sell. 5Edelman, "2021 Trust Barometer Special report: Institutional investors", November 2021 In recent years, boards of directors have become increasingly focused on corporate purpose. This is partly driven by a sense that purpose drives corporate culture, helps attract and retain talent and is increasingly a differentiator when it comes to customers and suppliers. External pressure on corporate boards to define purpose better has come from investors, who are themselves being asked to justify their own investments on the basis of ESG as well as financial considerations. A single, clearly marked path that every business should follow does not exist. Strong corporate leaders recognise that social expectations constantly evolve and we believe that it is the company's purpose that guides management, fund managers and owners through difficult times. A recent Mckinsey study developed a framework for summarising key ESG approaches. This highlights characteristics of those at the forefront of stakeholder capitalism, fully integrating ESG into strategy and operations—listed as "Next Level Practices". Companies adopting stakeholder capitalism are seen to be enhancing their company's competitive positioning. They have purpose and can articulate why stakeholder capitalism is creating a competitive edge (Exhibit 2). Exhibit 2: Corporate approach to ESG and stakeholder capitalism
Source: "How to Make ESG Real", McKinsey, August 2022 They are a more attractive place to work for their employees—retention rates are higher than peers—successfully fighting the war for talent, while some are discovering new solutions needed to solve many of our current problems, such as climate change. We can already see success in many of our own holdings—such as Danaher, Sony or John Deere to name a few. These companies are creating their very own superpowers, enhancing their franchise and management qualities and creating value (Exhibit 3). Exhibit 3: Examples of Future Quality purpose statement "Helping realize life's potential" (Danaher) "Fill the world with emotion, through the power of creativity and technology". (Sony) "We must act with urgency today to make the lives of our customers, workforce, and all those we serve better tomorrow". (John Deere) Reference to individual stocks is for illustration purpose only and does not guarantee their continued inclusion in the strategy's portfolio, nor constitute a recommendation to buy or sell. Our own experience is supported by academic research. Work by Ariel Babcock et al. titled "Walking the Talk: Valuing a multi-stakeholder strategy" links the importance of stakeholders and stronger operating performance across a number of metrics.9 These management teams are committed, empathetic and demonstrate with full and transparent disclosure of data that they are on a journey of continuous improvement. They invest with a long term investment horizon and are prepared to make difficult decisions, some with potential trade-offs across different time periods. But when backed by a clear purpose statement that creates value for all key stakeholders, these management teams can "walk the talk". Remuneration and incentive schemes are linked to measurable ESG targets and integrated reporting—such as diversity targets or emission reduction targets. And they are preparing themselves for further regulation such as the introduction of separate ESG reporting under what is known as "Double Materiality". ConclusionIn conclusion clean, secure and affordable energy is likely to be one of the major challenges of this decade. Given we need abundant energy to complete the energy transition, we believe fossil fuel companies that are actively enabling transition to low carbon society can be part of the solution. They often understand how to deliver global energy at scale and have the balance sheets capable of enabling the transition to clean energy. We also believe companies adopting a stakeholder approach will be better equipped to solve the significant challenges facing society over the coming years, and that a clearly defined purpose will help guide management teams through the challenges and choices they will have to make. After all, it is the choices made today that will define the Future Quality returns of tomorrow. 9Ariel Babcock et al., "Walking the talk: Valuing a multi-stakeholder strategy", FCLTGlobal, 17 January 2022 Author: Johnny Russell, Investment Director, Global Equity Funds operated by this manager: Nikko AM ARK Global Disruptive Innovation Fund, Nikko AM Global Share Fund, Nikko AM New Asia Fund, Important disclaimer information |

15 Feb 2023 - Performance Report: Insync Global Capital Aware Fund
[Current Manager Report if available]

15 Feb 2023 - Performance Report: Quay Global Real Estate Fund (Unhedged)
[Current Manager Report if available]

