NEWS

1 May 2024 - 10k Words | April 2024
|
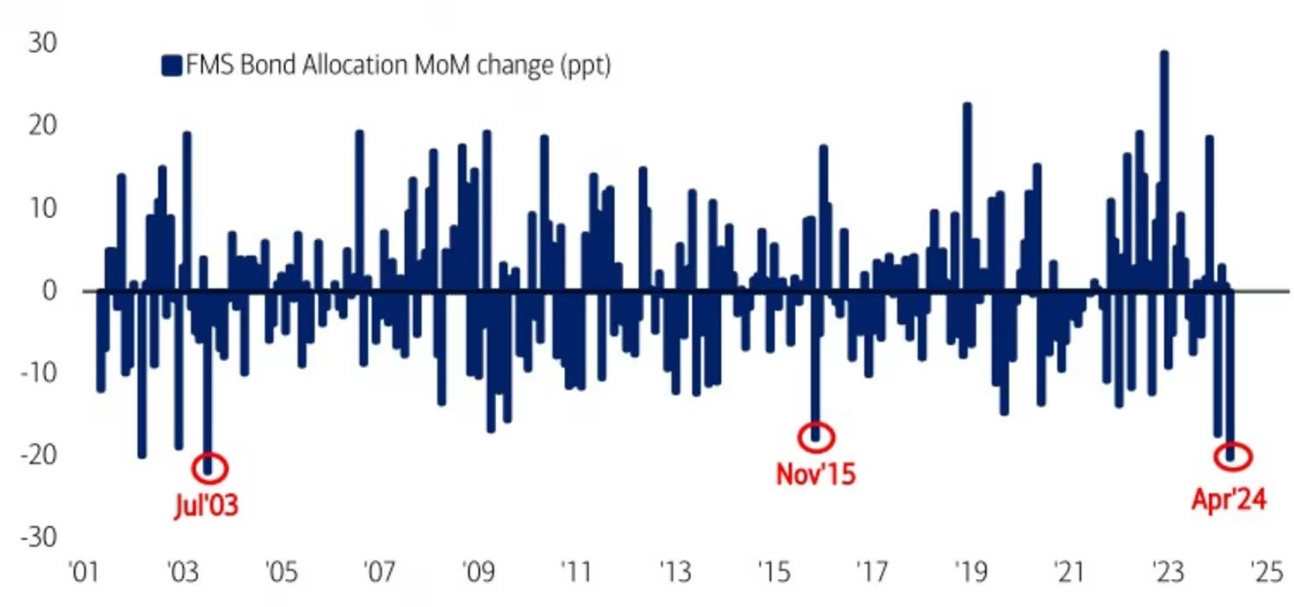
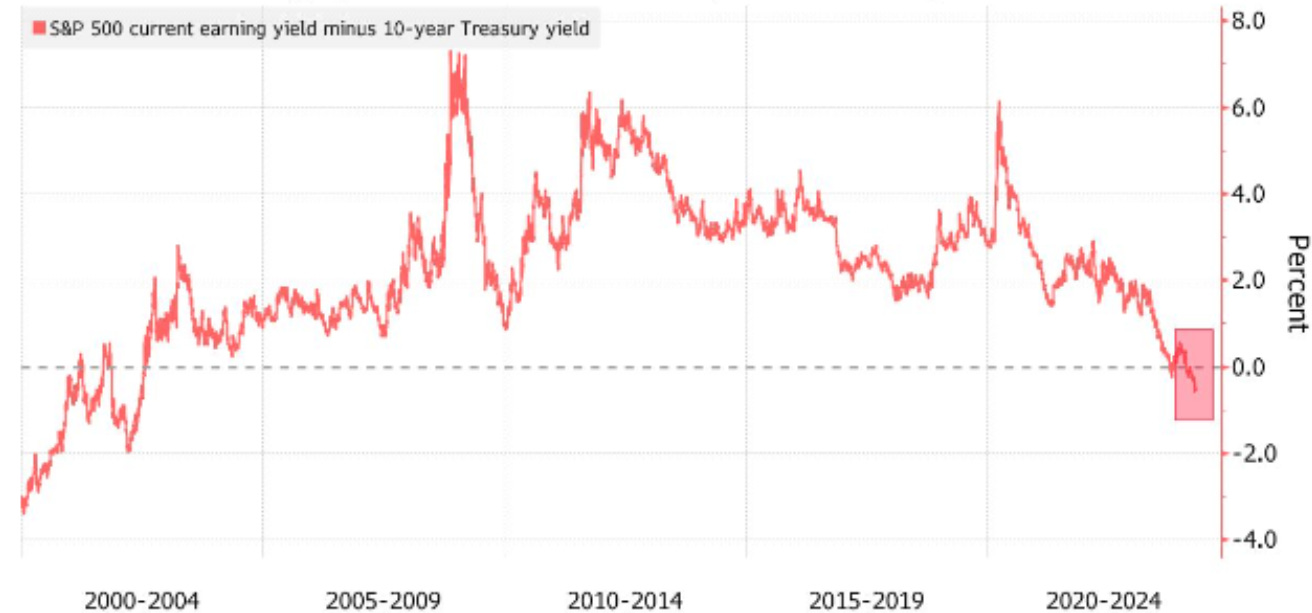
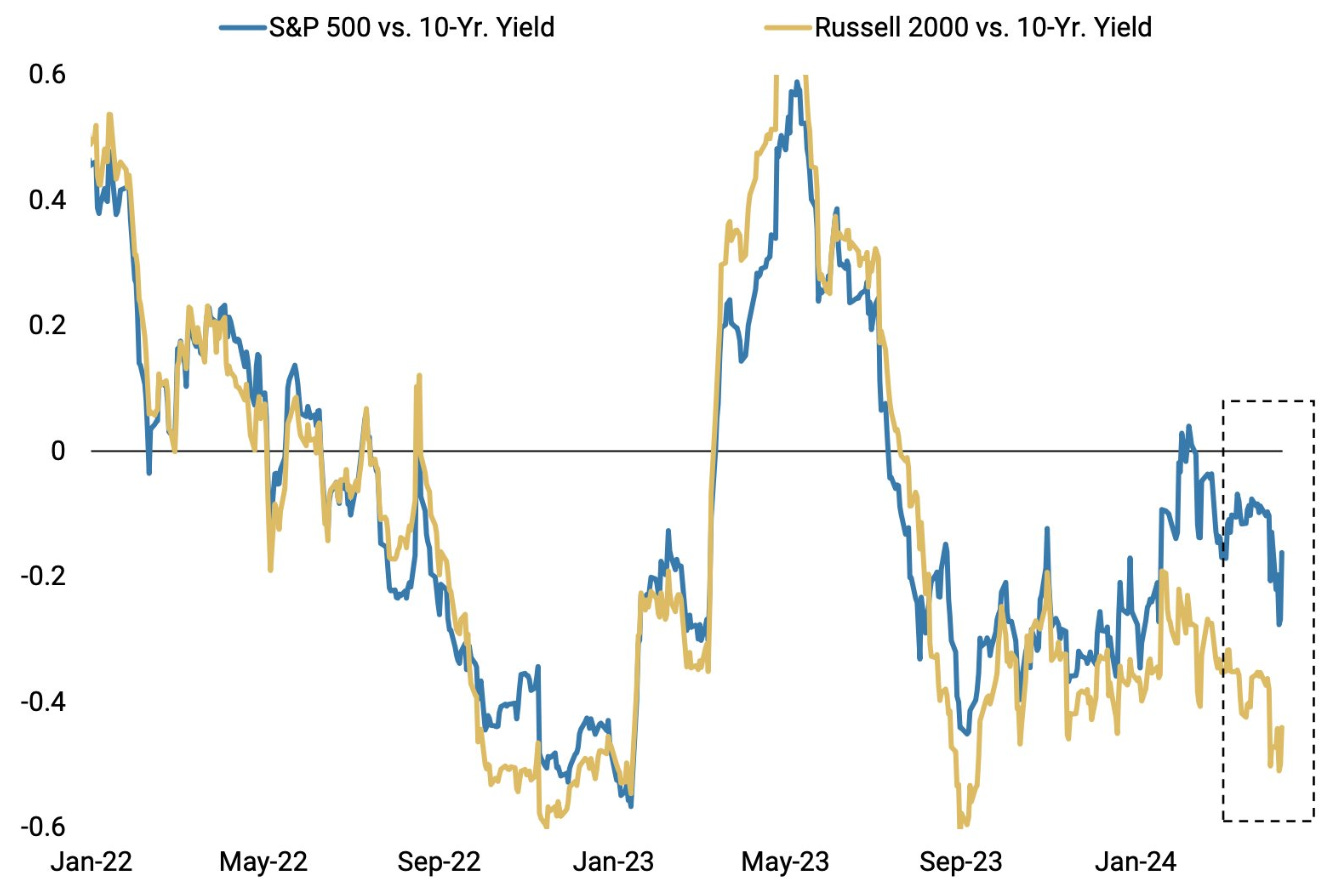
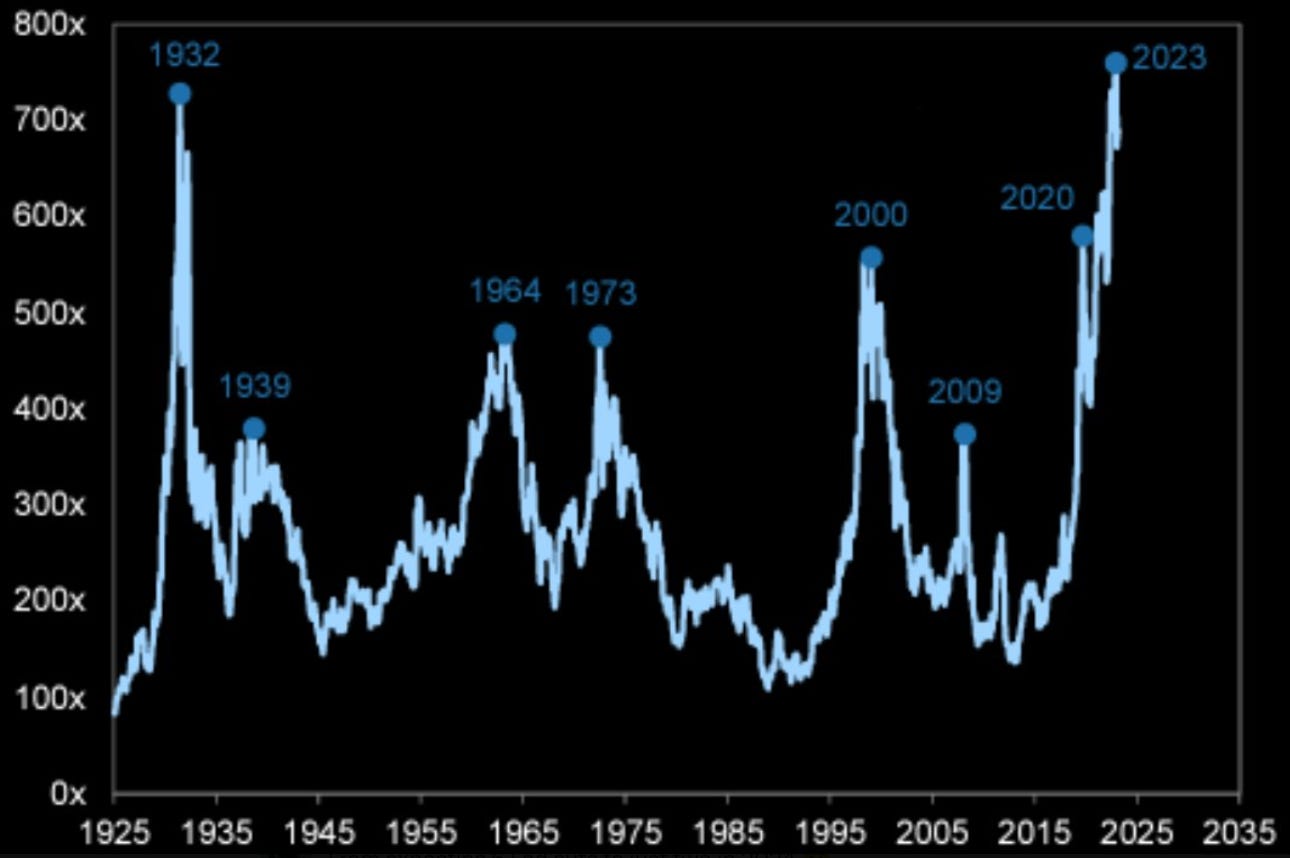
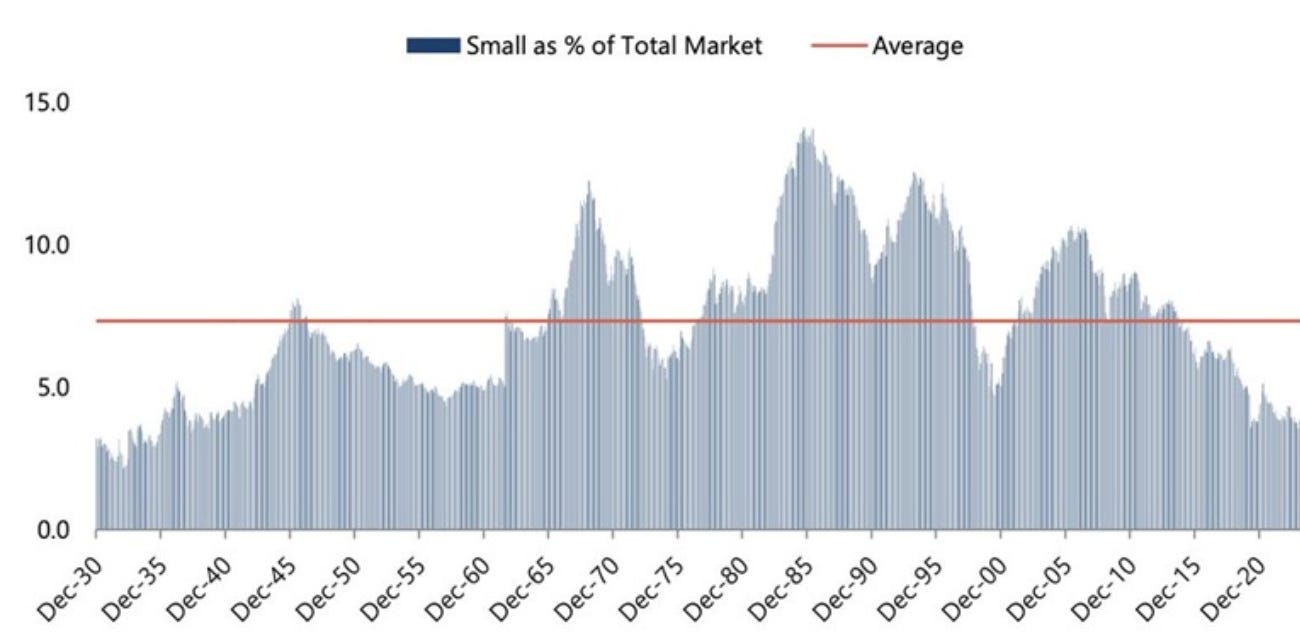
10k Words Equitable Investors April 2024 Bond demand on the slide as inflation expectations climb and the equity risk premium hits a multi-decade low, with the correlation between equities and bond yields turning more negative. The largest stocks continue to crowd out the market. Over in Japan the key equities index has finally returned to its pre-1990 peak. More listed equity is being bought back than issued as IPO activity remains stagnant. Finally we look at shifting volatility and benchmark returns for the March quarter. Biggest monthly drop in Fund Manager Survey bond allocation since July 2003
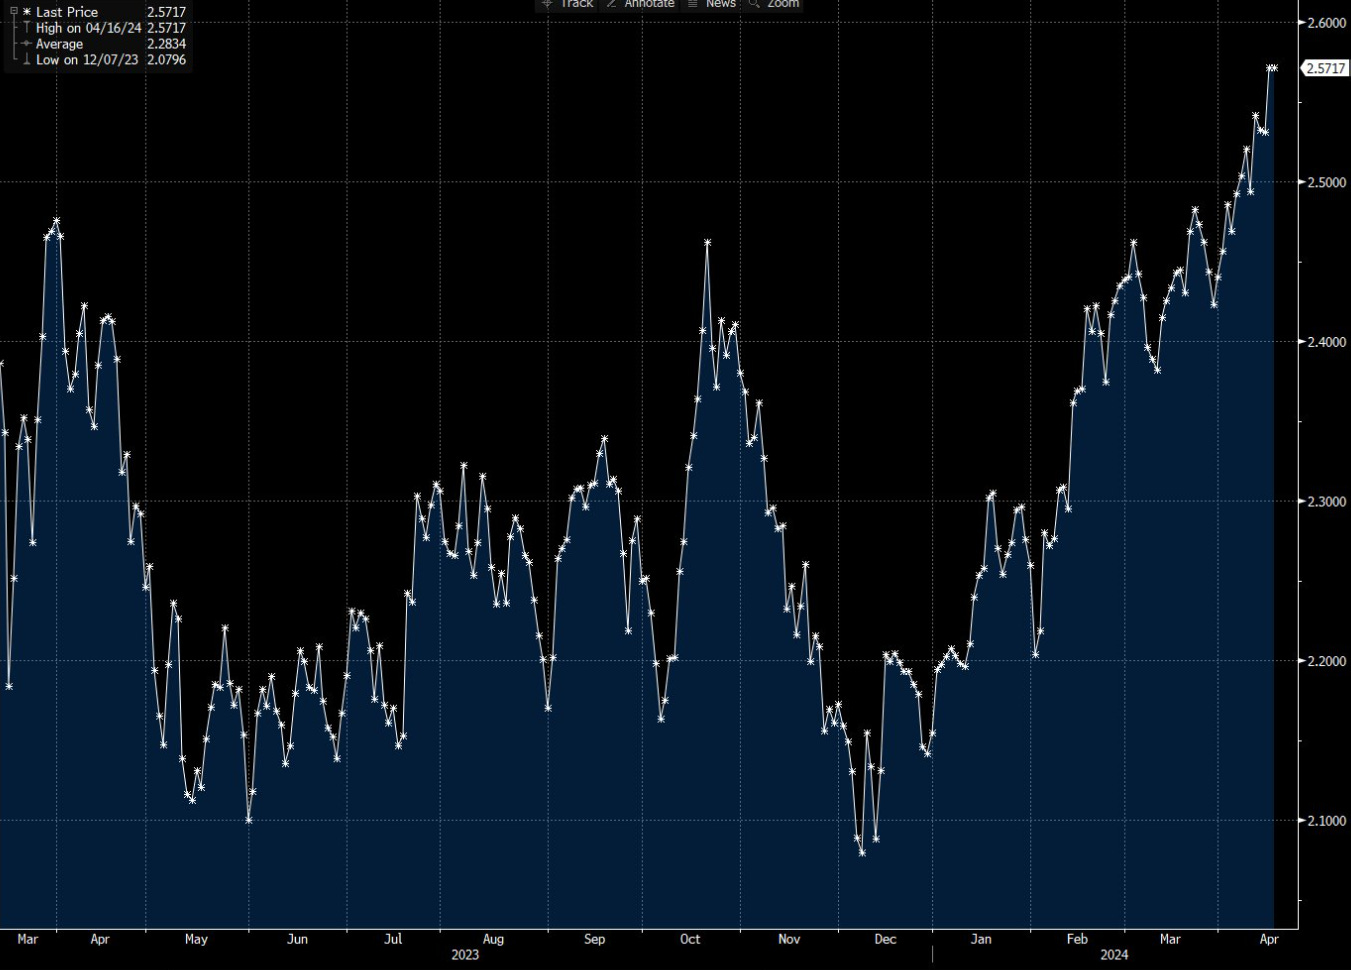
Source: Bank of America Global Fund Manager Survey Market implied US inflation over the next five years
Source: Bloomberg, @lisaabramowicz1 US equity risk premium at a 22 year low
Source: Bloomberg Rolling 2-month correlation between US equities & 10-year bond yields
Source: Morgan Stanley Research via @Schuldensuehner Market cap of the largest stock relative to the 75th percentile stock
Source: @LanceRoberts, RIAAdvisors.com Small cap stocks <4% of US equity market
Source: KobeissiLetter (data from CRSP, The University of Chicago Booth School of Business, Jefferies) Japan's Nikkei 225 finally recovers to its 1999 record
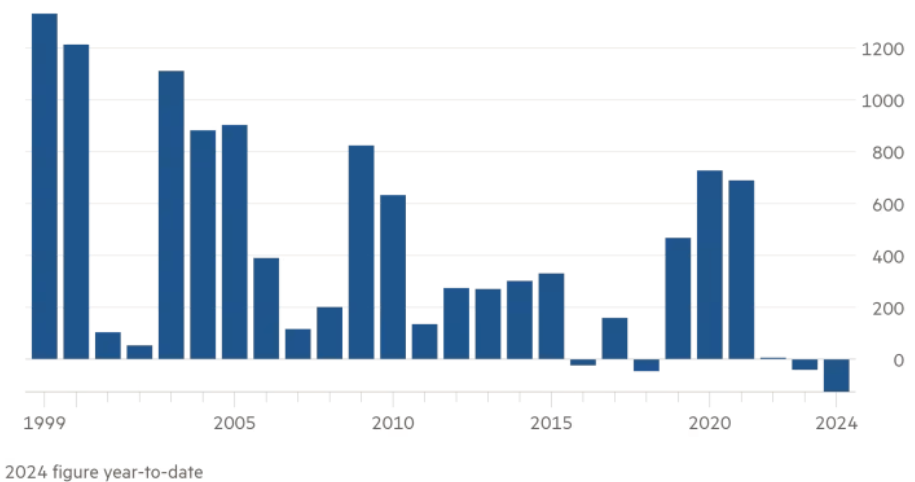
Source: Equitable Investors, Koyfin Net share issuance by companies on MSCI All Country World Index, adjusted for price and currency changes ($US billion)
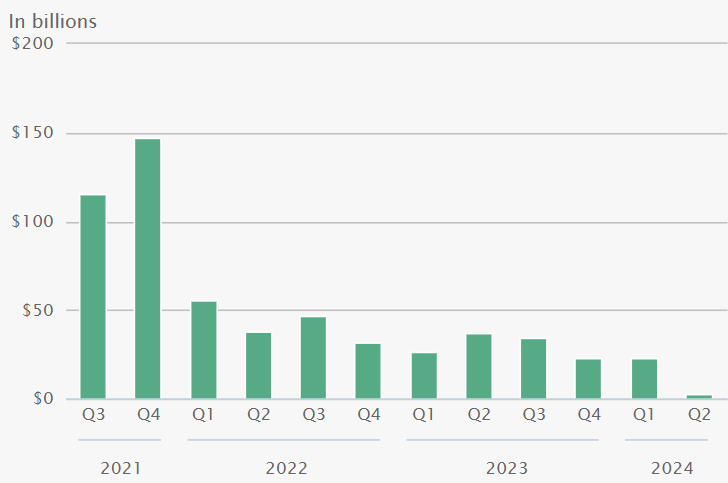
Source: Financial Times Global IPOs by quarter
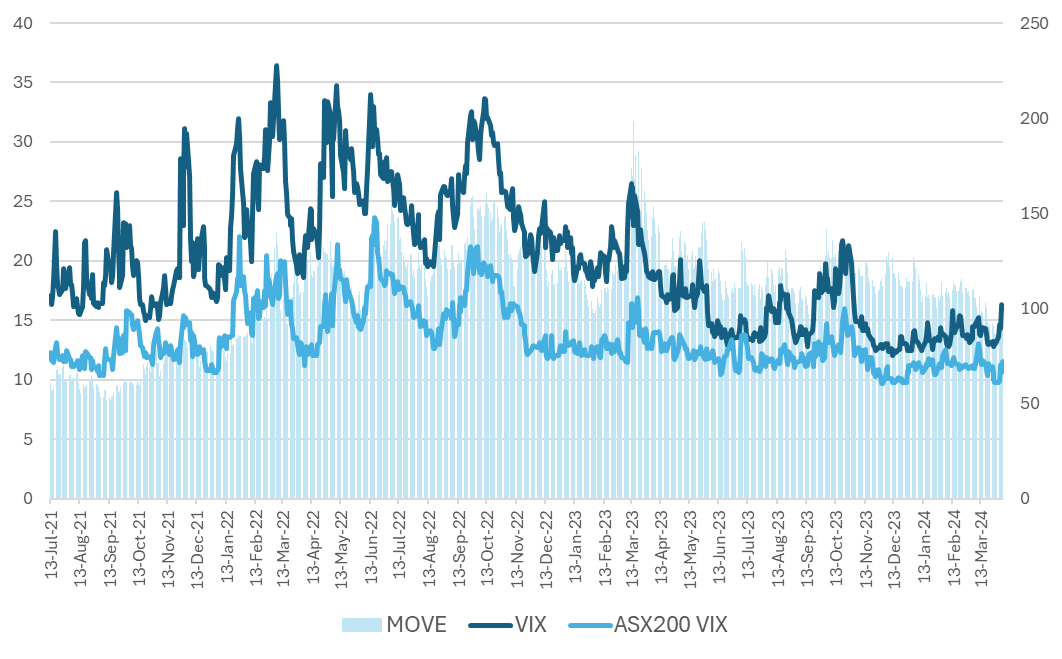
Source: WSJ, Dealogic Changes in US bond volatility (MOVE, RHS) v US equity (VIX, LHS) & Aus equity (ASX 200 VIX, LHS)
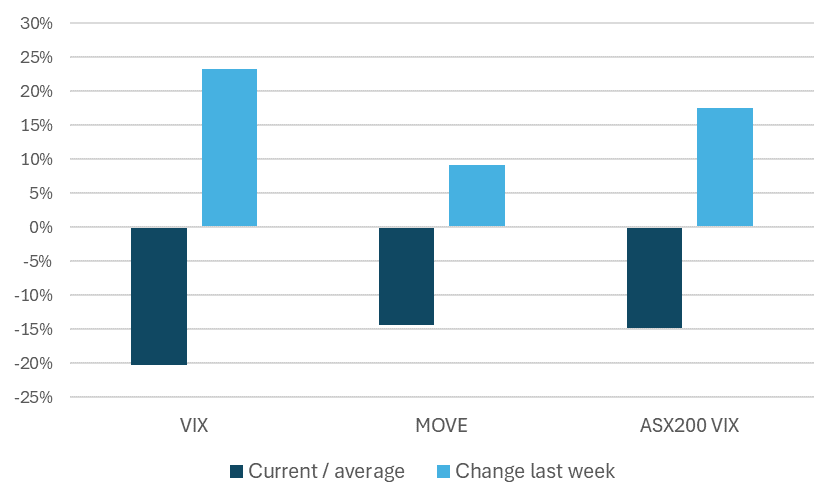
Source: Iress, Equitable Investors Volatility benchmarks v average since July 2021 and move last week
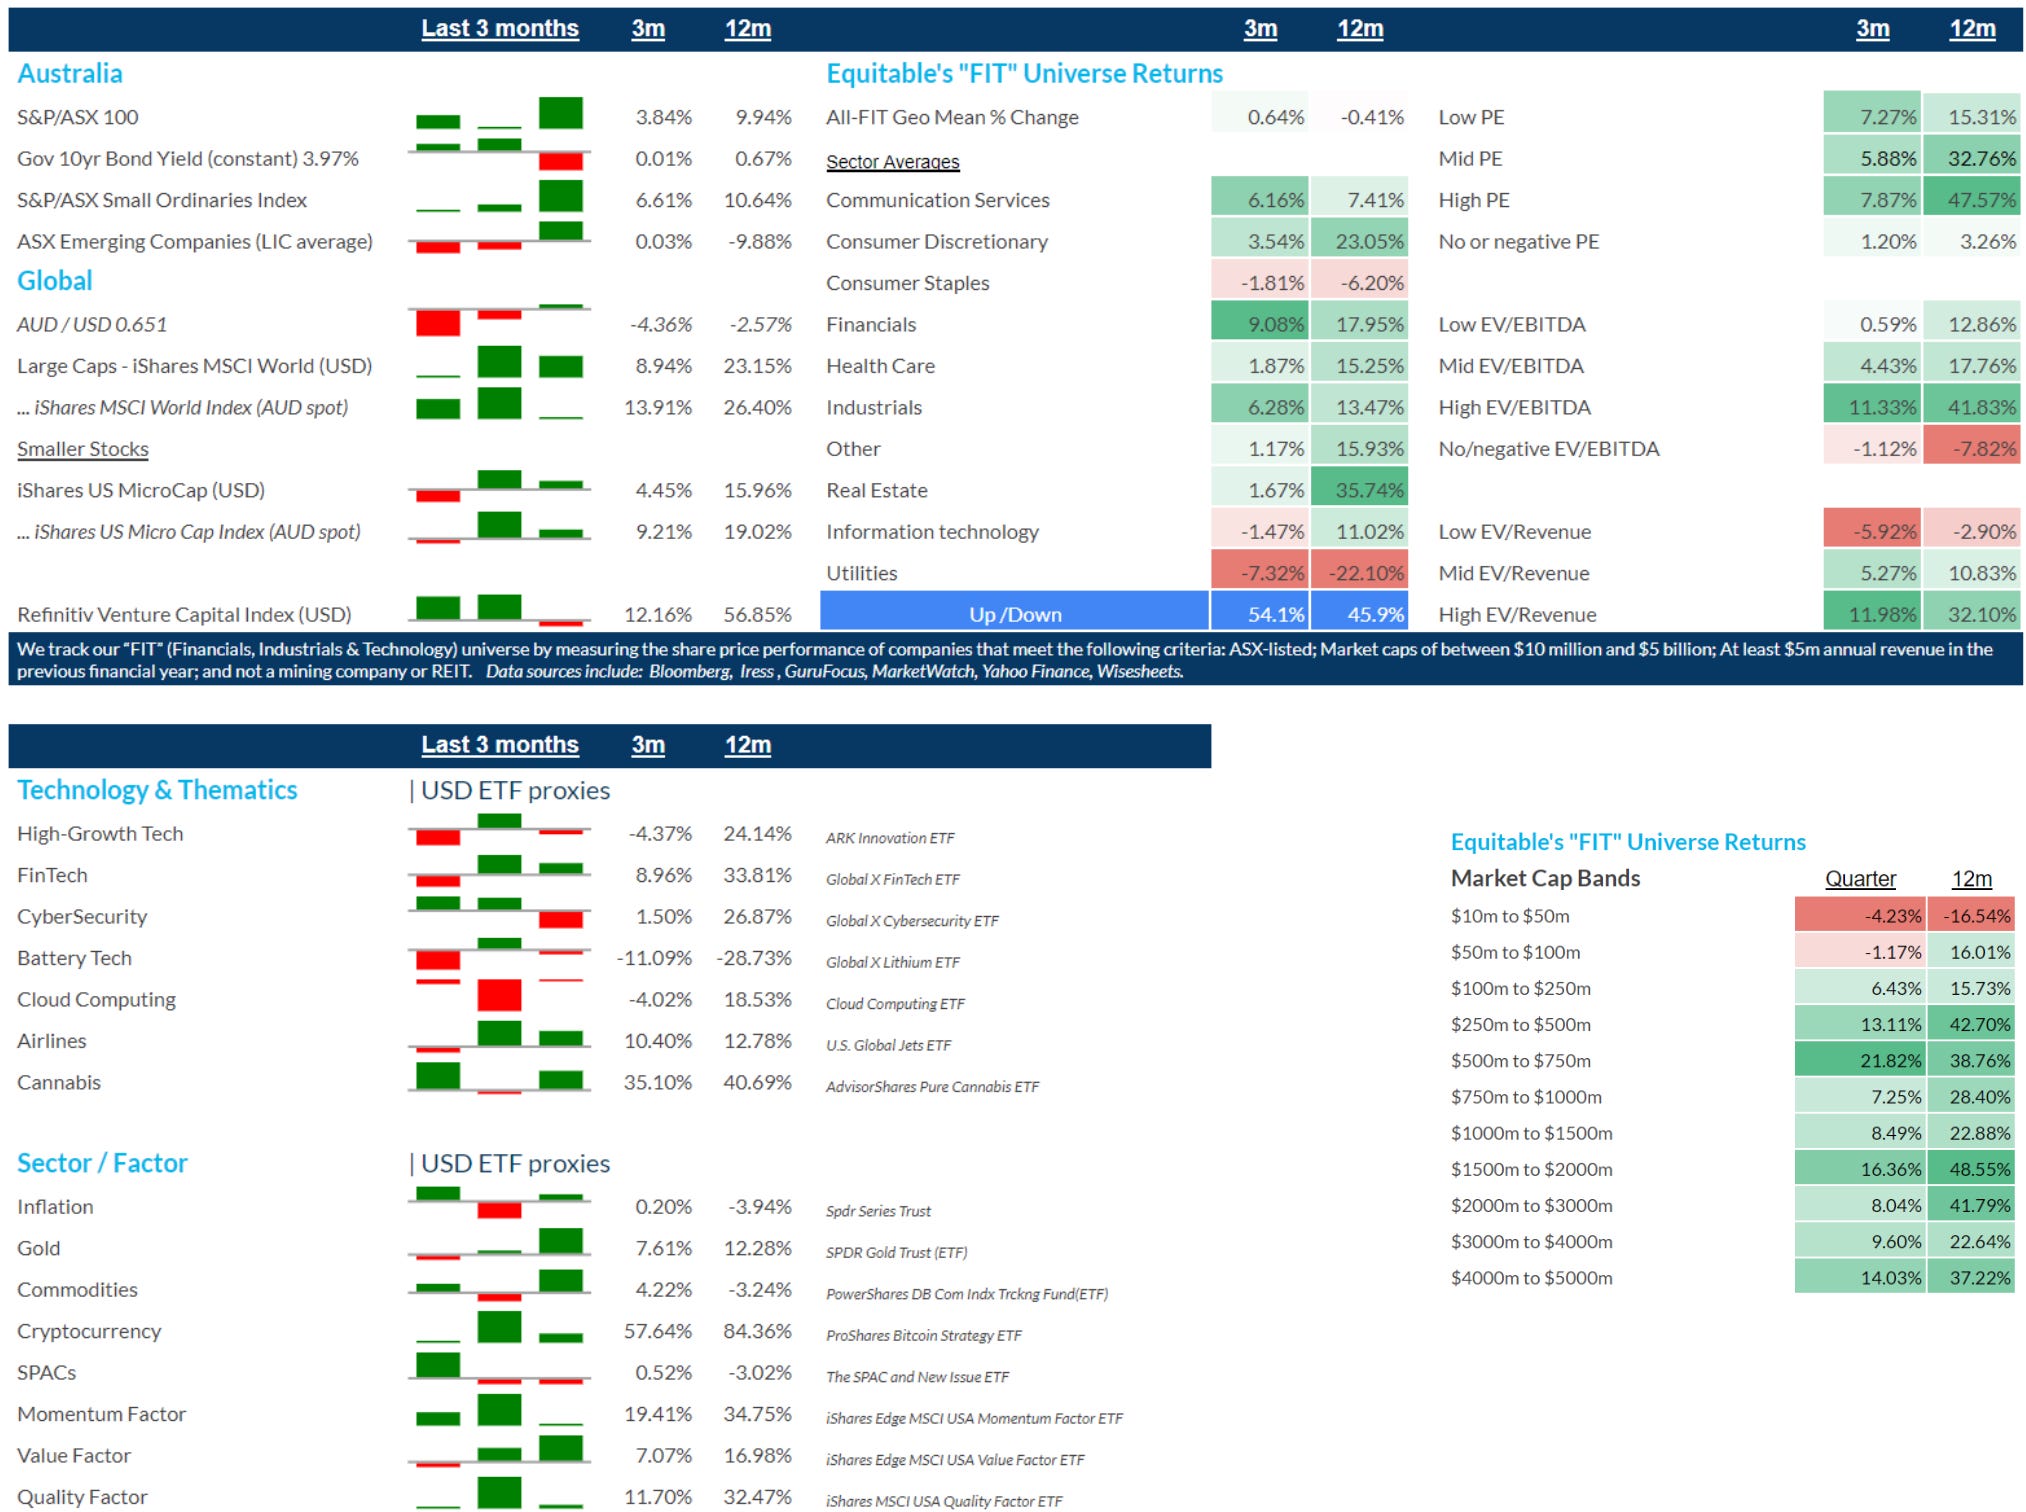
Source: Iress, Equitable Investors March Quarter (3 months) performance of key benchmarks and our "FIT" universe of ASX micro-to-mid caps Source: Iress, GuruFocus, Equitable Investors April 2024 Edition Funds operated by this manager: Equitable Investors Dragonfly Fund Disclaimer Past performance is not a reliable indicator of future performance. Fund returns are quoted net of all fees, expenses and accrued performance fees. Delivery of this report to a recipient should not be relied on as a representation that there has been no change since the preparation date in the affairs or financial condition of the Fund or the Trustee; or that the information contained in this report remains accurate or complete at any time after the preparation date. Equitable Investors Pty Ltd (EI) does not guarantee or make any representation or warranty as to the accuracy or completeness of the information in this report. To the extent permitted by law, EI disclaims all liability that may otherwise arise due to any information in this report being inaccurate or information being omitted. This report does not take into account the particular investment objectives, financial situation and needs of potential investors. Before making a decision to invest in the Fund the recipient should obtain professional advice. This report does not purport to contain all the information that the recipient may require to evaluate a possible investment in the Fund. The recipient should conduct their own independent analysis of the Fund and refer to the current Information Memorandum, which is available from EI. |


30 Apr 2024 - Performance Report: PURE Income & Growth Fund
[Current Manager Report if available]

30 Apr 2024 - Australian Secure Capital Fund - Market Update
|
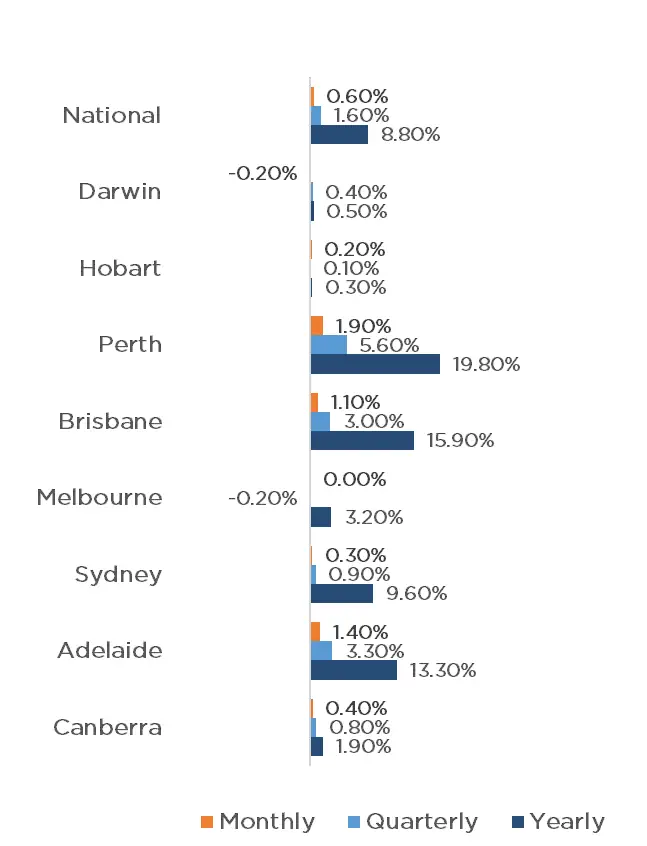
Australian Secure Capital Fund - Market Update Australian Secure Capital Fund April 2024 Property values continue to increase across the majority of the country, with CoreLogic's National Home Value Index recording a further 0.6% increase in March, on par with what was achieved in February, resulting in 14 months of continuous monthly growth. Perth continued to be the strongest performer, increasing by a mammoth 1.9% for the month, followed closely by Adelaide with 1.4% and Brisbane with 1.1%. Signs of cooling have begun in Canberra, Sydney and Hobart, with 0.4%, 0.3% and 0.2% growth respectively. Melbourne achieved parity for the month, whilst Darwin is the only capital to experience a loss, falling by 0.2%. This monthly data contributes to a 1.6% national increase for the quarter, with all capital cities experiencing some level of quarterly growth except for Melbourne, where a 0.2% reduction has occurred. As we wait for the next RBA meeting, scheduled for the 7th of May, there are growing calls by economists for a rate reduction to occur, driven by the continued slowing of GDP growth and falling inflation. Whether or not a reduction is made in May, it appears all but certain that throughout 2024 there will be reductions, which will likely result in a further bump to property prices in the coming months. Clearance Rates & Auctions week of 2nd of April 2024
Property Values as at 31st of March 2024
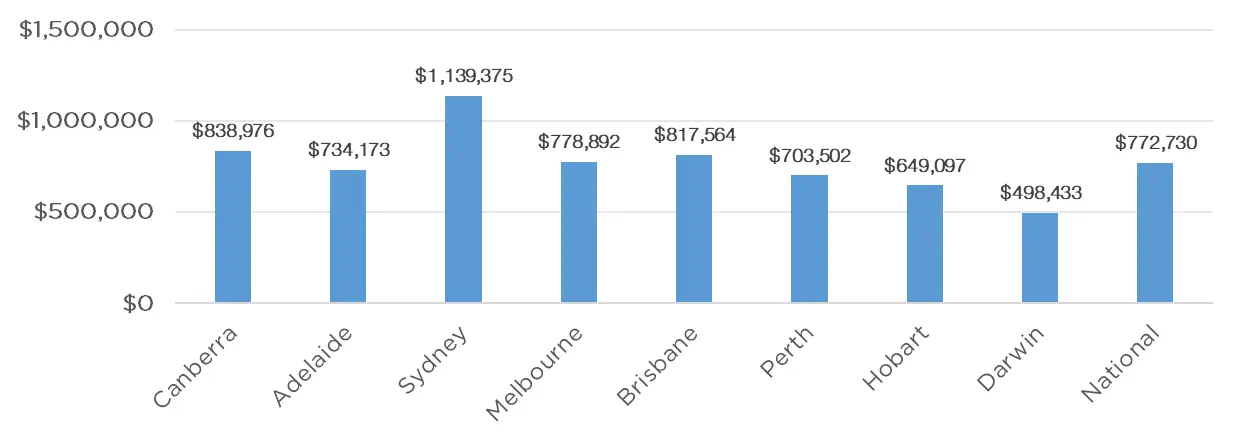
Median Dwelling Values as at 31st of March 2024
Quick InsightsSteadfast ForecastOxford Economics Australia, a leading economic institute has forecasted median property to grow to almost $2 million in Sydney alone within the next 3 years. "You have a fundamentally undersupplied market and with net overseas migration running at half a million people, a growing participation by foreign buyers, downsizers and cash buyers, demand has outweighed that drag that interest rates would typically have.", said Maree Kilroy, Oxford Economics senior economist. Source: Australian Financial Review Affordability is the TrendThe medium-high end of the Sydney housing market may have finally reached a peak that lower end buyers cannot afford as a flood of homebuyers move into previously affordable suburbs driving prices up. The lower end market has grown 5 times as fast as the higher end in past 6 months, and is likely to continue as more people seek to delay the effect of the housing crisis in their lives. Source: Australian Financial Review Author: Filippo Sciacca, Director - Investor Relations, Asset Management and Compliance Funds operated by this manager: ASCF High Yield Fund, ASCF Premium Capital Fund, ASCF Select Income Fund |

29 Apr 2024 - New Funds on Fundmonitors.com
|
New Funds on FundMonitors.com |
|
Below are some of the funds we've recently added to our database. Follow the links to view each fund's profile, where you'll have access to their offer documents, monthly reports, historical returns, performance analytics, rankings, research, platform availability, and news & insights. |
 |
||||||||||||||||||||||
| State Street Climate ESG International Equity Fund | ||||||||||||||||||||||
|
||||||||||||||||||||||
| View Profile | ||||||||||||||||||||||
 |
||||||||||||||||||||||
| Pendal Sustainable Australian Share Fund | ||||||||||||||||||||||
|
||||||||||||||||||||||
| View Profile | ||||||||||||||||||||||
| Pendal Multi-Asset Target Return Fund | ||||||||||||||||||||||
|
||||||||||||||||||||||
 |
||||||||||||||||||||||
| Magellan Core ESG Fund | ||||||||||||||||||||||
|
||||||||||||||||||||||
 |
||||||||||||||||||||||
| 5AM Capital Global Equity Fund | ||||||||||||||||||||||
|
||||||||||||||||||||||
|
|
||||||||||||||||||||||
| Gryphon Capital Income Trust (ASX: GCI) | ||||||||||||||||||||||
|
||||||||||||||||||||||
| View Profile | ||||||||||||||||||||||
|
Want to see more funds? |
||||||||||||||||||||||
|
Subscribe for full access to these funds and over 800 others |


26 Apr 2024 - Hedge Clippings | 26 April 2024
|
|
|
|
Hedge Clippings | 26 April 2024 The "stronger for longer" inflationary thesis gained further strength this week both locally and in the US, with the added problem that growth is slowing while inflation refuses to do so. News & Insights New Funds on FundMonitors.com US wildfire risk rears its head again | 4D Infrastructure March 2024 Performance News |
|
|
If you'd like to receive Hedge Clippings direct to your inbox each Friday |

26 Apr 2024 - Performance Report: ECCM Systematic Trend Fund
[Current Manager Report if available]

26 Apr 2024 - The future of mining with AHS
|
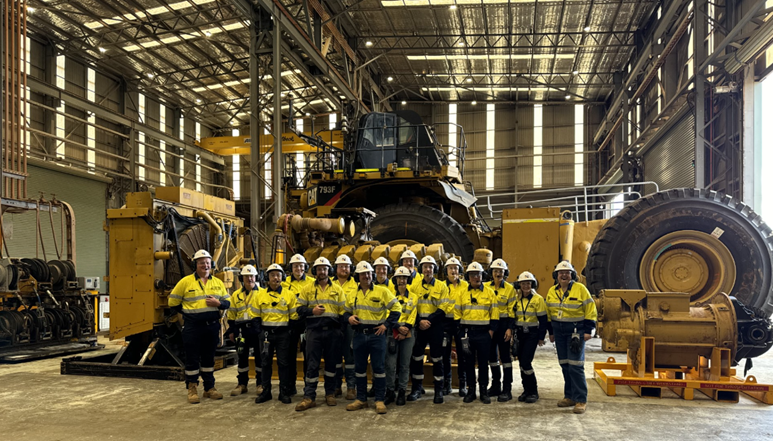
The future of mining with AHS Tyndall Asset Management April 2024 Imagine a colossal gold mine, Australia's largest no less, where its scale and longevity could be confused for an iron ore mine in the Pilbara. Where massive trucks navigate the landscape with uncanny precision, devoid of almost all human drivers. This isn't science fiction; it's the reality at Boddington, a mine that has rewritten the rulebook on gold mining best practices in autonomous haulage and is paving the way for future rollouts across Newmont's portfolio. Boddington's drive for efficiency, safety and sustainability and lessons for the futureI was fortunate enough to recently visit Newmont's Boddington Gold Mine (BGM), located some 120km south-east of Perth. For 16 years under Newmont's management, Boddington has been a consistent gold producer at scale, churning out copper-gold concentrate and gold bars. Newmont has mine life extension plans that could see the BGM operation extend to 2059. Currently, Newmont mines from the astutely named North and South pits, but by the end of the mine's life, the pit design would eventually merge into one, rivalling Kalgoorlie's world-renowned Super Pit.
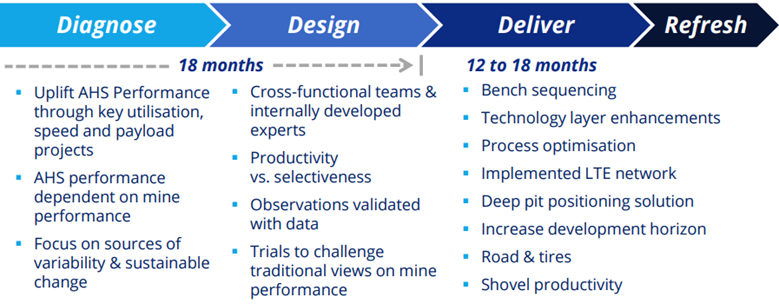
Source: Tyndall AM, March 2024. A Pioneering Journey: The rise of AHS at Boddington and the learningsBoddington's Autonomous Haulage System (AHS) journey is a story pushing the boundaries of both productivity gains and ESG standards. With a fleet of 41 CAT 793F trucks, these behemoths are guided by the sophisticated CAT MineStar operating system. Launched in 2021, this system has propelled Boddington to the forefront of mining technology, making it the world's first open-pit gold mine to boast a fully autonomous haulage fleet. The US$150 million project to convert the legacy fleet was completed ahead of schedule and under budget, even amidst the disruptions of COVID-19. The AHS roll out encountered several challenges during its commissioning phase including in-pit communications issues, severe weather and heavy rainfall, shovel reliability issues and issues managing in-pit bench hygiene. These obstacles provided valuable learning opportunities through commissioning. Key learnings from the roll out have been focused on optimising the mine plan design to best suit the operating conditions of the AHS fleet, such as straightening roads and removing intersections. AHS trucks abide by a set of strict rules that ensure a predictable and safe outcome. These rules include slowing down at intersections and around bends and when coming into proximity with light vehicles. Additionally, meticulous road maintenance and assessing ramp gradation became crucial for the improved operations. It is believed that 95% of learnings from Boddington can be replicated across future AHS fleet roll outs at other assets (discussed later). Many of the learnings are also applicable to non-AHS fleet with the issues identified by AHS fleet communicated to Newmont's other open pit operations. Justifying the investment: Outcomes witnessed to date and the benefit of a systematic approachAfter 13 years of 100% Newmont ownership, it took the AHS fleet only 12 months to beat the tonne per kilometre of movement performance record by 10%. Under the company's roadmap (refer Figure 1), management believes there is another 10% of productivity upside available. These productivity improvements will be achieved via a combination of improved truck availability (reduced downtime) and increased tonnes per kilometre. The benefits of AHS extend far beyond mere operational efficiency, with safety taking centre stage by removing human interactions with large and heavy machinery. Human error is significantly reduced as a result of autonomous trucks meticulously following designated paths and operating parameters. Critically, this translates to a dramatic decrease in the risk of fatalities and vehicle collisions. Figure 1: Newmont's full potential productivity potential roadmap
Source: Boddington, March 2024. The environmental benefits are undeniable. Reduced fuel consumption due to optimized operations translates to lower greenhouse gas emissions. Since the introduction of the AHS, the Boddington operation has achieved significant fuel efficiency, saving approximately 1.5 million litres per year. Additionally, less wear and tear on tyres and other consumables contribute to a more sustainable mining operation. The financial and productivity improvements - alongside the improvements in safety - boil down to operating discipline. Human operators compensate when the mine plan or operating conditions are not optimal, making it very hard for managers to identify issues and correct appropriately. Autonomous trucks strictly adhere to all operating constraints, so when an issue is encountered, the system will alert operators in control and the truck will stop operating. This results in bottlenecks being identified and rectified more rapidly than when humans operate trucks. For example, if the optimal path from the pit floor to the crusher is blocked due to poor bench hygiene, the human operator, depending on factors like KPIs and mine culture, could choose a longer route and leave the rectification of the optimal route outstanding. However, the autonomous truck fleet will flag this issue with control and the optional route will be restored, leading to savings on future diesel consumption and increasing productivity. A future powered by AHS: Further opportunities within the Newmont portfolioThe potential applications of Boddington's AHS learnings are vast. The ability to remove workers from hazardous environments and improve production efficiency makes AHS a compelling proposition across some of Newmont's core assets. Underground mining operations at Cadia and Lihir are prime candidates for this technology. The Lihir ore body, for example, sits within an extinct volcano where ground temperatures can reach up to 80 degrees celsius. Regular geysers can erupt, making it too dangerous for humans to walk the pit floor, providing a significant opportunity for better remote operated technologies. ESG benefits of AHS offers improved risk adjusted outcomesAHS rollout is just one tool in the toolbox to realise latent operational value from a financial and ESG standpoint, while decreasing the risk of a material safety event occurring and offering improved risk adjusted returns. The benefits of deploying AHS are clear; it can reduce operating costs, reduce fleet maintenance and improve productivity alongside improving safety, all of which align with the ethos of responsible and sustainable mining practices. Other Tyndall portfolio companies are also championing autonomous solutions, including Rio Tinto and BHP. At Tyndall, we analyse these metrics in absolute, relative, and directional trend terms, with safety metrics critical factors in both our assessment of the investable landscape and portfolio construction process. Author: Tom Hays, Research Analyst Funds operated by this manager: Tyndall Australian Share Concentrated Fund, Tyndall Australian Share Income Fund, Tyndall Australian Share Wholesale Fund |

24 Apr 2024 - Performance Report: Emit Capital Climate Finance Equity Fund
[Current Manager Report if available]

23 Apr 2024 - Performance Report: Digital Asset Fund (Digital Opportunities Class)
[Current Manager Report if available]

23 Apr 2024 - US wildfire risk rears its head again
|
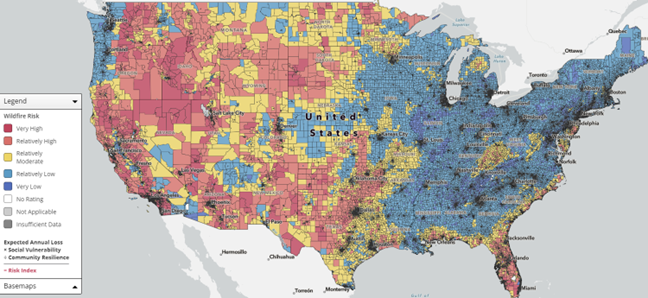
US wildfire risk rears its head again 4D Infrastructure April 2024 In his annual letter to investors, released on 24 February 2024, Warren Buffett drew the public's attention to the increasing wildfire risk that electric utility investors in parts of the US are exposed to. He confirmed this risk had negative ramifications on essential investment required to support utilities and communities alike. This messaging was further reinforced by the experience of Xcel Energy, who in early March confirmed that its assets in Texas were likely responsible for the ignition of the Smokehouse Creek wildfire. Strong words from Buffet on an increasingly concerning utility riskBuffett drew broader investor attention to an issue which is already well understood by US utility investors, attributing the poor performance of Berkshire Hathaway Energy (BHE) to increased wildfire risk - to "the regulatory climate in a few [US] states has raised the spectre of zero profitability or even bankruptcy (an actual outcome at California's largest utility and a current threat in Hawaii)". This was in reference to BHE's utility company, PacifiCorp (referenced in the previous article listed above), which BHE believes is facing at least $8 billion in legal liability claims associated with fires it allegedly ignited in October 2020[1]. The scale of such potential liabilities obviously raises the question of the financial viability of PacifiCorp. To this Buffett stated, "At Berkshire, we have made a best estimate for the amount of losses that have occurred. These costs arose from forest fires, whose frequency and intensity have increased - and will likely continue to increase - if convective storms become more frequent". Importantly, with regard to BHE's appetite in bailing out the company from financial distress Buffett stated, "Berkshire can sustain financial surprises but we will not knowingly throw good money after bad"[2]. This should be a major concern for legislators and regulators in exposed states, as an electric utility in financial distress (potentially bankruptcy proceedings) will struggle to attract investment capital and service its customers. This is particularly important in the current environment, with massive capital investment required to support the energy transition and power demands of AI and data centres. Indeed, Buffet recognises the investment proposition on which utilities were historically based could be in question, "Now, the fixed-but-satisfactory return pact has been broken in a few states, and investors are becoming apprehensive that such ruptures may spread". Xcel Energy the latest utility at riskShortly after the release of Buffett's investor letter, Xcel Energy confirmed that its assets are likely to have ignited the Smokehouse Creek wildfire in Texas. A lawsuit against the company has claimed that one of the company's utility poles near Stinnett, Texas, had been blown over by strong winds sparking the initial blaze. The fire based in the largely rural Texas panhandle and parts of Oklahoma burnt around 1.2 million acres, destroyed 400-500 structures, and is associated with two casualties. Despite it being too early to understand the potential legal liabilities facing the company, Xcel Energy's share price fell 17% (representing a c.US$6 billion devaluation in market capitalisation) in the week after media reports implicated the company in the fire. This again reinforced the risk facing electric utility investors from the unintended ignition of wildfires. The states, and therefore companies, physically exposedOne major problem in identifying wildfire risk is that the geographies exposed to wildfires are increasing over time as a result of global warming - which we touch on in our article, Extreme weather risks and their impact on investors. Despite the increasing occurrence, the states that are currently most exposed to wildfires are depicted by UBS below, utilising data provided by FEMA on the National Risk Index. The map shows that the highest risk areas are in the western, central and southern parts of the US.
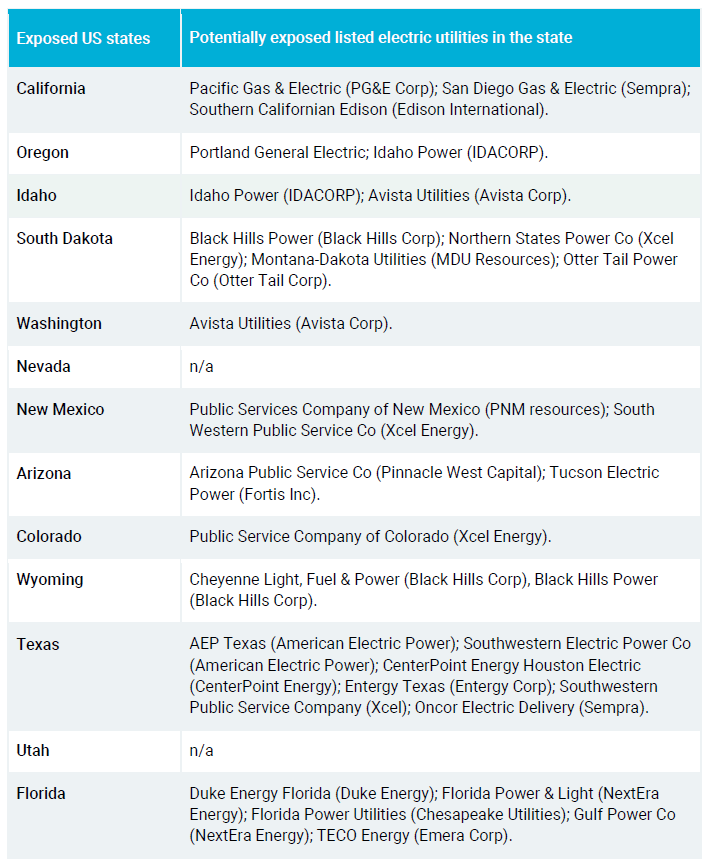
Source: California Board of Forestry and Fire Protection (CAL Fire) The map helps identify states that are most exposed to wildfires, and the utilities which have significant operations in those states (listed in the table below). This provides a first pass as to utilities in 4D's investment universe which have/could have risk from wildfires.
This a high-level geographic assessment only and captures many of the US utility operators. A deeper dive would see some with little real wildfire exposure at present as they operate in more urbanised areas with little vegetation to support the damaging fires - for example CenterPoint Energy Houston Electric (in the Texas section of the table above) have confirmed that their operations in downtown Houston is highly unlikely to be impacted. Other considerations to wildfire liability exposureOther major considerations as to electric utilities' exposure to wildfire liabilities include: 1) how prepared electric utility companies are to mitigate physical wildfire risks; 2) what litigious environments exist in various states; and 3) are companies able to manage wildfire liabilities of various scale if incurred? These are the areas that 4D undertakes significant due diligence in when considering a company for investment. When researching a potential investment in a US electric utility that is in (or could develop into) a high wildfire risk geography, we spend significant time understanding the company's wildfire mitigation preparedness. This incorporates getting a thorough understanding of wildfire mitigation plans in its totality, which incorporates vegetation management processes, situational awareness (video monitoring of the network, lineman visual inspections, and drone surveillance), investment in hardening the network from fire ignition, and established public safety power shutdown (PSPS) procedures as a last resort. Significant investment in the insulation of overhead wires, replacement of weak/old power poles and undergrounding of wires in particularly high-risk regions all 'harden' the grid from wildfires. The particular litigious framework established in individual states identified in the table above vary considerably. Some key factors, which will influence the level of legal liability risk, include:
The question of a company's ability to manage wildfire liabilities will be dependent upon its balance sheet capacity and liquidity, which are obviously influenced by its size. Smaller electric utilities, including smaller municipal owned utilities, will be less able to manage large legal liabilities and are more likely to be forced into financial distress and/or bankruptcy. Could this be a driver of M&A consolidation in some states? A financially distressed company is unlikely to have the capacity and/or willingness to continue to invest much-needed capital in the networks (replacement, growth and hardening) which could hinder economic and social development in the exposed region. We expect there will be growing questions around insurance for these events - what can be insured, what premiums will do as this risk intensifies, and when does insurance pay out? It could get harder for utilities to protect themselves from this risk. 4D's approachWildfire risk is becoming a bigger concern for market investors and is probably something that is still being understood. At 4D, we don't recommend avoiding these companies from investment altogether. We do, however, recommend thorough due diligence of the risk to a company before taking a position. As always, we balance quality, risk and return in making investment decisions. In some cases, that risk will be too great - as Buffett outlines, there is the potential for the adoption of risk that outweighs the potential regulatory return of a utility, which can end up in the loss of all equity value (as experienced by PG&E Corp). However, in others we see the moderated risk more than compensated by valuations, with network hardening against fires also a strong driver of earnings growth. The content contained in this article represents the opinions of the authors. This commentary in no way constitutes a solicitation of business or investment advice. It is intended solely as an avenue for the authors to express their personal views on investing and for the entertainment of the reader. [1] Warren Buffett's western utility facing untold billions in wildfire damages after the latest bombshell jury verdict came down - The Associated Press; 7/3/2024 [2] Charlie Munger - The Architect of Berkshire Hathway; Warren Buffett; 24/2/2024 Funds operated by this manager: 4D Emerging Markets Infrastructure Fund, 4D Global Infrastructure Fund (AUD Hedged), 4D Global Infrastructure Fund (Unhedged) |