NEWS

8 May 2023 - Magellan Global Fund Update
|
Magellan Global Fund Update Magellan Asset Management April 2023 |
|
Global Portfolio Managers Nikki Thomas, and Arvid Streimann, discuss the unfolding interest rate cycle and the effect it's having on market sentiment and company valuations. They provide an update on the portfolio's recent performance and its positioning for the current environment. |
|
Funds operated by this manager: Magellan Global Fund (Hedged), Magellan Global Fund (Open Class Units) ASX:MGOC, Magellan High Conviction Fund, Magellan Infrastructure Fund, Magellan Infrastructure Fund (Unhedged), MFG Core Infrastructure Fund Important Information: This material has been delivered to you by Magellan Asset Management Limited ABN 31 120 593 946 AFS Licence No. 304 301 ('Magellan') and has been prepared for general information purposes only and must not be construed as investment advice or as an investment recommendation. This material does not take into account your investment objectives, financial situation or particular needs. This material does not constitute an offer or inducement to engage in an investment activity nor does it form part of any offer documentation, offer or invitation to purchase, sell or subscribe for interests in any type of investment product or service. You should read and consider any relevant offer documentation applicable to any investment product or service and consider obtaining professional investment advice tailored to your specific circumstances before making any investment decision. A copy of the relevant PDS relating to a Magellan financial product or service may be obtained by calling +61 2 9235 4888 or by visiting www.magellangroup.com.au. Past performance is not necessarily indicative of future results and no person guarantees the future performance of any strategy, the amount or timing of any return from it, that asset allocations will be met, that it will be able to be implemented and its investment strategy or that its investment objectives will be achieved. This material may contain 'forward-looking statements'. Actual events or results or the actual performance of a Magellan financial product or service may differ materially from those reflected or contemplated in such forward-looking statements. This material may include data, research and other information from third party sources. Magellan makes no guarantee that such information is accurate, complete or timely and does not provide any warranties regarding results obtained from its use. This information is subject to change at any time and no person has any responsibility to update any of the information provided in this material. Statements contained in this material that are not historical facts are based on current expectations, estimates, projections, opinions and beliefs of Magellan. Such statements involve known and unknown risks, uncertainties and other factors, and undue reliance should not be placed thereon. Any trademarks, logos, and service marks contained herein may be the registered and unregistered trademarks of their respective owners. This material and the information contained within it may not be reproduced, or disclosed, in whole or in part, without the prior written consent of Magellan. |

5 May 2023 - Hedge Clippings | 12 May 2023
|
|
|
|
Hedge Clippings | 12 May 2023 Treasurer Jim Chalmers was understandably pleased to be able to hand down a budget forecasting a surprise surplus, but according to more than a few economists the real surprise will be whether it eventuates or not. As has been widely questioned, the risk is that the selected spending initiatives will be inflationary, leaving the RBA with no alternative but to either increase interest rates further or keep them higher for longer. Meanwhile, on the revenue side, there is still no appetite from either the government nor the opposition to fix or address the reliance on personal income tax. The opportunity has been lost for another year, as it has every year since the Henry Tax Review in 2010, and no doubt will be put in the too hard basket again next year as well. Hedge Clippings is not going to dwell on the budget too long - it is covered more than enough elsewhere. However, it was interesting, if not alarming, that a research paper out of the RBA this week estimates the chance of a recession next year at 80%. If inflation does continue at an elevated level as many believe it will, and the RBA sticks to its determination to address it, a recession, whether with a "hard" or "soft" landing, is likely to be the outcome. It's going to be a delicate balance, or as Philip Lowe describes it, a "narrow road". Turning to markets and managed funds. Market shocks, such as the '87 crash, the tech wreck of 2000, or the GFC, tend to create opportunity - particularly for the brave - after extended periods of investor exuberance, which when coupled with excessive leverage lead to stretched valuations. The past two to three years however have been different, but according to many managers we have spoken to, could be considered one of the most challenging periods in recent memory. Certainly there were stretched valuations, particularly in the tech and growth sectors, post GFC thanks to QE and central bank intervention, but little could have prepared markets for the combined effects of COVID, Russia's invasion of Ukraine, and the resultant outbreak of global inflation. The small cap sector always takes the brunt when investors switch from risk on to risk off - having paved the way and outperformed in the first place. Over the year to December 2022, the average performance of the 86 funds which make up the Australian Mid and Small Cap Peer Group fell by 19% compared with the Australian Large Cap Peer Group, which fell on average only 4%. By contrast they topped the performance tables three years before. This cycle is not unusual given the lack of liquidity often accompanying stocks outside the ASX200 (and sometimes within it) but there's little doubt that as a result the lack of interest, or appetite for risk accentuates the losses, and in turn creates opportunity. The key of course comes in the timing, so earlier this week we hosted a webinar discussion with three "small cap" fund managers, namely Dean Fergie from Cyan Investment Management, Steven Johnson from Forager Funds Management, and Gary Rollo from Montgomery Investment Management, to ask them the sometimes difficult question about their experiences over the past two years or so, but more importantly, if the worst of the current market was behind them? You can watch a recording of the discussion below, but there were some key take-aways from each of them. None of them shied away from the difficult questions but were all consistent in their view that trying to time the bottom or turning point in the market was an impossible exercise. Each gave examples of oversold companies or markets, and each reiterated that holding profitable, successful businesses, with strong balance sheets (sometimes trading at or below asset, or even cash backing) will provide outsized future returns, rather than selling them at current depressed valuations. Of interest is the fact that while the small cap sector has still underperformed the ASX200 in the six months to the end of April (+3.83% to +8.71%) at least it is positive, while over the past three months while marginally negative, the small cap peer group has just outperformed (-0.70% to the ASX200 at -0.80%). Maybe the tide is about to turn? |
|
|
News & Insights New Funds on FundMonitors.com The Future for Small Caps Webinar Recording Magellan Global Fund Update | Magellan Asset Management A once in a generation opportunity | Insync Fund Managers April 2023 Performance News Bennelong Australian Equities Fund 4D Global Infrastructure Fund (Unhedged) Skerryvore Global Emerging Markets All-Cap Equity Fund Delft Partners Global High Conviction Strategy Bennelong Twenty20 Australian Equities Fund |
|
|
If you'd like to receive Hedge Clippings direct to your inbox each Friday |

5 May 2023 - Hedge Clippings | 05 May 2023
|
|
|
|
Hedge Clippings | 05 May 2023 "This budget will be handed down in the context of an uncertain and volatile global economy which is precariously placed." Thus Treasurer Jim Chalmers summed up his view of the challenge facing him next Tuesday following his visit to the US to meet his offshore counterparts, and things would seem to have become even more volatile and precarious since then. That was back in mid April when he returned with the message that the IMF was forecasting "an incredibly weak five years of economic growth." Since then the US banking system has gone from bad to worse following the collapse of Silicon Valley, Signature, and now First Republic Bank, with others likely to follow as investor confidence tumbles. Bank failures are not that uncommon in the US, as shown by this list from the FIDC, with some analysts estimating that over 50% of the 4,800+ US banks could be under threat. While in Australia we have a well capitalised, and much more concentrated banking landscape, we too rely on the market's - and in particular depositors' - confidence that their funds are secure, irrespective of government guarantees. While Australia's economy and budget may be insulated to a degree by record low unemployment, bracket creep, and high commodity prices, they are not immune to the stubbornly high inflation which is spreading to the services sector, and increased labour costs. Basic wage demands, along with calls for improved welfare, are likely to feature heavily in Tuesday's budget, even if any increases will be insufficient for those unable to offset the increases in their basic living costs. What is almost certain to be missing on Tuesday is any serious attempt to fix the outdated, inefficient and broken taxation system on which the welfare system relies. Meanwhile, given this week's further tightening both here and the US, seemingly the only remedy to the current inflation is higher interest rates - with the outlook for a prolonged period of both, and the risk that the desire to dampen inflation will damage the economy to the point of recession. The RBA's March quarterly Statement on Monetary Policy, released earlier today, claims at the outset that inflation has passed its peak, and expects the current level of 7% to decline to 4.5% by the end of the year, before returning to 3% by mid 2025. That's dependent on GDP growth of just 1.25% as inflation and interest rates take effect, and with recent declines in retail sales, and the post COVID slump in the Household Savings Ratio, and a 3% decline in Household Disposable Income Growth, that may well be the case. The Statement is careful to add the caveat that the "outlook is subject to a range of uncertainties," but what is certain is the Board's focus on inflation, which in the Statement's Overview gets mentioned no less than 49 times, more than interest rates, wages, labour and the economy combined. If that's not enough, it is worth taking notice of the last paragraph, and the final sentence: "The Board remains resolute in its determination to return inflation to target and will do what is necessary to achieve that." The RBA's intentions are one uncertainty Jim Chalmers won't have to deal with next Tuesday. Meanwhile, it's no secret that the small cap equity sector, having returned on average 17.42% p.a. over the past three years to be the best performing peer group in AFM's database, has struggled over the past year, falling 11.63%. There's been some recovery over the past six months, so next Tuesday at 4:15 AEST we will be hosting a "round table" webinar featuring three fund managers from the Small Cap sector.
|
|
|
News & Insights 10k Words | Equitable Investors Stock Story: QBE Insurance | Airlie Funds Management |
|
|
If you'd like to receive Hedge Clippings direct to your inbox each Friday |

5 May 2023 - Performance Report: PURE Income & Growth Fund
[Current Manager Report if available]

5 May 2023 - Resilience and attractiveness of Asian local bonds
|
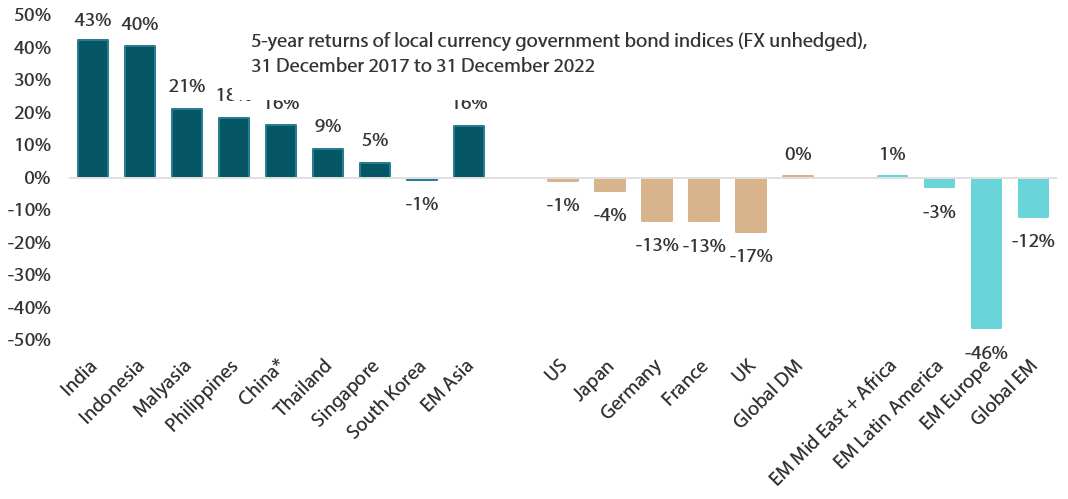
Resilience and attractiveness of Asian local bonds Nikko Asset Management April 2023 Asian local bonds have outshone global peers over the past five years From 2018 through 2022, financial markets around the world had to endure a prolonged trade war between the US and China, a global COVID-19 pandemic, rising inflation, elevated oil prices and widespread geopolitical upheavals—namely the Russian invasion of Ukraine. Another key stress factor global markets had to withstand since early 2022 was the aggressive monetary tightening by the US Federal Reserve (Fed) and other major central banks, many of which have implemented a series of interest rate hikes to quell decades-high inflation. Still, Asian local bonds (also known as Asian local currency bonds, as they are denominated in the currencies of their home countries) have shown great resilience under such trying times. As a group, these regional bonds have outperformed their global peers by a big margin over the past five years (see Chart 1). Local government bonds of India and Indonesia, for instance, turned in impressive gains of more than 43% and 40%, respectively, in local currency terms through 2018-2022, whereas those of Malaysia, the Philippines, China and Thailand all marked decent returns ranging from 9% to 21%. Conversely, most government bonds of the US, Europe and Latin America generated losses in local currency terms over the corresponding five-year period. Backed by strong fundamentals and high-quality yields (as most Asian local currency government bonds have investment grade credit ratings) coupled with lower foreign ownership (compared to five years ago) and the potential appreciation of local currencies versus the greenback, Asian local bonds currently look attractive as a fixed income asset class. In our view, regional local bonds will continue to perform well for the rest of 2023 and beyond as inflation rates in the region trend lower and Asian central banks refrain from further interest rate hikes. Moreover, we believe that the Fed, which recently hiked rates by 25 basis points (bps) at its Federal Open Market Committee (FOMC) meeting on 22 March, is near the end of its rate hike cycle. At the moment, given the ongoing global banking crisis, the market is pricing in less than a 50% chance of the Fed hiking rates at its next FOMC meeting in May. In addition, there are other supportive factors that are expected to increase the appeal of Asian local bonds, namely the post-pandemic narrowing of Asia's budget deficits, which will lead to lower issuance of local currency bonds, and the possible inclusion of these regional bonds in established global fixed income indices. Chart 1: Asian local bonds outshine global peers
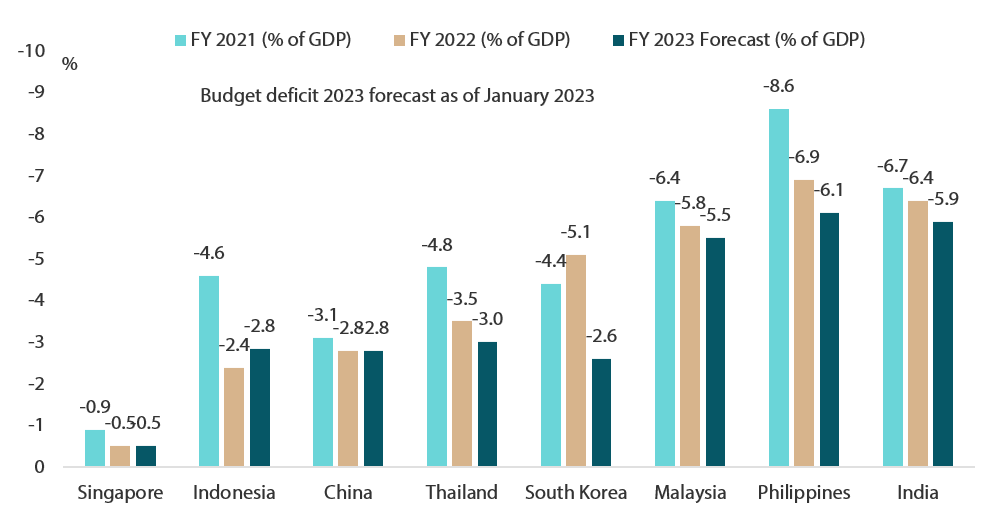
Source: Markit iBoxx, JP Morgan, Bloomberg For individual countries, we use Markit iBoxxGlobal Government Bond Indices as proxies except India, which uses iBoxxAsia India Government Index. For emerging markets composite indices, we use JPM GBI-EM Index and its sub-indices. For Global developed markets, we use JPM Global Bond Index (GBI) as proxy. *China bond index's inception was February 2019 and it has less than five years of track record. Budget deficits of Asian countries set to narrow As Asian fixed income investors, we are especially watchful of the fiscal stance of countries within in the region. During the COVID-19 pandemic, notably in 2020 and 2021, almost all Asian countries experienced increases in their fiscal deficits as they were implementing expansionary fiscal stimulus to support their respective economies during periods of lockdowns and social restrictions, which had a negative effect on business and economic activities. With the region's economies reopening amid a return to normalcy following the pandemic, various countries in Asia are now adhering to stricter fiscal discipline and have started to trim their fiscal deficits, which are forecasted to narrow this year (see Chart 2). Chart 2: Asia's budget deficits are likely to narrow going forward
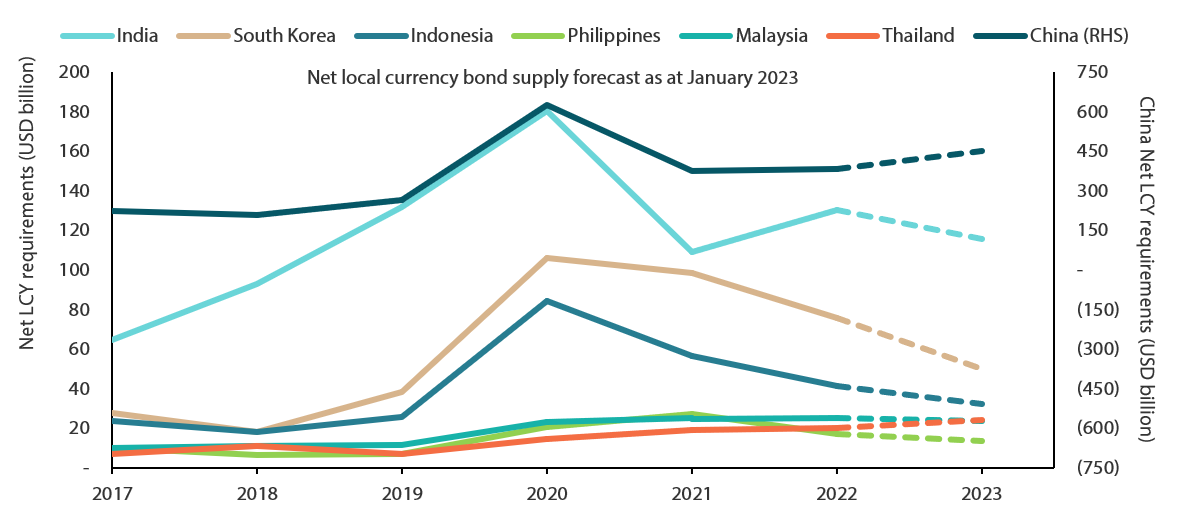
Source: MOF India, Moody's, official sources, Bloomberg, January 2023 Note: India's data comes from MOF India and Philippine's budget deficit forecast is from Fitch. A case in point is Indonesia, which has managed to narrow its fiscal deficit substantially, from -4.6% of GDP in 2021 to -2.4% in 2022. Moreover, for 2023 the Indonesian government has set a budget deficit target of 2.85% of GDP, below its statutory limit of 3%. But what implications will a reduction in the fiscal deficits of Asian economies have on regional local bonds? To start with, we expect lower fiscal deficits to ease the financing pressure faced by Asian governments and, as such, lead to a lower issuance of local currency bonds. A cutback in net issuance or supply of Asian local bonds is generally supportive of bond prices. We expect the net local currency government bond supply of most Asian countries to be lower in 2023, as compared to 2022 (see Chart 3), creating less downside price pressure for regional local bonds over the next few quarters. Chart 3: Net issuance of Asia local currency bonds projected to be lower in 2023
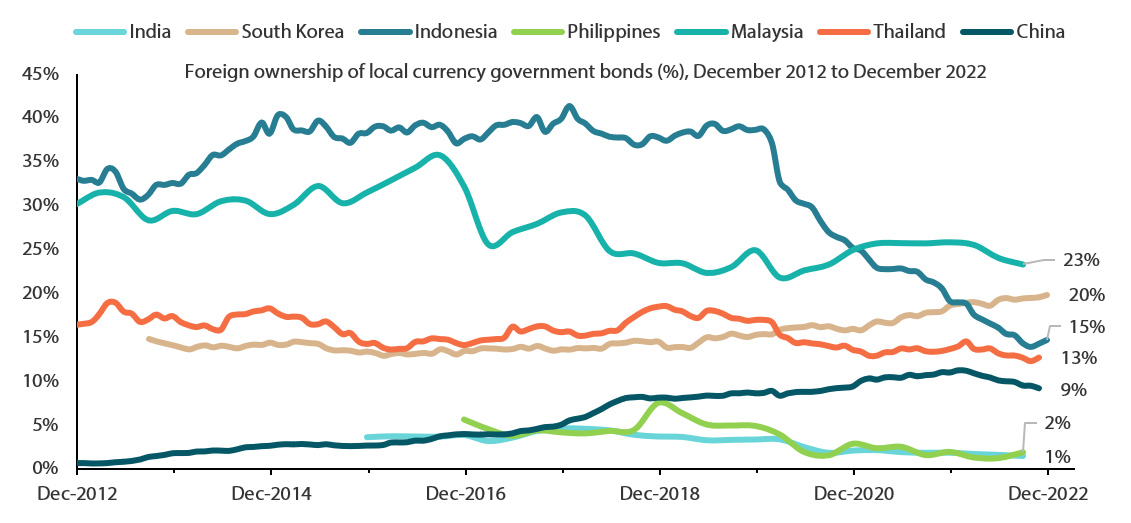
Source: ANZ, January2023 Ample room for inflows into regional bonds Since March 2022, when the Fed started to embark on an aggressive tightening of monetary policy with a series of outsized rate hikes to tame rising inflation, we have seen an outflow of funds from Asia, with the move exacerbated by the strengthening of the US dollar. However, in our view the aggressive rate hike cycle by the US central bank may not persist, given the ongoing banking crisis in the US and Europe. In addition, we believe that the Fed is now nearing the end of its tightening cycle as red-hot inflation in the US cools. Indeed, US annual inflation, as measured by the headline consumer price index (CPI), has been coming down since June 2022. For instance, the latest US annual inflation rate slowed for an eighth consecutive month to 6% in February 2023, the lowest since September 2021. Likewise, the magnitude of the Fed's interest rate increases has gradually shrunk since mid-2022, from a series of 75 bps hikes in June, July, September and November to 25-bps hikes in February and March 2023. At the moment, the Fed has to intricately balance the taming of inflation with its effort to avert a full-scale turmoil in the banking system. In the coming months, a possible pause in the Fed's tightening cycle amid a slowdown by the world's largest economy may help to stabilise the global rates market, resulting in an improvement in risk appetite. This could potentially prompt foreign funds to return to Asia as the greenback weakens. We believe that such developments will support Asian currencies and regional bonds. As at the end of 2022, foreign investors' positioning in Asian local bonds (see Chart 4) was light relative to previous years. But once the environment turns more conducive for regional bonds, we expect inflows to Asia to resume. Another factor that could spur more inflows of foreign funds into regional bonds in the near future is the possible inclusion of some Asian government bonds in established global fixed income indices. South Korea is seeking the inclusion of its government bonds to the FTSE World Government Bond Index (WGBI); similarly, India is pursuing the inclusion of its government bonds in the Bloomberg Barclays Global Aggregate Index and the JPMorgan Government Bond Index-Emerging Markets Global Diversified Index. Chart 4: Foreign holdings in Asian local currency government bonds remain low
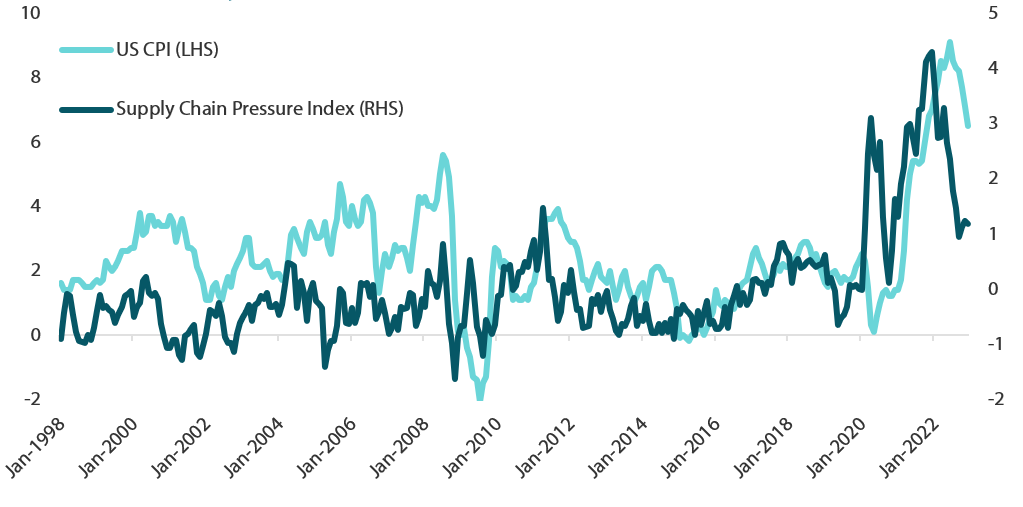
Source: ANZ, January2023 Regional central banks seen halting rate hikes as inflation in Asia eases Russia's invasion of Ukraine in February 2022 and the subsequent sanctions against Moscow by many developed countries have led to a diminished supply of major food staples, such as wheat and vegetable oils. As a result, Asia's inflation, which is largely driven by the volatile food component, rose steeply in the first three quarters of 2022. Although global food prices remain elevated amid the ongoing war in Ukraine, price pressure has eased of late, especially in the fourth quarter of 2022, as new supply chains were established. All in all, the pressure in the global supply chain is easing (see Chart 5). We see easing pressure leading to a decline in global inflation, especially in US CPI, as suggested by a recent research paper by economists from the Federal Reserve Bank of New York (New York Fed), which projects annual US CPI normalising to 3.8% within 12 months. Global supply factors are measured by the New York Fed's Global Supply Chain Pressure Index (GSCPI), which uses various global price indicators, including the producer price index and the CPI of the US and the EU. The New York Fed's academic projection of a substantial easing of US CPI in 2023 to below 4%, which is a level consistent with a soft-landing scenario, is based on the assumption that the GSCPI normalises to its historical average over 12 months. Chart 5: Global supply chain pressure is easing
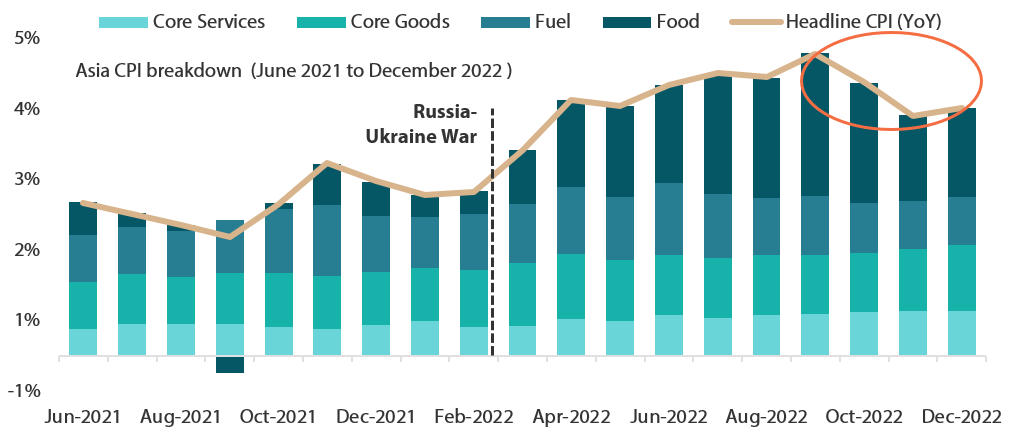
Source: Bloomberg, January 2023 At the same time, the cost-push pressure (namely the food price component) that drove Asian inflation is coming down and softening Asia's inflation outlook (see Chart 6). As inflation in the region ebbs (as evidenced in the February CPI of countries such as South Korea, Thailand, China, India, Singapore and the Philippines), Asian central banks are likely to slow the pace of monetary policy tightening. As of March 2023, several regional central banks, such as those of South Korea, Indonesia and Malaysia, have already suspended rate hikes as inflation in their countries has eased. Chart 6: Price pressure that drove inflation in Asia is easing
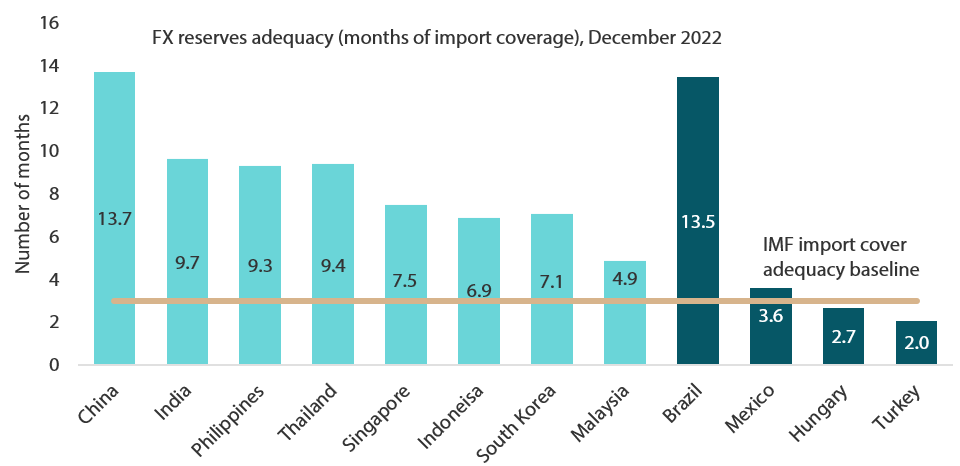
Source: Morgan Stanley, January 2023 Note: Asia includes China, Hong Kong, India, Indonesia, South Korea, Malaysia, Philippines, Taiwan, Australia and Japan. Singapore and Thailand are excluded due to a lack of data. Moreover, the purchasing managers' indexes of many Asian countries are falling in line with the global trend, whereas Asia's exports, which are still largely dependent on demand from the US and the EU, have also started to come off as growth in developed countries slows. That said, a potential recovery of exports to China may offset the slowdown. But given the overall weaker growth outlook, we expect most of Asia's central banks to pause hiking rates. In our view, Asian central banks—cognisant of the slower economic growth outlook—are likely to be less hawkish in their monetary policy stance and will be more inclined to keep interest rates accommodative, all of which should bode well for regional bonds. Asia's FX reserves remain adequate; regional currencies look cheap Asian foreign currency (FX) reserves have decreased over the past few months. They remain adequate, however, and are in accordance with the International Monetary Fund (IMF) rule of thumb from of having at least three months of imports being covered by FX reserves (see Chart 7). This underscores the sound fundamentals of Asian economies. Chart 7: Asia's FX reserves remain adequate
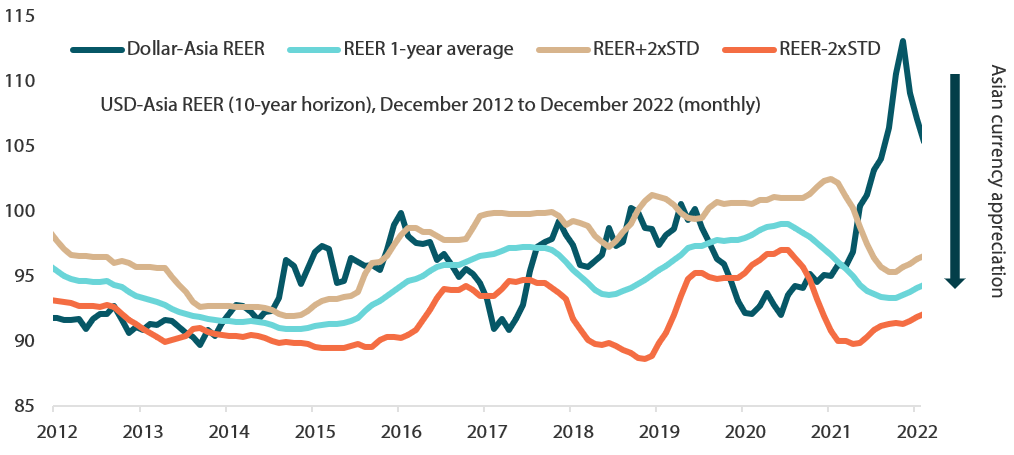
Source: Bloomberg, IMF, January 2023 In addition, Asian currencies, as measured by the real effective exchange rate (REER), currently look cheap relative to their historical long-term averages. As regional currencies weakened against the US dollar (USD) in 2021 and 2022, the USD-Asia REER had recently exceeded two standard deviations from its long-term averages, making Asian currencies cheap from a long-term perspective (see Chart 8). In our view, the environment surrounding regional currencies is improving. As mentioned, we think that dollar strength will start to fade as the Fed may be nearing the end its tightening cycle, and Asian currencies will have ample room to appreciate versus the greenback. In terms of regional currencies, we favour the Thai baht, which is seen benefiting from increased tourism inflows and current account improvement. We also like the renminbi. China's reopening and the imminent recovery in the world's second largest economy are likely to spur the renminbi to appreciate against the greenback, in our view. Chart 8: Asian currencies look cheap versus their long-term averages
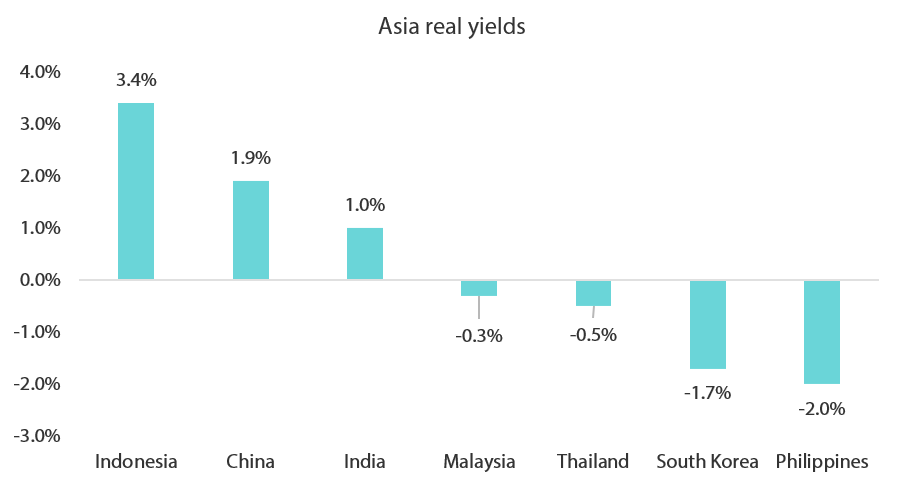
Source: Citibank, Bloomberg, January 2023 Positive on the local bonds of Indonesia, India and South Korea Within the region, we are most positive on the local currency bonds of Indonesia, India and South Korea. We expect Indonesian bonds to perform well on the back of strong foreign inflows—both portfolio fund flows and foreign direct investments (FDIs)—into the country. Indonesia is attracting considerable foreign investments on the back of its thriving electric vehicle supply chain ecosystem, which entails mining and the processing of metals all the way to the manufacturing of cathodes and battery cells. Strong FDIs into Indonesia are expected to support its economy and currency, as well as boost the appeal of its local currency government bonds, which also look attractive on a real yield (nominal yields minus core CPI) basis (see Chart 9). Chart 9: Asian local currency bonds offer attractive real yields
Source: Bloomberg, January 2023 Local currency Indian bonds also look attractive from a real yield perspective and offer a good carry. Furthermore, we expect Indian bonds to receive a fillip when the Reserve Bank of India (RBI) ends its rate hike cycle in the near future. The RBI raised its benchmark repo rate by 25 bps to 6.5% in February. Like many other Asian central banks, the RBI is waiting for inflation to make a sustained decline before it stops hiking rates and revert to a more accommodative stance as the Indian economy slows. Likewise, we expect South Korea's local currency bonds to perform well. The Bank of Korea (BOK) was one of the first central banks in the world to hike interest rates to address soaring inflation; it embarked on its tightening cycle back in August 2021 and raised benchmark interest rates seven consecutive times. In February 2023, however, the BOK paused its rate hike cycle by keeping benchmark rate steady at 3.5%. We think that South Korea could be the first country in Asia to cut interest rates. The possibility of steady or declining rates coupled with the potential inclusion in the FTSE WGBI in the future will be supportive of South Korean local currency government bonds, in our view. Summary on why Asian local bonds may outperform On the whole, we expect Asian local bonds, which have outperformed their global peers over the past several years, to thrive in the remaining quarters of 2023 and beyond, supported by a conducive global environment of lower inflation, lower growth and steady interest rates. At the same time, slower but still positive growth in Asian economies and a pause in regional central banks' policy rate adjustments will benefit the Asian local bond market, in our view. We believe that Asian central banks are nearing the end of their rate hike cycles as inflation eases and growth prospects weaken. The prospect of stable or even falling interest rates in Asia bodes well for regional bonds. Strong fundamentals, high-quality yields and low foreign ownership (and hence more room for fund flows recovery) are other factors that are supportive of Asian local bonds, which are also seen doing well as regional currencies strengthen versus the greenback. Within the region, we favour Indonesian local bonds, which could benefit from strong inflows (both FDI and foreign portfolio fund flows) and fiscal consolidation. Indian bonds continue to offer good carry as the RBI looks to end their rate hike cycle, while South Korean bonds are also favoured to outperform on rate cut expectations over the longer term and their potential inclusion into bond indices. There are risks that could alter our positive views on Asian local bonds, such as a resurgence in inflation, a big flare-up in global geopolitics and full-blown turmoil in the global banking sector, which undoubtedly will lead to widespread risk aversion in global financial markets. Those risks, while possible, are not likely to transpire in our base case scenarios, which by and large look conducive for Asian local bonds. Author: Edward Ng, Senior Portfolio Manager Funds operated by this manager: Nikko AM ARK Global Disruptive Innovation Fund, Nikko AM Global Share Fund, Nikko AM New Asia Fund, Important disclaimer information |

4 May 2023 - Performance Report: Digital Asset Fund (Digital Opportunities Class)
[Current Manager Report if available]

4 May 2023 - The twilight of China's population
|
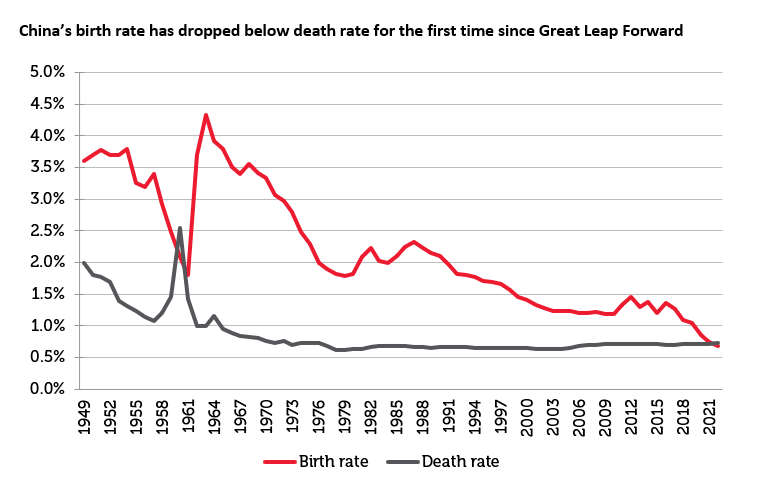
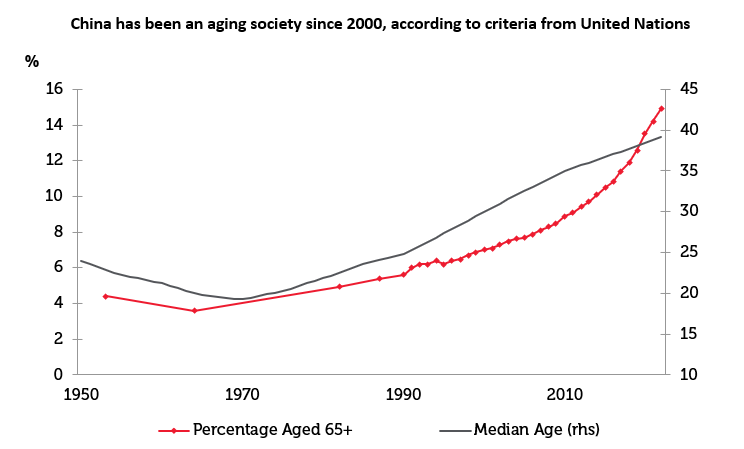
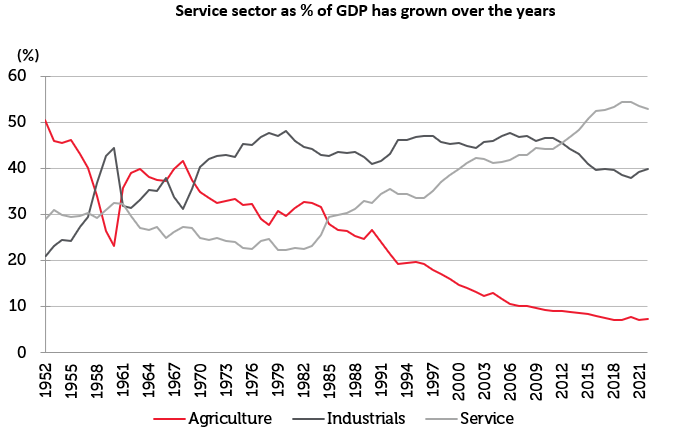
The twilight of China's population Redwheel (Channel Capital) April 2023 China's population declined last year, the first annual contraction since 1961, amid a Covid-induced sharp decrease in new births and long-term structural factors. China has followed a similar trajectory to many developing countries as having an aging population is a common demographic problem in developed countries, where birthrates have steadily declined with higher levels of income, healthcare and education. Countries such as Japan and Germany have had decades to adjust as their populations have aged gradually. China, on the other hand, has begun the aging process at an earlier stage of development and at a more accelerated pace than most countries have experienced. In 2022, official statistics revealed a decline in China's population with a fall of 850,000 from the previous year. However, for a country of more than 1.4 billion people, the difference is relatively small but shows the general trend. The central government has acknowledged the looming demographic problem with a policy package to boost births in August 2022, pledging to improve public services such as healthcare and childcare as well as to offer priorities on public housing to bigger families. Local governments have since followed suit, rolling out home purchase subsidies or allowances for families with multiple children. Despite China's population decline often presented as a crisis, we see a number of opportunities as we continue to believe China's economic growth will be driven by labour quality rather than labour quantity. We expect China's GDP to potentially grow around 5.5% to 6% in the medium term, within which service sectors should become more prominent.
Source: CEIC, Jefferies as at 31 January 2023. The information shown above is for illustrative purposes. Given the forecasted population contraction, many are concerned that the demographic crisis will turn into strong growth headwinds. In our view, the shrinking population may influence total demand, but the negative impact may not be as large or damaging as the headlines suggest. We examine the economic impact of this demographic trend on China's manufacturing and consumption.
Source: NBS, United Nations, Citi Research, as at 31 January 2023. The information shown above is for illustrative purposes. Manufacturing will see little impact
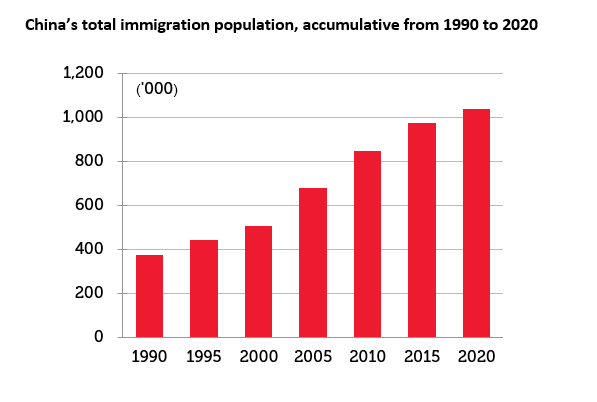
Source: CNBS/H, United Nations, Haver, as at 31 January 2023. Past performance is not a guide to future results. The information shown above is for illustrative purposes. Most developed countries actively increase immigration to mitigate population collapse. However, this is less applicable in China: from 1990 to 2020, China has seen total immigration of merely 1 million. This lack of immigration is due to both language barriers and the country's restrictive immigration policy. While we do not expect this to reverse in the foreseeable future, we do think that raising the retirement age could enable more workers to stay in the labour force for longer. China currently has the lowest retirement age among the OECD countries. China requires most men to retire at 60, white-collar women at 55 and blue-collar women at 50. That is well below the retirement age of 65 in Singapore, 67 in Germany, and 70 in Japan. The Chinese government has pledged to gradually increase the retirement age by 2025. We believe this could offset some of the impacts from the declining labor force.
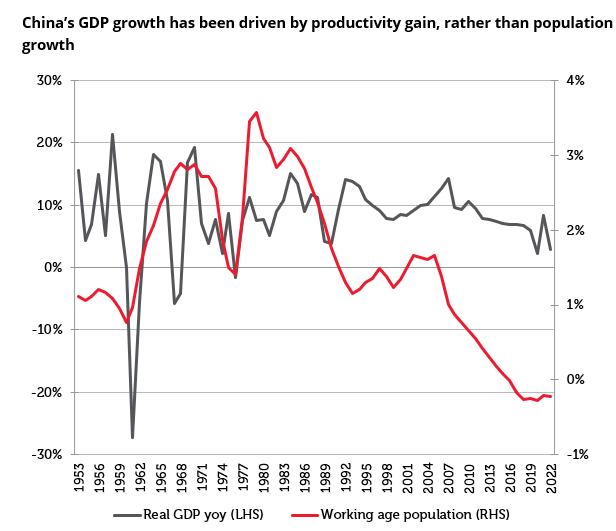
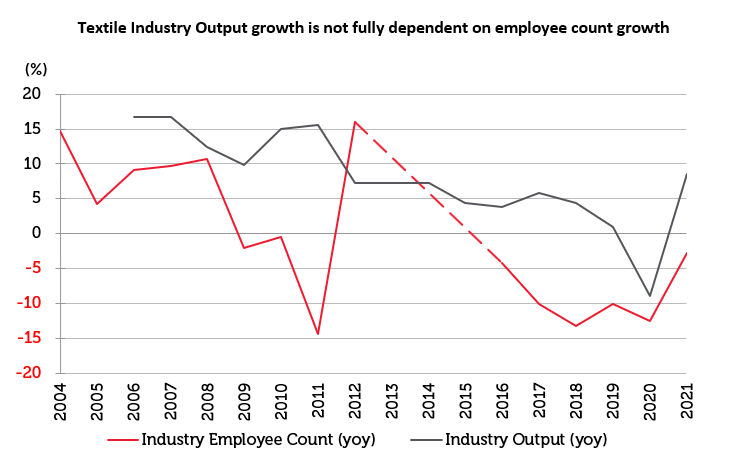
Source: United Nations, as at 31 January 2023. The information shown above is for illustrative purposes. Labour aside, productivity gain should continue to be the key contributing factor for growth. China's manufacturing sector has seen a strong productivity improvement in the past three decades. Since joining the World Trade Organisation (WTO), China has established massive production scale and expanded into several diverse industries. The economies of scale and comparatively integrated industrial chain have created impeccable production efficiency and cost effectiveness, which offers a significant advantage to other nations in comparison. Looking at the labour-intensive textile industry as an example, in addition to mass production, China's cost advantage in the textile industry stems from the fact that China leads the upstream production of polyester. China has about 80% of the world's polyester production capacity, which provides unparalleled cost advantages to local fabric manufacturers and subsequently the garment producers. China, therefore, has remained a production powerhouse in apparel, which might seem to be among the easiest to shift to lower-cost countries. However, China remains at the forefront of FDI inflows into neighbouring regions such as Vietnam as China aims to move up the value chain and give priority to projects which could generate high value products and operate using cutting edge technologies.
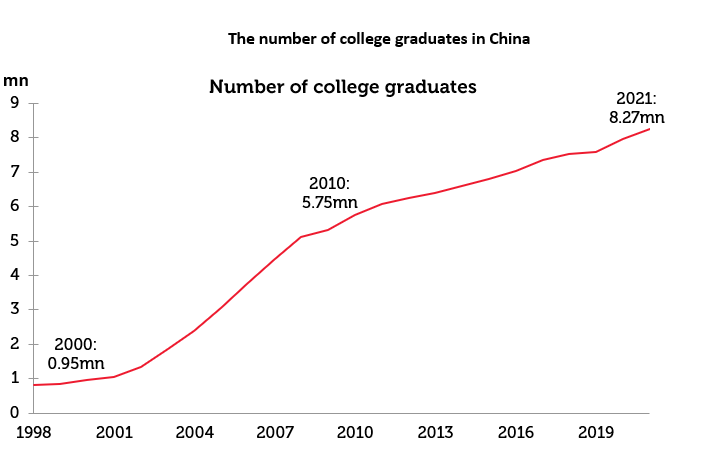
Source: National Bureau of Statistics, as at 31 January 2023. The information shown above is for illustrative purposes. Past performance is not a guide to future results. Going forward, we expect China's productivity to gradually improve. Its productivity gain could come from rising investment in human capital, further urbanisation and technology-driven efficiency improvement.
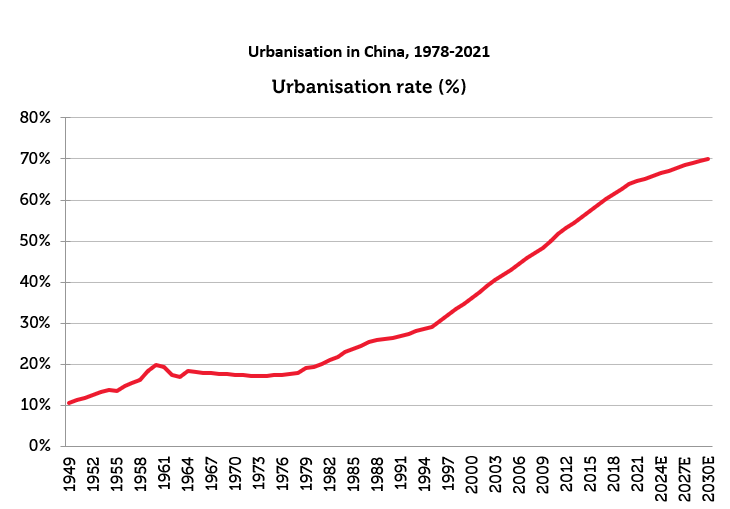
Source: United Nations, National Bureau of Statistics as at 31 January 2023. The information shown above is for illustrative purposes. Urban migration has been a major source of cheap labor in China. As people move from villages to cities, productivity tends to increase significantly due to the productivity differentials between agriculture and industry. Additionally, there is a change in consumption spending growth as consumers look to increase spending on property and durable goods, such as cars and appliances. China's urbanisation rate rose from 36% in 2000 to 65% in 2021, which remains low compared to developed countries such as Japan (92%) and the United States (83%). While facing higher costs, China's improved labour productivity should allow it to compete with quality in the next wave of industrial prosperity.
Source: National Bureau of Statistics as at 31 January 2023. The information shown above is for illustrative purposes.
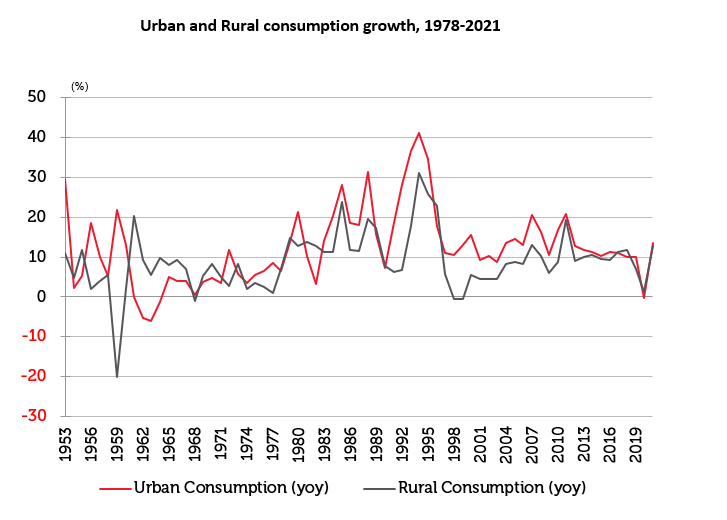
Source: CEIC. The information shown above is for illustrative purposes. Forecasts and estimates are based upon subjective assumptions. Finally, new technology, such as automation and artificial intelligence, could reduce the demand for labour and extend the working lives of the labour force in general while maintaining output growth. China has been the world's largest industrial robot market since 2013. With the aid of government policy to push towards automation across industries, we expect China to keep leading in robot adoption and production in the next decade. More importantly, similar to Korea, China is making great strides in high-tech industries in which it still accounts for a relatively small share of global markets, such as renewables, machines, tools and pharmaceuticals. As a result of these factors, we believe China's productivity improvement will continue to outweigh the lack of population growth when it comes to manufacturing. We, therefore, see the impact from labour on growth to be minimal. Unlike manufacturing, consumption should see structural changes
Source: National Bureau of Statistics, CICC, as at 31 January 2023. Past performance is not a guide to future results. The information shown above is for illustrative purposes. Conversely, businesses in areas such as child-care and higher education will face a smaller market cohort should the number of newborns fail to stabilise. These sectors are at a natural disadvantage. We think that population and demographic changes will bring both rising and receding prospects to China's general consumption. We are selectively constructive in the service sector, where both the policy and market set-up are much more favourable. While the demographic shift is often presented as a crisis for China, we see immense opportunities in these challenges. We think that China's economic growth will be driven by labour quality rather than labour quantity, which will partly offset the impact of a declining population. We expect China's GDP to grow around 5.5% to 6% in the medium term, within which service sectors should become more prominent. Against this backdrop, we are well positioned for opportunities in these growth areas: new technologies, smart manufacturing, healthcare, insurance, and consumer services. |
|
Funds operated by this manager: CC Redwheel Global Emerging Markets Fund, CC Redwheel China Equity Fund Key information: No investment strategy or risk management technique can guarantee returns or eliminate risks in any market environment. Past performance is not a guide to future results. The prices of investments and income from them may fall as well as rise and an investor's investment is subject to potential loss, in whole or in part. Forecasts and estimates are based upon subjective assumptions about circumstances and events that may not yet have taken place and may never do so. The statements and opinions expressed in this article are those of the author as of the date of publication, and do not necessarily represent the view of Redwheel. This article does not constitute investment advice and the information shown is for illustrative purposes only. |

3 May 2023 - Performance Report: PURE Resources Fund
[Current Manager Report if available]

3 May 2023 - ESG in 10 Podcast: Artificial Intelligence and Big Tech
|
ESG in 10 Podcast: Artificial Intelligence and Big Tech Alphinity Investment Management April 2023 Episode 4- Artificial Intelligence and Big Tech - What does this mean for responsible investors? Charlotte O' Meara is joined by Mary Manning and Jessica Cairns, Alphinity Investment Management. This information is for advisers & wholesale investors only. |
|
Funds operated by this manager: Alphinity Australian Share Fund, Alphinity Concentrated Australian Share Fund, Alphinity Global Equity Fund, Alphinity Sustainable Share Fund Disclaimer |

2 May 2023 - Performance Report: Equitable Investors Dragonfly Fund
[Current Manager Report if available]

